

Reports
View work volume, completion performance, and maintenance activity reports in Optimo Mobile.
Reports
The Reports module allows users to monitor maintenance work and understand how much work has been created, completed, and managed over a selected period. The Work Volume report provides an overview of work orders, completion rates, work types, priorities, and top sites.
Users can select a customer and reporting period to review the available information.
1. View the Work Volume Report
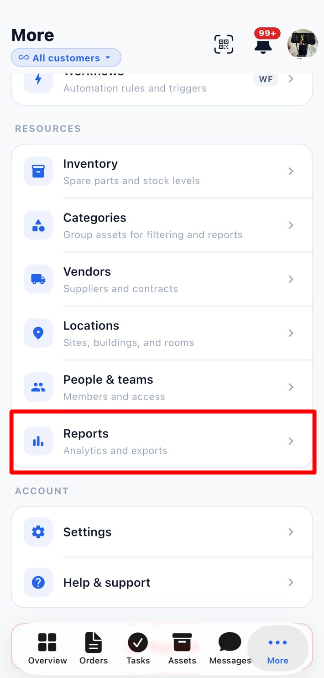
The Work Volume report displays summary cards and charts that help users understand the volume of maintenance work and completion performance.
1.1 Select a Customer
The customer selector at the top of the page allows users to choose which customer's report they want to view.
| Option | Description |
|---|---|
| All customers | Displays the report for all customers available to the user. |
| Customer selector | Allows users to select a specific customer, where available. |
Steps to Select a Customer:
- Open the Reports module.
- Click the customer selector at the top of the page.
- Select the required customer or keep All customers selected.
- Review the report for the selected customer.
1.2 Select the Reporting Period
The report provides three period options:
| Option | Description |
|---|---|
| 3mo | Displays report information for the selected three-month period. |
| 6mo | Displays report information for the selected six-month period. |
| 12mo | Displays report information for the selected twelve-month period. |
Steps to Change the Reporting Period:
- Locate the period selector on the Reports page.
- Select 3mo, 6mo, or 12mo.
- Review the summary cards and charts for the selected period.
Note: The screenshots show 6mo selected.
2. Work Volume Summary
The summary cards provide a quick overview of created work orders, completed work orders, the completion rate, and the average monthly work volume.
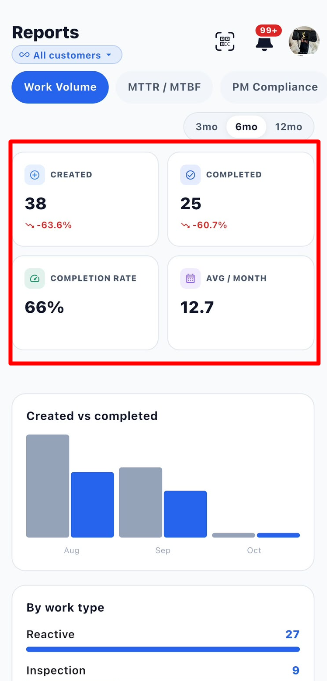
| Metric | Description |
|---|---|
| Created | Displays the number of work orders created during the selected reporting period. |
| Completed | Displays the number of work orders completed during the selected reporting period. |
| Completion Rate | Shows the completion rate displayed by the report. |
| Avg / Month | Displays the average monthly work volume shown in the report. |
The report may also display percentage changes for metrics such as Created and Completed, allowing users to compare performance with the reference period used by the application.
Example from the Screenshot
| Metric | Displayed Value |
|---|---|
| Created | 38 |
| Completed | 25 |
| Completion Rate | 66% |
| Avg / Month | 12.7 |
These values are examples from the provided screenshot. Actual values depend on the selected customer, reporting period, and available work order data.
3. Created vs Completed
The Created vs completed chart compares the number of work orders created with the number completed during each displayed month.
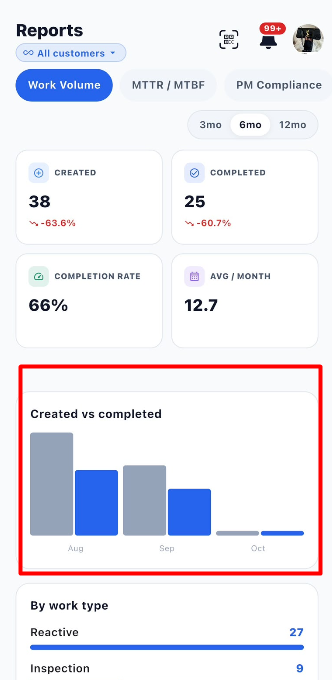
This chart helps users understand whether work is being completed in line with the volume of work being created.
| Chart Element | Description |
|---|---|
| Created | Represents work orders created during the displayed period. |
| Completed | Represents work orders completed during the displayed period. |
| Month labels | Identify the months represented in the chart. |
| Bars | Provide a visual comparison of created and completed work orders. |
How to Review the Chart:
- Select the required customer and reporting period.
- Locate the Created vs completed chart.
- Compare the bars for each displayed month.
- Review the difference between created and completed work orders.
4. Work Volume by Work Type
The By work type section shows how work orders are distributed across different work types.
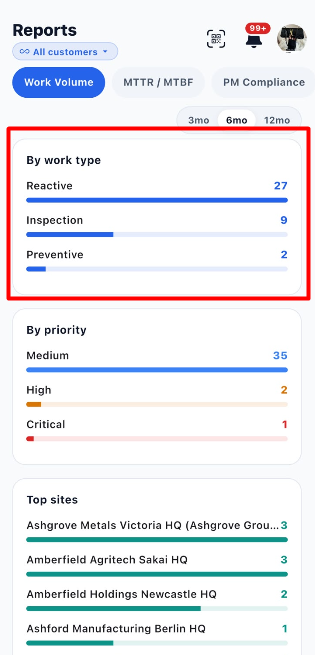
The screenshot displays work types such as Reactive, Inspection, and Preventive.
| Work Type | Example Count |
|---|---|
| Reactive | 27 |
| Inspection | 9 |
| Preventive | 2 |
How to Review Work Types:
- Scroll to the By work type section.
- Review the work types listed.
- Check the count displayed beside each work type.
- Compare the progress bars to understand the relative distribution of work.
This section helps users identify which types of maintenance work account for the largest share of the reported workload.
5. Work Volume by Priority
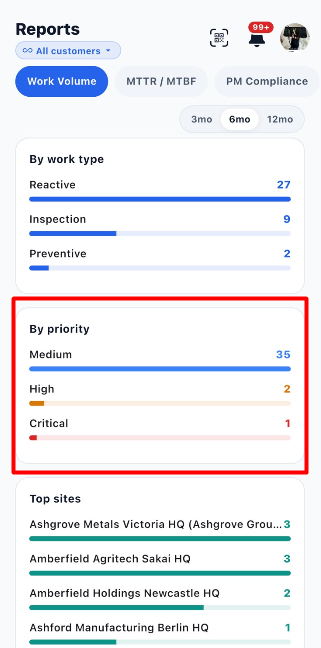
The By priority section displays the distribution of work orders according to their priority.
| Priority | Example Count |
|---|---|
| Medium | 35 |
| High | 2 |
| Critical | 1 |
How to Review Priorities:
- Scroll to the By priority section.
- Review each listed priority.
- Check the number displayed beside each priority.
- Compare the progress bars to understand the distribution of work orders by priority.
This information helps users understand how work is distributed across priority levels.
6. Top Sites
The Top sites section lists sites with their corresponding work volume for the selected reporting period.
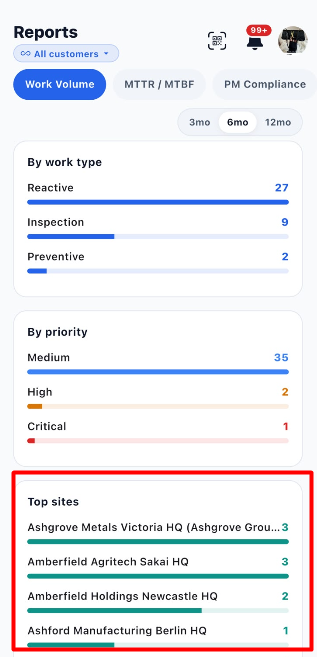
The report displays site names and visual bars representing their reported values.
| Information | Description |
|---|---|
| Site name | Identifies the site included in the report. |
| Displayed value | Shows the value associated with the site in the report. |
| Progress bar | Provides a visual comparison between the listed sites. |
How to Review Top Sites:
- Scroll to the Top sites section.
- Review the listed sites.
- Check the displayed values.
- Compare the progress bars to identify sites with higher reported work volume.
7. Steps to Review the Work Volume Report
- Open the Reports module.
- Select the required customer or keep All customers selected.
- Choose a reporting period: 3mo, 6mo, or 12mo.
- Review the Created and Completed metrics.
- Check the Completion Rate and Avg / Month values.
- Review the Created vs completed chart.
- Scroll down to examine By work type.
- Review By priority to understand the distribution of work by priority.
- Review Top sites to compare the sites listed in the report.
- Change the customer or reporting period when you need to review a different set of results.
8. Important Notes
- The Work Volume tab provides a summary of maintenance work and completion performance.
- Report values depend on the selected customer, reporting period, and available data.
- The counts shown in this document are examples from the screenshots, not fixed values.
- Use the charts and summary cards together to understand work volume and completion performance.
9. MTTR / MTBF Report
The MTTR / MTBF tab in the Reports module helps users understand maintenance response and repair time, as well as how reliably assets operate between failures. It displays summary metrics, a reliability score, and trend charts for the selected reporting period.
9.1 Summary Metrics
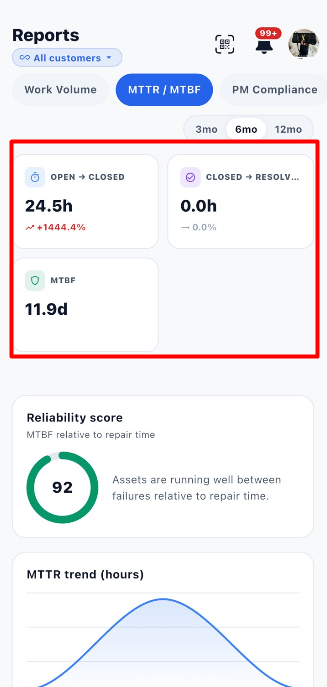
The summary cards display the time taken to move between work order statuses and the average time assets operate between failures.
| Metric | Description | Example from Screenshot |
|---|---|---|
| Open → Closed | Displays the time associated with moving a work order from Open to Closed. | 24.5h |
| Closed → Resolved | Displays the time associated with the Closed-to-Resolved transition. The exact calculation depends on the application's reporting logic. | 0.0h |
| MTBF | Mean Time Between Failures. Indicates the average operating time between asset failures. | 11.9d |
The report may also display percentage changes beneath the metrics. These indicate the change calculated by the application relative to its comparison period.
Example: The screenshot displays 24.5h for Open → Closed, 0.0h for Closed → Resolved, and 11.9d for MTBF. Actual values depend on the selected customer, reporting period, and available data.
9.2 Reliability Score
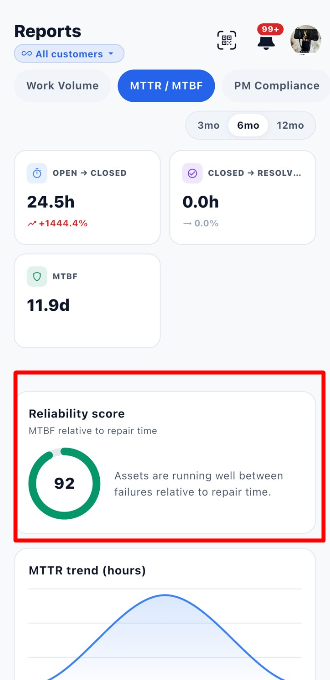
The Reliability score section displays a score alongside a short explanation of asset reliability relative to repair time.
| Item | Description |
|---|---|
| Reliability score | Displays the score calculated by the application. |
| Circular indicator | Visually represents the displayed score. |
| Explanatory text | Provides context about how assets are operating between failures relative to repair time. |
In the provided screenshot, the reliability score is 92. The screen explains that assets are running well between failures relative to repair time.
How to Review the Reliability Score:
- Open the MTTR / MTBF report.
- Select the required reporting period.
- Locate the Reliability score section.
- Review the score and the explanatory text.
Note: The screenshot does not show the complete formula or scoring scale, so the score should be interpreted using the information provided by the application.
9.3 MTTR Trend (Hours)
The MTTR trend (hours) chart displays the trend in Mean Time to Repair over the reporting period.
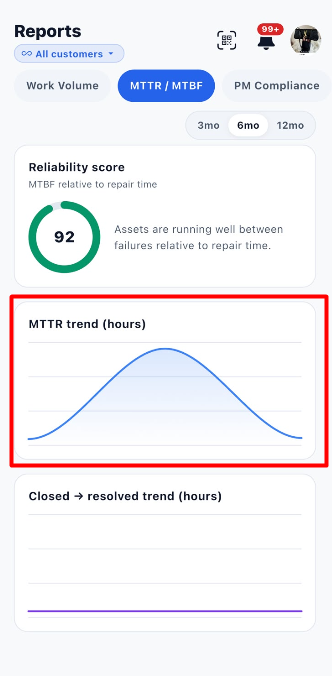
MTTR represents the average time required to repair an asset or resolve a failure, according to the application's calculation.
How to Review the MTTR Trend:
- Scroll to the MTTR trend (hours) chart.
- Review the curve to understand how repair time changes across the displayed period.
- Compare the trend across reporting periods, if required.
- Use the trend to help identify changes in repair performance.
A higher MTTR generally indicates longer repair times, while a lower MTTR generally indicates faster repairs. The exact values and time intervals depend on the report data.
9.4 Closed → Resolved Trend (Hours)
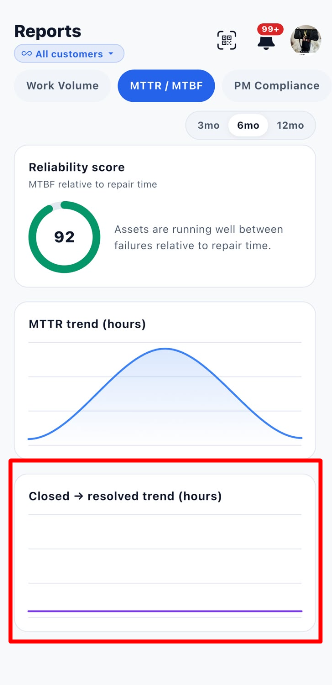
The Closed → resolved trend (hours) chart displays the trend for the Closed-to-Resolved status transition.
How to Review the Trend:
- Scroll to the Closed → resolved trend (hours) chart.
- Review the displayed line.
- Compare the trend over the selected reporting period.
- Use the displayed information to understand changes in the time associated with this status transition.
The provided screenshot shows a nearly flat line. This is a visual representation of the displayed data; the exact underlying values are not shown in the screenshot.
9.5 Steps to Review the MTTR / MTBF Report
- Open the Reports module.
- Select a customer, or keep All customers selected.
- Click MTTR / MTBF.
- Choose the reporting period: 3mo, 6mo, or 12mo.
- Review Open → Closed.
- Review Closed → Resolved.
- Check the MTBF value.
- Review the Reliability score.
- Examine the MTTR trend (hours) chart.
- Examine the Closed → resolved trend (hours) chart.
- Change the customer or reporting period if you need to review different data.
9.6 Important Notes
- MTTR refers to Mean Time to Repair.
- MTBF refers to Mean Time Between Failures.
- The displayed values depend on the selected customer, reporting period, and available data.
- The screenshots provide summary metrics and trend charts but do not show the complete calculation formulas.
- Use the metrics and charts together to understand maintenance repair times and asset reliability.
10. PM Compliance Report
The PM Compliance tab in the Reports module helps users monitor how well preventive maintenance work orders are being completed on time. It displays the overall PM compliance percentage, the number of work orders completed on time, overdue work orders, and the total number of preventive work orders.
Users can select a customer and reporting period to review preventive maintenance performance.
10.1 PM Compliance Percentage
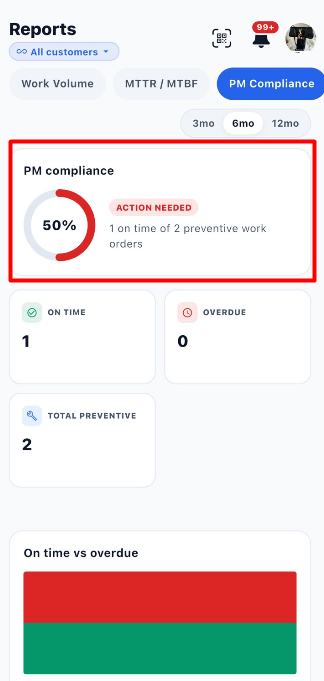
The PM compliance section displays the percentage of preventive maintenance work orders completed on time.
| Item | Description |
|---|---|
| PM compliance | Displays the overall preventive maintenance compliance percentage. |
| Circular indicator | Provides a visual representation of the compliance percentage. |
| Action Needed | Indicates that attention is required based on the compliance result. |
| On-time summary | Shows how many preventive work orders were completed on time out of the total displayed. |
In the provided screenshot, PM compliance is 50%, with the message Action Needed. The summary states that 1 out of 2 preventive work orders was completed on time.
10.2 Summary Metrics
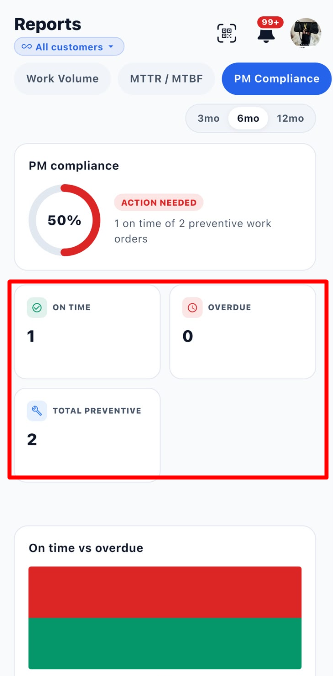
The report displays three summary cards that provide more details about preventive maintenance performance.
| Metric | Description | Example from Screenshot |
|---|---|---|
| On Time | Number of preventive work orders completed on time. | 1 |
| Overdue | Number of preventive work orders shown as overdue. | 0 |
| Total Preventive | Total number of preventive work orders included in the report. | 2 |
These values are examples from the screenshot. Actual values depend on the selected customer, reporting period, and available data.
10.3 On Time vs Overdue
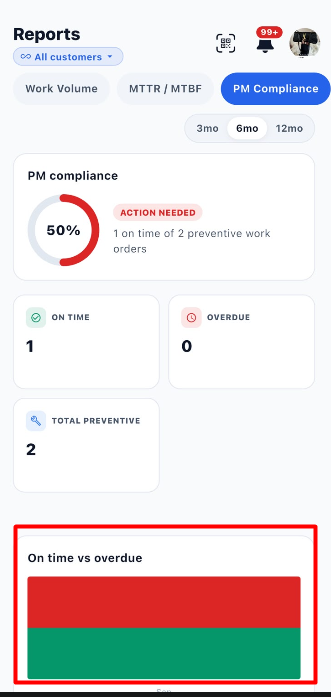
The On time vs overdue chart provides a visual comparison of preventive maintenance work orders completed on time and those classified as overdue.
| Chart Category | Description |
|---|---|
| On time | Represents preventive maintenance work orders completed within the required time. |
| Overdue | Represents preventive maintenance work orders classified as overdue. |
Steps to Review the Chart:
- Open the PM Compliance tab.
- Select the required reporting period.
- Scroll to the On time vs overdue chart.
- Review the displayed chart to compare on-time and overdue work.
- Compare the chart with the summary metrics above it.
Note: The screenshot shows the chart's colored sections, but it does not provide a visible legend. Confirm the exact color-to-category mapping from the application if needed.
10.4 Steps to Review PM Compliance
- Open the Reports module.
- Select a customer or keep All customers selected.
- Click PM Compliance.
- Choose the reporting period: 3mo, 6mo, or 12mo.
- Review the PM compliance percentage.
- Check whether the report displays Action Needed.
- Review the On Time count.
- Review the Overdue count.
- Check the Total Preventive count.
- Examine the On time vs overdue chart.
- Change the customer or reporting period to review different data, if required.
10.5 Important Notes
- PM Compliance helps users monitor preventive maintenance completion performance.
- The compliance percentage and summary counts depend on the selected reporting period and available data.
- Action Needed is displayed in the provided screenshot alongside a 50% compliance score.
- Use the summary cards and chart together to understand preventive maintenance performance.
11. SLA Report
The SLA (Service Level Agreement) report helps users monitor whether maintenance work orders meet the required response and resolution targets. It displays response compliance, resolution compliance, the number of work orders covered by an SLA, breached work orders, and compliance trends.
Users can select a customer and reporting period to review SLA performance.
11.1 SLA Summary Metrics
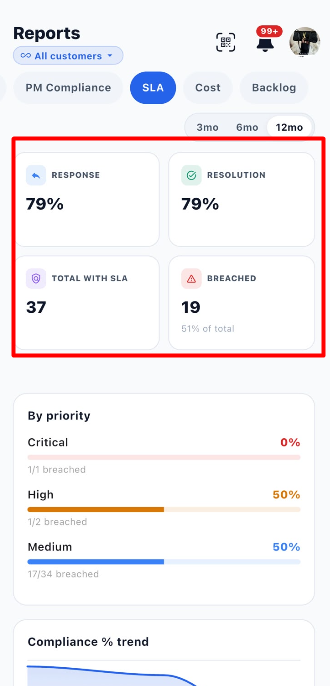
The summary cards provide an overview of response performance, resolution performance, and SLA compliance.
| Metric | Description | Example from Screenshot |
|---|---|---|
| Response | Displays the response compliance percentage. | 79% |
| Resolution | Displays the resolution compliance percentage. | 79% |
| Total with SLA | Displays the number of work orders covered by an SLA. | 37 |
| Breached | Displays the number of work orders that breached their SLA. | 19 |
The screenshot also shows 51% of total beneath the Breached count. This indicates the proportion of SLA-covered work orders that breached their SLA, as displayed by the application.
Understanding the Metrics:
- Response: Helps users understand how well work orders meet their response targets.
- Resolution: Helps users understand how well work orders meet their resolution targets.
- Total with SLA: Shows how many work orders have an SLA associated with them.
- Breached: Shows how many work orders did not meet their applicable SLA requirements.
11.2 SLA Compliance by Priority
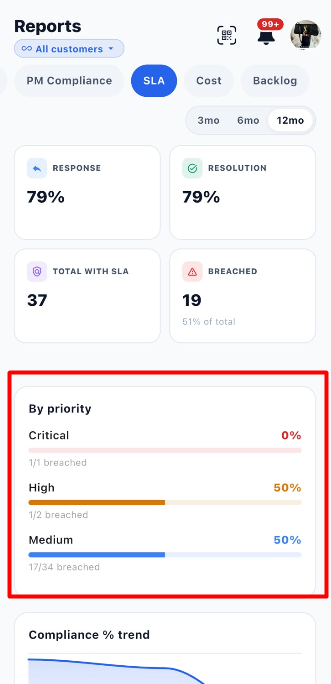
The By priority section breaks down SLA performance according to work order priority. This helps users identify which priority levels have SLA breaches.
| Priority | Compliance | Breach Information |
|---|---|---|
| Critical | 0% | 1 out of 1 breached |
| High | 50% | 1 out of 2 breached |
| Medium | 50% | 17 out of 34 breached |
These values are examples from the provided screenshot and may change according to the selected customer and reporting period.
How to Read the Priority Section:
- Priority name: Identifies the work order priority.
- Percentage: Displays the compliance percentage for that priority.
- Progress bar: Provides a visual representation of the displayed percentage.
- Breach count: Shows the number of breached work orders relative to the total for that priority.
Steps to Review SLA by Priority:
- Open the SLA report.
- Select the required reporting period.
- Scroll to the By priority section.
- Review the Critical, High, and Medium priority results shown.
- Compare the compliance percentages and breach counts.
- Identify the priority levels that may require further attention.
11.3 Compliance % Trend
The Compliance % trend chart displays how SLA compliance changes over the selected reporting period.
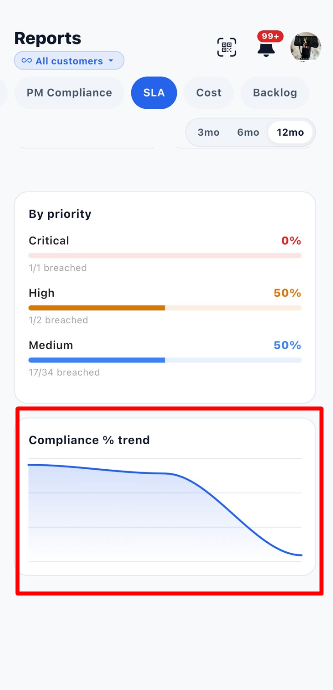
The chart uses a line to show the trend in compliance. Changes in the line help users identify periods when compliance increased or decreased.
Steps to Review the Trend:
- Open the SLA report.
- Select the required customer and reporting period.
- Scroll to the Compliance % trend chart.
- Review the direction of the line.
- Compare the trend with the response, resolution, and breach metrics.
Note: The screenshot shows the trend line but does not display exact data values for individual points. Use the chart to understand the overall direction rather than assuming exact percentages for specific dates.
11.4 Steps to Review the SLA Report
- Open the Reports module.
- Select a customer or keep All customers selected.
- Click the SLA tab.
- Select 3mo, 6mo, or 12mo.
- Review the Response percentage.
- Review the Resolution percentage.
- Check Total with SLA.
- Check the Breached count and displayed percentage.
- Review the By priority section.
- Examine the Compliance % trend chart.
- Change the customer or reporting period if you need to review different data.
11.5 Important Notes
- The SLA report helps users monitor response and resolution compliance.
- A breached work order indicates that the applicable SLA requirement was not met.
- Priority-level results help users identify where breaches are occurring.
- Report values depend on the selected customer, reporting period, and available data.
12. Cost Report
The Cost tab in the Reports module helps users understand maintenance-related expenses for the selected customer and reporting period. It displays the total spend, parts spend, labor spend, average monthly cost, cost comparisons, assets with their associated costs, and costs by category.
Users can select a customer and reporting period to review the available cost information.
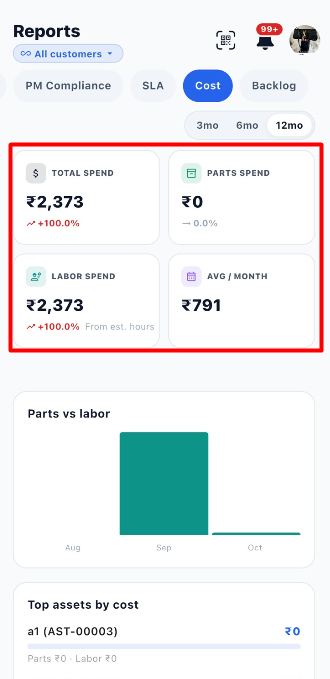
12.1 Cost Summary Metrics
The summary cards provide an overview of maintenance costs during the selected reporting period.
| Metric | Description | Example from Screenshot |
|---|---|---|
| Total Spend | Displays the total maintenance spend recorded in the report. | ₹2,373 |
| Parts Spend | Displays the cost associated with parts. | ₹0 |
| Labor Spend | Displays the labor cost recorded in the report. | ₹2,373 |
| Avg / Month | Displays the average monthly spend. | ₹791 |
The report may also display percentage changes beneath the Total Spend and Labor Spend values. These indicate the change calculated by the application relative to its comparison period.
The Labor Spend card also displays the note From est. hours, indicating that the displayed labor cost is associated with estimated hours.
Example from the screenshot: Total Spend is ₹2,373, Parts Spend is ₹0, Labor Spend is ₹2,373, and Avg / Month is ₹791. These are example values and may change according to the selected customer, reporting period, and available data.
12.2 Parts vs Labor
The Parts vs labor chart compares parts costs and labor costs over the months displayed in the report.
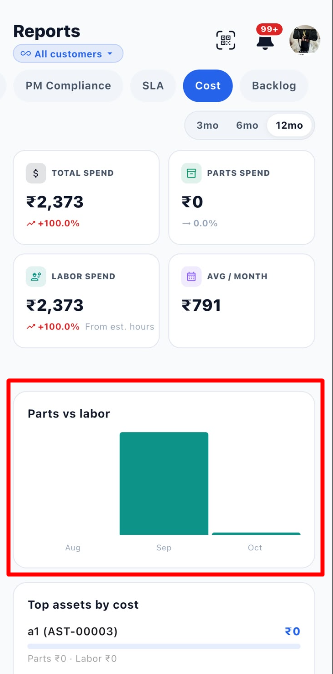
This chart helps users understand how maintenance spending is distributed between parts and labor.
| Chart Element | Description |
|---|---|
| Months | Displays the months included in the chart. |
| Bars | Visually represent the cost values for the displayed categories or periods. |
| Parts cost | Represents spending associated with parts. |
| Labor cost | Represents spending associated with labor. |
Steps to Review the Chart:
- Open the Cost report.
- Select the required reporting period.
- Locate the Parts vs labor chart.
- Compare the displayed bars across the months.
- Review the chart alongside the Parts Spend and Labor Spend summary cards.
Note: The screenshot does not display a visible legend identifying each bar's color. Use the chart together with the summary cards to understand the reported costs.
12.3 Top Assets by Cost
The Top assets by cost section lists assets and their associated maintenance costs.
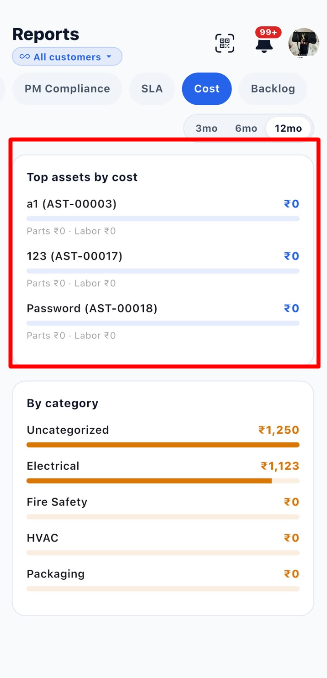
Each entry displays the asset name, asset identifier, total cost value, and a breakdown of parts and labor costs.
| Information | Description |
|---|---|
| Asset name | Identifies the asset included in the report. |
| Asset ID | Displays the asset's unique identifier. |
| Cost value | Displays the cost associated with the asset. |
| Parts | Displays the parts cost recorded for the asset. |
| Labor | Displays the labor cost recorded for the asset. |
| Progress bar | Provides a visual representation of the displayed cost. |
Example from the screenshot:
| Asset | Displayed Cost |
|---|---|
| a1 (AST-00003) | ₹0 |
| 123 (AST-00017) | ₹0 |
| Password (AST-00018) | ₹0 |
The screenshot shows ₹0 for each listed asset, with Parts ₹0 and Labor ₹0.
Steps to Review Top Assets by Cost:
- Open the Cost report.
- Scroll to Top assets by cost.
- Review the listed asset names and identifiers.
- Check the cost displayed for each asset.
- Review the parts and labor breakdown beneath each asset.
12.4 Cost by Category
The By category section groups maintenance spending according to the category assigned to the recorded costs.
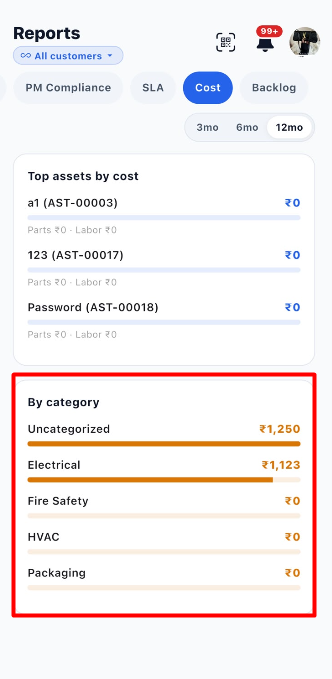
This section helps users identify which categories account for the reported maintenance expenses.
Example from the screenshot:
| Category | Displayed Cost |
|---|---|
| Uncategorized | ₹1,250 |
| Electrical | ₹1,123 |
| Fire Safety | ₹0 |
| HVAC | ₹0 |
| Packaging | ₹0 |
| Information | Description |
|---|---|
| Category name | Identifies the category associated with the cost. |
| Cost amount | Displays the recorded spending for that category. |
| Progress bar | Provides a visual comparison of the category costs. |
Steps to Review Costs by Category:
- Open the Cost report.
- Scroll to the By category section.
- Review the categories displayed.
- Check the cost amount beside each category.
- Compare the progress bars to identify categories with higher recorded spending.
Note: Uncategorized costs are displayed separately from named categories. The screenshot does not specify how costs are assigned to categories, so the assignment rules should be confirmed from the application's configuration if required.
12.5 Steps to Review the Cost Report
- Open the Reports module.
- Select the required customer or keep All customers selected.
- Click the Cost tab.
- Select 3mo, 6mo, or 12mo.
- Review Total Spend.
- Check Parts Spend and Labor Spend.
- Review Avg / Month.
- Examine the Parts vs labor chart.
- Review Top assets by cost.
- Examine By category to understand the distribution of spending.
- Change the customer or reporting period if you need to review different data.
12.6 Important Notes
- The Cost report provides an overview of recorded maintenance expenses.
- Parts Spend and Labor Spend help distinguish parts-related costs from labor costs.
- Top assets by cost shows the asset-level cost information displayed by the report.
- By category groups recorded costs by category.
- The displayed values depend on the selected customer, reporting period, and available data.
13. Backlog Report
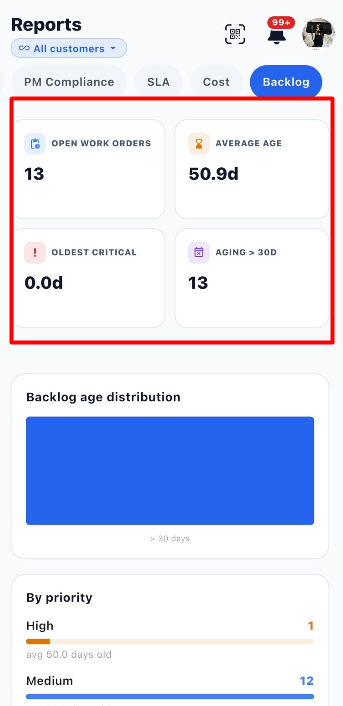
The Backlog tab in the Reports module helps users monitor open work orders that are still awaiting completion. It provides an overview of the number of open work orders, their average age, the oldest critical work order, and the number of work orders that have been open for more than 30 days.
This report helps maintenance teams identify pending work, monitor delays, and prioritize work orders that need attention.
13.1 Backlog Summary Metrics
The summary cards display key information about the current work order backlog.
| Metric | Description | Example from Screenshot |
|---|---|---|
| Open Work Orders | Displays the number of work orders that are currently open. | 13 |
| Average Age | Displays the average age of the open work orders. | 50.9 days |
| Oldest Critical | Displays the age of the oldest critical work order. | 0.0 days |
| Aging > 30d | Displays the number of work orders that have been open for more than 30 days. | 13 |
Understanding the metrics:
- Open Work Orders: Shows how many work orders are still pending completion.
- Average Age: Helps users understand how long work orders have generally remained open.
- Oldest Critical: Highlights the age of the oldest critical work order, helping teams monitor urgent maintenance work.
- Aging > 30d: Identifies work orders that have remained open for more than 30 days and may require follow-up.
Example: The screenshot shows 13 open work orders, an average age of 50.9 days, and 13 work orders older than 30 days.
13.2 Backlog Age Distribution
The Backlog age distribution chart provides a visual representation of how long open work orders have remained unresolved.
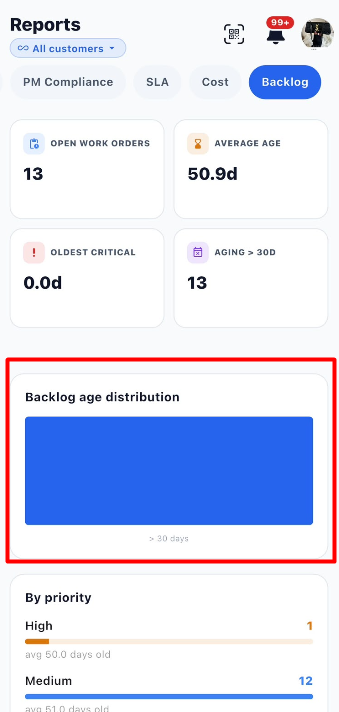
The screenshot displays a blue bar with the category > 30 days, indicating that the displayed backlog is associated with work orders older than 30 days.
This chart helps users identify aging work orders that may need additional attention.
13.3 Backlog by Priority
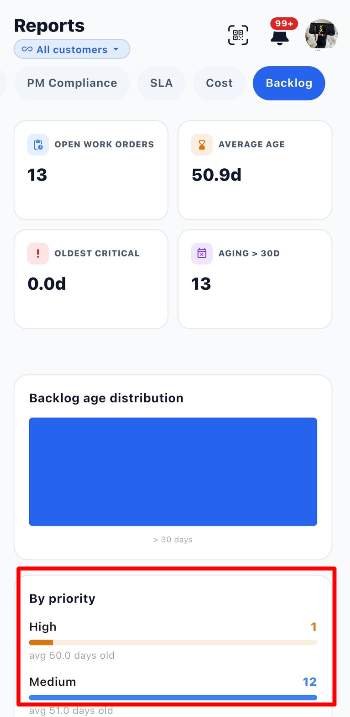
The By priority section groups open work orders according to their priority. It displays the number of work orders at each priority level and the average age of those work orders.
| Information | Description |
|---|---|
| Priority | Identifies the priority level of the work orders, such as High or Medium. |
| Count | Displays the number of open work orders in that priority group. |
| Progress bar | Provides a visual representation of the number of work orders in the group. |
| Average age | Displays the average age of work orders within that priority group. |
Example from the screenshot:
| Priority | Number of Work Orders | Average Age |
|---|---|---|
| High | 1 | 50.0 days |
| Medium | 12 | 51.0 days |
The example shows that most open work orders are Medium priority, while one is High priority.
13.4 Steps to Review the Backlog Report
- Open the Reports module.
- Select the required customer or keep All customers selected.
- Click the Backlog tab.
- Review the number of Open Work Orders.
- Check the Average Age to understand how long work orders have remained open.
- Review Oldest Critical to monitor critical maintenance work.
- Check Aging > 30d to identify older work orders.
- Review the Backlog age distribution chart.
- Scroll to By priority.
- Compare the number of work orders and average age for each priority.
- Use the information to identify work orders that may need follow-up or prioritization.
13.5 Important Notes
- The Backlog report focuses on open work orders.
- Aging > 30d highlights work orders that have remained open for more than 30 days.
- The By priority section helps users compare backlog levels across priorities.
- The values shown in the screenshot are examples and may change according to the selected customer and available work order data.
14. End-to-End Reports Workflow
Open the Reports Module
        ↓
Select a Customer or Keep All Customers Selected
        ↓
Choose a Reporting Period (3mo, 6mo, or 12mo)
        ↓
Select the Required Report Tab
        ↓
Review Work Volume, MTTR / MTBF, PM Compliance, SLA, Cost, or Backlog
        ↓
Check Summary Metrics and Charts
        ↓
Review Detailed Breakdowns, Such as Work Type, Priority, Sites, Assets, or Categories
        ↓
Compare Results for the Selected Period
        ↓
Change the Customer, Period, or Report Tab as Needed
        ↓
Use the Report Information to Support Maintenance Planning and Follow-up