

Overview
Overview of the Optimo platform and its dashboard features.
Bacsys Optimo – Overview
The Overview page is the main dashboard of the Bacsys Optimo mobile application. It provides a summary of work orders, task-related activities, asset health, SLA compliance, overdue items, and recent updates.
Users can select a customer, search for records, scan QR codes, check notifications, monitor maintenance performance, and navigate to other modules from the Overview page.
1. Overview Page
The Overview page contains the following sections:
| Section / Option | Description |
|---|---|
| All customers | Allows users to select the customer whose information they want to view. |
| Search | Opens the search function to find relevant records in the application. |
| Scan QR code | Allows users to scan a QR code to navigate to an associated asset, work order, or location. |
| Notifications | Displays notifications and alerts related to application activities. |
| Profile | Provides access to the user's profile or account options. |
| Summary Cards | Display key information such as active work orders, overdue items, critical items, and average delay. |
| SLA Compliance | Displays the percentage of items completed on time and the number of items that have breached the SLA. |
| Today | Displays items due today or indicates when nothing is due. |
| Work Order Activity | Displays work order creation and completion statistics over a selected period. |
| Asset Health | Displays the distribution of assets by health or criticality status. |
| Activity | Displays recent work order updates and other activities. |
| Bottom Navigation | Provides quick access to Overview, Orders, Tasks, Assets, Messages, and More. |
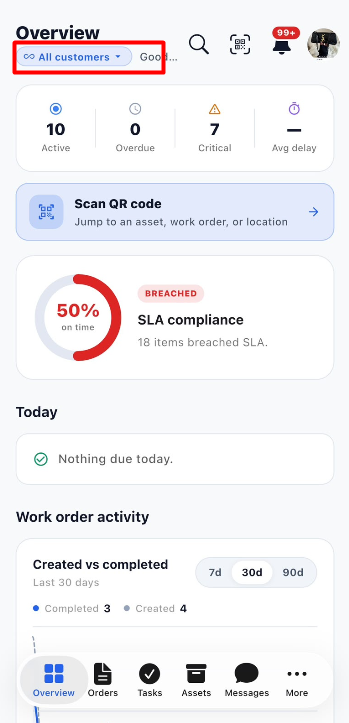
2. Select Customer – All Customers
The All customers option allows users to select the customer whose dashboard information they want to view.
Steps
- Open the Bacsys Optimo mobile application.
- Navigate to the Overview page.
- Click All customers at the top of the screen.
- Select the required customer from the available options.
- The selected customer becomes the active filter for the dashboard.
- Review the available dashboard information for the selected customer.
All Customers Options
| Option | Description |
|---|---|
| All customers | Displays information across all customers available to the user. |
| Select a customer | Filters the dashboard according to the selected customer. |
Note: The customers and information available depend on the user's access permissions.
3. Search
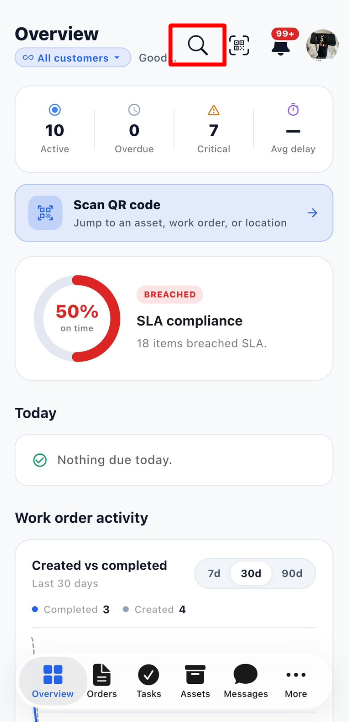
The Search icon allows users to search for relevant records in the application.
Steps
- Open the Overview page.
- Click the Search icon at the top of the screen.
- Enter the name or identifier of the record you want to find.
- Review the available search results.
- Select the required record to view its details, if available.
Search Options
| Option | Description |
|---|---|
| Search icon | Opens the search interface. |
| Search input | Allows users to enter the information they want to find. |
| Search results | Displays matching records available to the user. |
4. Scan QR Code
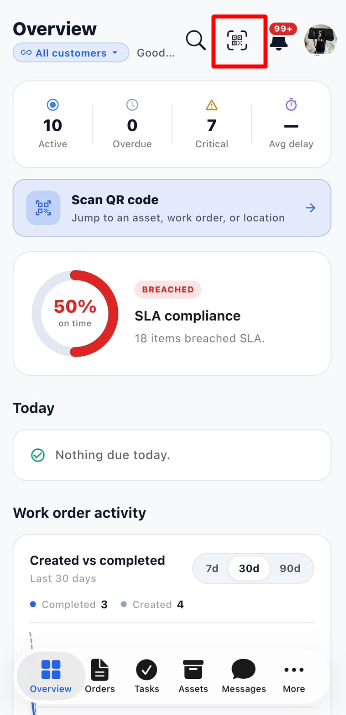
The Scan QR code option allows users to scan a QR code and navigate directly to an associated asset, work order, or location.
The Overview page also displays a Scan QR code shortcut card with the description Jump to an asset, work order, or location.
Steps
- Open the Overview page.
- Click the Scan QR code card or the scanner icon at the top of the screen.
- Allow camera access if the application requests permission.
- Point the device camera at the required QR code.
- Wait for the application to scan and identify the code.
- The application navigates to the associated asset, work order, or location when the QR code is recognized.
Scanner Options
| Option | Description |
|---|---|
| Scanner icon | Opens the QR code scanning interface. |
| Scan QR code | Starts the scanning process. |
| Associated record | Opens the record linked to the scanned QR code. |
5. Notifications
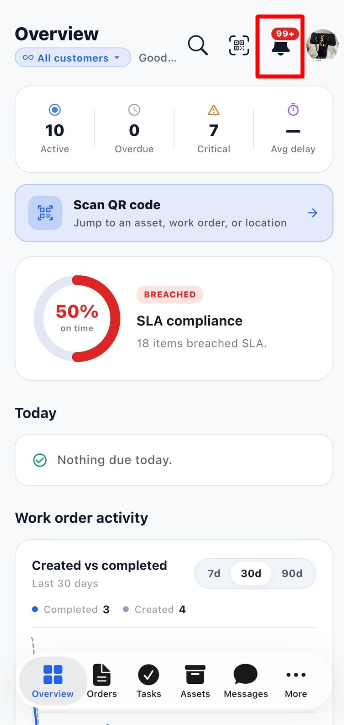
The Notifications icon displays alerts and updates related to the application.
A notification badge appears on the bell icon when notifications are available. In the provided screenshot, the badge displays 99+.
Steps
- Open the Overview page.
- Click the Notifications bell icon at the top of the screen.
- Review the available notifications.
- Select a notification when you need to view its related information, if supported.
Notification Options
| Option | Description |
|---|---|
| Bell icon | Opens the notification area. |
| Notification badge | Indicates the presence of notifications. The screenshot displays 99+. |
| Notification list | Displays the available alerts and updates. |
| Notification item | Allows users to review a specific notification and access related information, where available. |
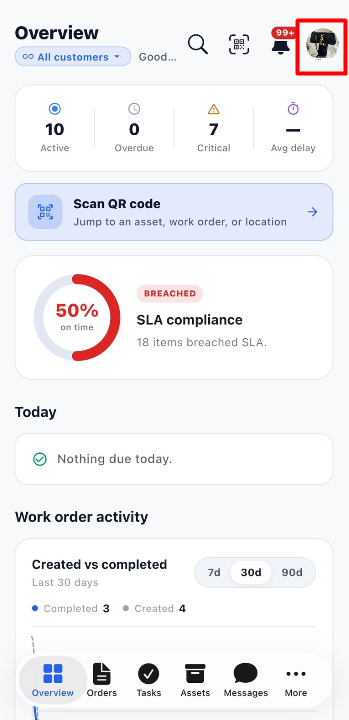
6. Profile
The profile icon is displayed in the upper-right corner of the Overview page.
Steps
- Open the Overview page.
- Click the Profile icon.
- Review the available profile or account options.
- Select the required option.
The provided Overview screenshot shows the profile icon, but it does not display the options available after opening it.
7. Summary Cards
The Summary Cards section displays important work order and maintenance indicators.
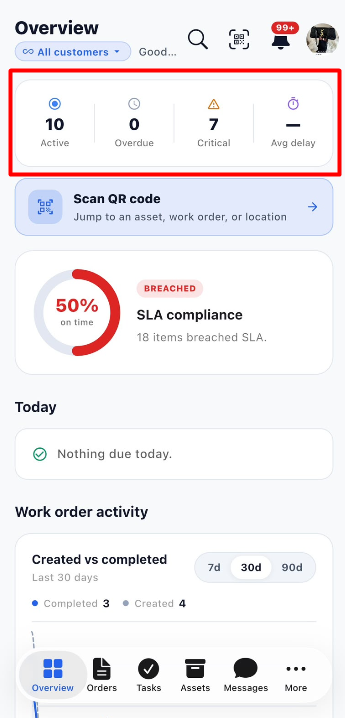
The provided screenshot shows the following values.
| Summary Card | Displayed Value | Description |
|---|---|---|
| Active | 10 | Displays the number of active items shown by the dashboard. |
| Overdue | 0 | Displays the number of overdue items. |
| Critical | 7 | Displays the number of items classified as critical. |
| Avg delay | — | Displays the average delay when a value is available. The screenshot shows a dash. |
Steps to Review Summary Cards
- Open the Overview page.
- Locate the Summary Cards section below the header.
- Review the Active count.
- Check the Overdue count for items that have passed their due dates.
- Review the Critical count to identify items requiring attention.
- Check Avg delay to review the displayed delay information, when available.
Note: The values shown above are examples taken from the provided screenshot. They may change as application data changes.
8. Scan QR Code Shortcut Card
The Overview page provides a separate Scan QR code shortcut card below the Summary Cards.
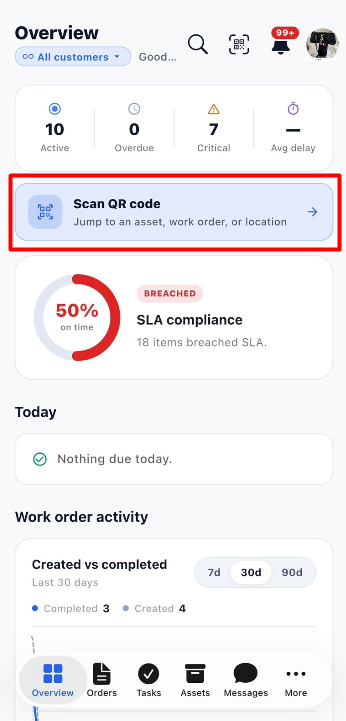
| Field / Option | Description |
|---|---|
| Scan QR code | Opens the QR scanning function. |
| Jump to an asset, work order, or location | Explains the purpose of the shortcut. |
| Arrow icon (→) | Indicates that the card can be opened. |
Steps
- Locate the Scan QR code card.
- Click the card.
- Scan the QR code associated with the required record.
- Open the identified record when the application recognizes it.
9. SLA Compliance
The SLA Compliance section displays how many items meet the required service-level agreement (SLA) timing and how many have breached the SLA.
The screenshot shows 50% on time and 18 items breached SLA.
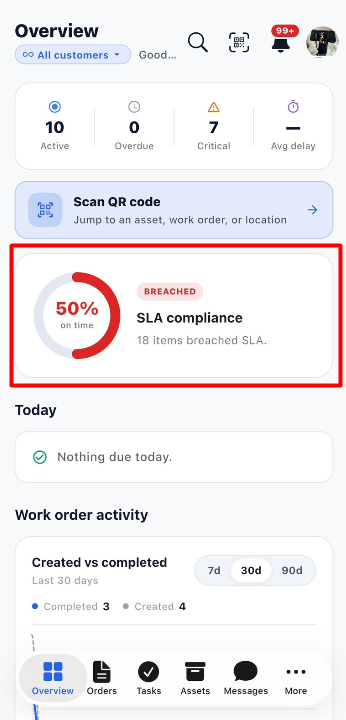
| Field / Indicator | Displayed Value | Description |
|---|---|---|
| On-time percentage | 50% | Displays the percentage of items completed within the required SLA time. |
| SLA Status | Breached | Indicates that SLA targets have been breached for some items. |
| Items breached SLA | 18 | Displays the number of items that have breached the SLA. |
| Circular progress indicator | 50% | Visually represents the on-time percentage. |
Steps to Review SLA Compliance
- Open the Overview page.
- Locate the SLA Compliance card.
- Review the on-time percentage.
- Check the SLA status.
- Review the number of items that have breached the SLA.
- Use the available application navigation to investigate related work items, if required.
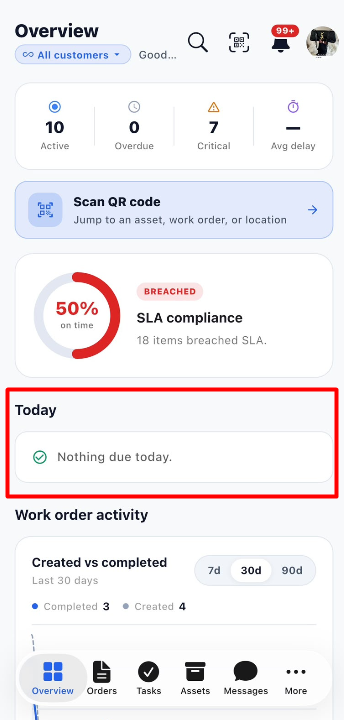
10. Today
The Today section displays information about items due on the current day.
In the provided screenshot, the section displays Nothing due today.
Steps
- Open the Overview page.
- Scroll to the Today section.
- Review the displayed information.
- If items are due, review the available details.
- If the application displays Nothing due today, there are no items reported as due today in that view.
Today Section Options
| Display | Description |
|---|---|
| Today | Identifies the section for current-day items. |
| Nothing due today | Indicates that no items are displayed as due today. |
| Due items | Displays items due today when available. |
11. Work Order Activity
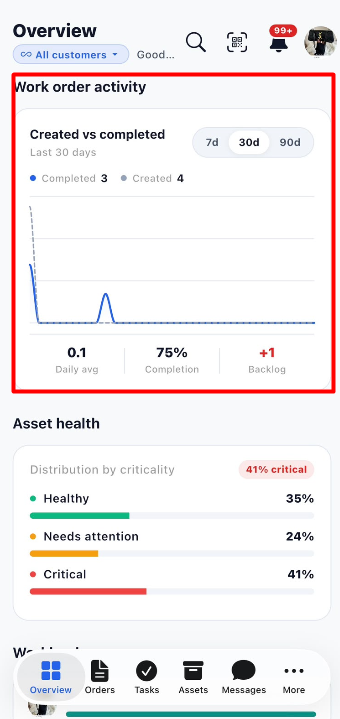
The Work order activity section provides an overview of work orders created and completed during a selected period.
The section includes a Created vs completed chart, date-range filters, activity counts, and performance indicators.
11.1 Created vs Completed
The chart compares the number of work orders created with the number completed during the selected period.
| Field / Option | Description |
|---|---|
| Created vs completed | Displays a comparison between created and completed work orders. |
| 7d | Displays activity for the last 7 days. |
| 30d | Displays activity for the last 30 days. |
| 90d | Displays activity for the last 90 days. |
| Completed | Displays the completed work order count for the selected period. |
| Created | Displays the created work order count for the selected period. |
| Activity chart | Visually displays the work order activity over time. |
Steps to Review Work Order Activity
- Open the Overview page.
- Scroll to Work order activity.
- Review the Created vs completed chart.
- Select 7d to view activity over the last 7 days.
- Select 30d to view activity over the last 30 days.
- Select 90d to view activity over the last 90 days.
- Compare the created and completed counts for the selected period.
- Review the performance indicators below the chart.
11.2 Work Order Performance Indicators
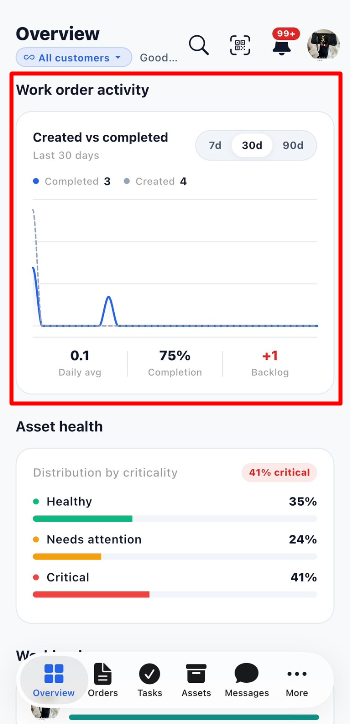
The screenshot displays the following values for the selected 30-day period.
| Indicator | Displayed Value | Description |
|---|---|---|
| Daily avg | 0.1 | Displays the average daily work order activity metric shown by the dashboard. |
| Completion | 75% | Displays the completion percentage shown by the dashboard. |
| Backlog | +1 | Displays the backlog indicator. The positive value indicates an increase in the displayed backlog metric. |
Note: The displayed values are examples from the screenshot. The exact values depend on the selected period and the application's current data.
12. Asset Health
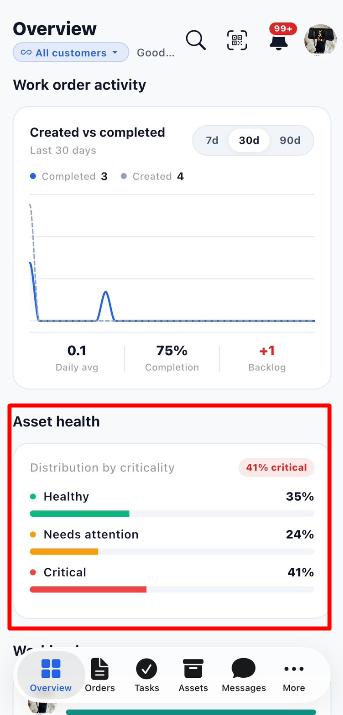
The Asset health section displays the distribution of assets according to their health or criticality classification.
The screenshot displays three categories: Healthy, Needs attention, and Critical.
Asset Health Distribution
| Category | Displayed Percentage | Description |
|---|---|---|
| Healthy | 35% | Displays the proportion of assets classified as healthy. |
| Needs attention | 24% | Displays the proportion of assets that require attention. |
| Critical | 41% | Displays the proportion of assets classified as critical. |
The screenshot also displays 41% critical as a summary indicator.
Steps to Review Asset Health
- Open the Overview page.
- Scroll to the Asset health section.
- Review the overall criticality indicator.
- Check the percentage of Healthy assets.
- Check the percentage of assets that Need attention.
- Review the percentage of Critical assets.
- Use the Assets module to locate and review individual assets when further investigation is required.
13. Activity
The Activity section displays recent events and updates related to work orders.
The screenshot shows an activity count of 6 updates and entries describing work orders that were completed or created.
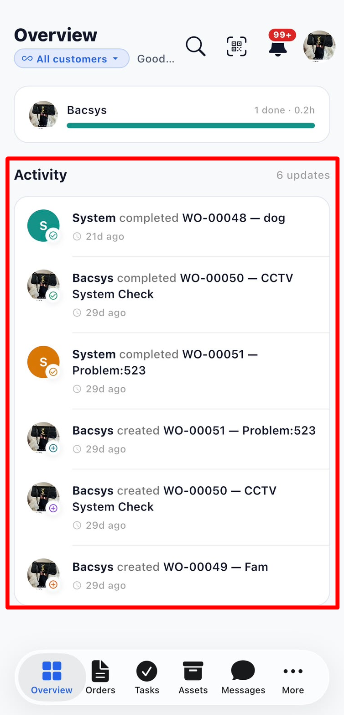
Activity Details
| Field / Information | Description |
|---|---|
| Activity | Identifies the section containing recent application events. |
| Update count | Displays the number of activity entries shown. The screenshot displays 6 updates. |
| User or system name | Identifies the user or system associated with the activity. |
| Activity action | Indicates whether a work order was created or completed. |
| Work order number | Displays the identifier of the related work order. |
| Work order title | Displays the title or description associated with the work order. |
| Timestamp | Displays when the activity occurred. |
Steps to Review Activity
- Open the Overview page.
- Scroll to the Activity section.
- Review the total number of updates displayed.
- Check the user or system associated with each entry.
- Review the work order number and title.
- Check the timestamp to understand when the activity occurred.
- Open the related work order from the appropriate module when further details are needed.
14. Overall Overview Page Workflow
Open Bacsys Optimo
        ↓
Open Overview
        ↓
Select All Customers (If Required)
        ↓
Review Dashboard Summary Cards
        ↓
        ├── Search Records
        │       ↓
        │   Enter Search Details
        │       ↓
        │   Review Search Results
        │
        ├── Scan QR Code
        │       ↓
        │   Scan Asset / Work Order / Location
        │       ↓
        │   Open Associated Record
        │
        ├── Check Notifications
        │       ↓
        │   Open Notification Bell
        │       ↓
        │   Review Available Alerts
        │
        ├── Review SLA Compliance
        │       ↓
        │   Check On-time Percentage
        │       ↓
        │   Review SLA Breaches
        │
        ├── Review Today
        │       ↓
        │   Check Items Due Today
        │
        ├── Review Work Order Activity
        │       ↓
        │   Select 7d / 30d / 90d
        │       ↓
        │   Compare Created vs Completed
        │       ↓
        │   Review Performance Indicators
        │
        ├── Review Asset Health
        │       ↓
        │   Check Healthy Assets
        │       ↓
        │   Check Assets Needing Attention
        │       ↓
        │   Check Critical Assets
        │
        └── Review Recent Activity
                ↓
            Check Work Order Updates
                ↓
            Open Related Records if Required
        ↓
Navigate to Orders / Tasks / Assets / Messages / More
15. Summary
The Overview page gives users a centralized view of maintenance activity in Bacsys Optimo. Users can filter the dashboard by customer, search for records, scan QR codes, check notifications, monitor SLA compliance, review work order performance, assess asset health, and track recent activities. The bottom navigation provides direct access to the main application modules.