

Home
The Home Module provides an overview of a site's Apex Edge Controller, including key statistics and performance metrics. It also displays the number of Apex Edge Devices connected to a particular site.
Home Page
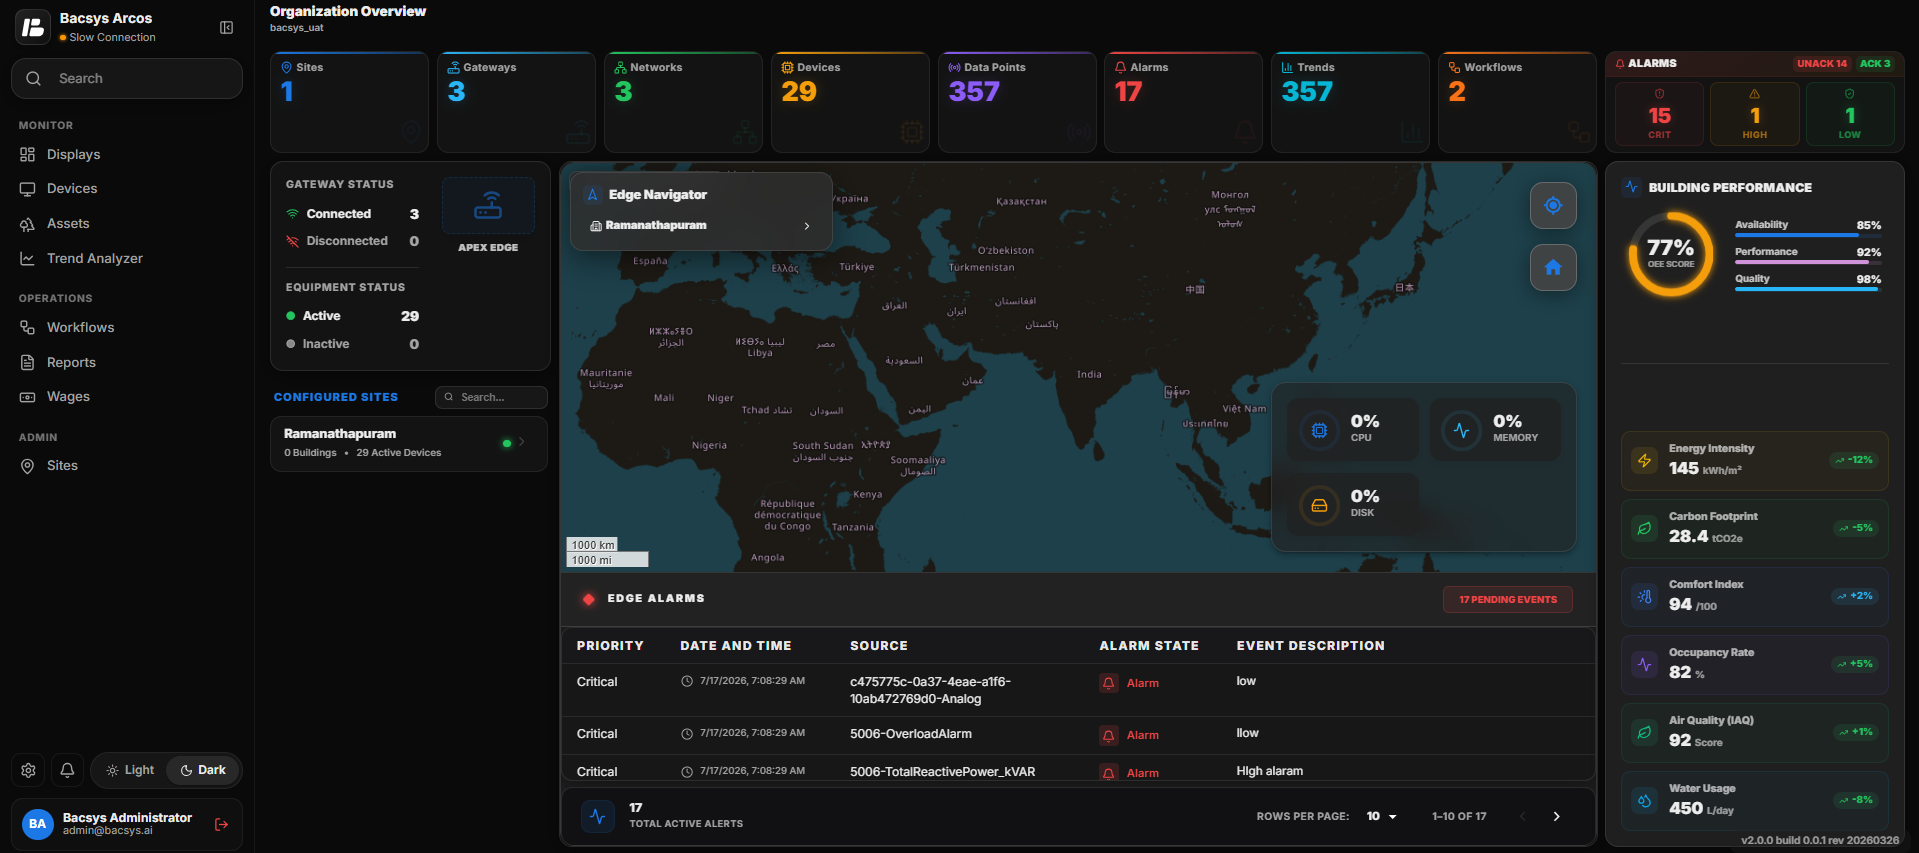 Home Screen
Site Statistics
The Site Statistics section provides key metrics related to the site's Apex Edge Controllers and their connectivity within the Bacsys Platform.
| Statistic | Description |
|---|---|
| Sites | All the sites added to the system are visible on the website based on user access permissions. |
| Gateways | Number of Apex Edge Controllers connected to the site. |
| Networks | Number of networks connected to the Bacsys Platform. |
| Devices | Number of devices connected to the Bacsys Platform. |
| Data Points | Number of data points available within the Bacsys Platform. |
| Total Alarms | Number of alarms generated within the Bacsys Platform. |
| Trends | Number of trends configured within the Bacsys Platform. |
| Workflows | Number of workflows created within the Bacsys Platform. |
| Unacknowledged | Number of Unacknowledged alarms in the Bacsys Platform. |
| Acknowledged | Number of Acknowledged alarms in the Bacsys Platform. |
| Critical | Number of Critical alarms in the Bacsys Platform. |
| High | Number of High alarms in the Bacsys Platform. |
| Low | Number of Low alarms in the Bacsys Platform. |
| View Alarms | A clickable option that redirects users to the Alarm Module of the Bacsys Platform. |
Apex Edge Controllers
The Apex Performance Index displays a list of Apex Edge Controllers connected to the Platform, along with their key performance metrics.
| Metric | Description |
|---|---|
| CPU Utilization | Displays the CPU usage of the selected Apex Edge Controller in percentage, along with the operating system name. |
| Memory Usage | Displays the memory usage in percentage, along with the number of running processes. |
| Disk Usage | Displays the disk usage in percentage, along with the CPU architecture. |
Gateway & Equipment Status
layout Home Screen Gate way
| Section | Status | Description |
|---|---|---|
| Gateway Status | Connected | Displays the list of all Apex Edge devices that are currently connected to the system. |
| Gateway Status | Disconnected | Displays the total number of Apex Edge devices that are currently disconnected from the system. |
| Equipment Status | Active | Displays the list of Apex Edge devices that are currently active and functioning properly. |
| Equipment Status | Inactive | Displays the list of Apex Edge devices that are currently inactive or not operational. |
Configuring Sites
layout Home Screen ConfiguredSites Displays the list of all sites that have been successfully configured in the system.
Building Performance
layout Home Screen BuildingPerformance
| Metric | Description |
|---|---|
| Availability | Displays the overall system availability percentage, indicating the uptime and operational reliability of the building systems. |
| Performance | Displays the overall performance percentage, reflecting how efficiently the building systems are operating. |
| Quality | Displays the quality performance percentage, indicating the standard and consistency of system operations. |
| Energy Intensity | Measures the amount of energy consumed per unit area (e.g., kWh per square meter), indicating overall energy efficiency. |
| Carbon Footprint | Represents the total greenhouse gas emissions generated by building operations, typically measured in CO₂ equivalent. |
| Comfort Index | Indicates the overall comfort level within the building based on temperature, humidity, and environmental conditions. |
| Occupancy Rate | Displays the percentage of occupied spaces within the building compared to total available capacity. |
| Indoor Air Quality (IAQ) | Measures air quality parameters such as CO₂ levels, humidity, and pollutants to ensure a healthy indoor environment. |
| Water Usage | Displays the total water consumption within the building over a specific period. |