

Reports
The Report Module allows you to generate customized reports based on your preferences. You can design your own report format by configuring key parameters such as data points, report type, start date, end date etc.
Additionally, the module offers multiple visualization options, including table view for structured data representation and chart view for graphical insights.
The Report Module consist of two main sections:
- Report Designer
- Report Navigator
Accessing the Report Module
- Click on the Report icon on the main menu.
- Click on (>) button to Expand or (<) button to collapse the browser menu.
- The browser menu lists all the configured reports/report templates.
Report Designer
Used exclusively for creating report templates. In this section, users can define the structure and format for a report template. These templates can be reused to generate reports with different data inputs.
Creating a New Report Template
By default, when you access the Report Designer section, a new report template is displayed, which you can edit based on your preferences. Alternatively, you can create a new report template by clicking the "+" button next to the Report Designer switch.
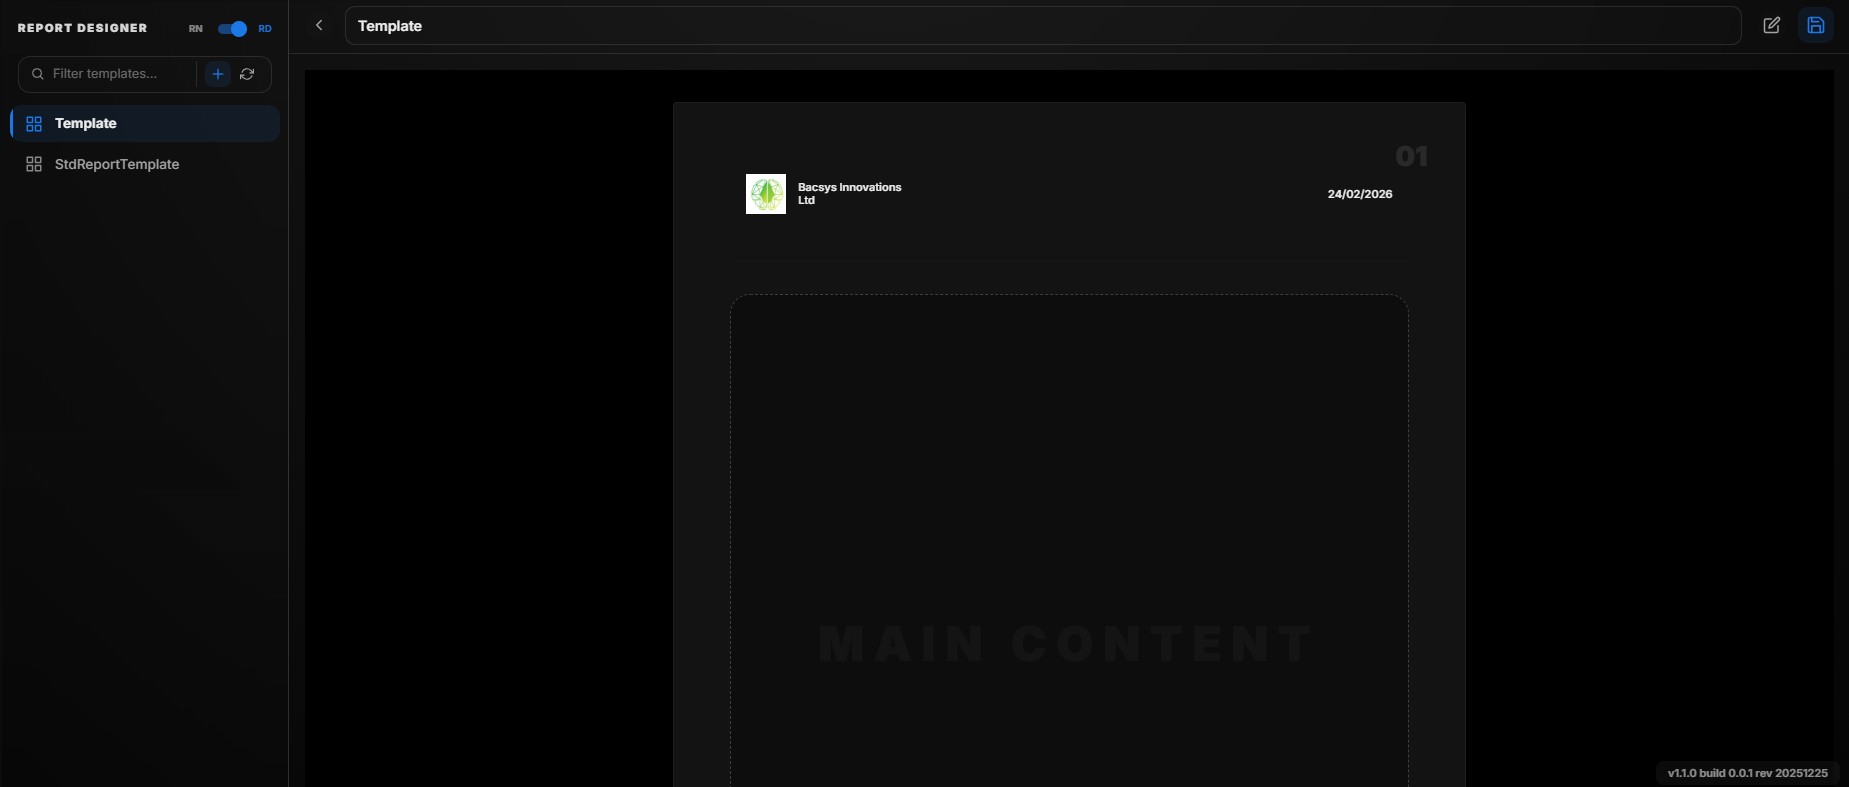 WorkFlow New
Customizing a New Report Template
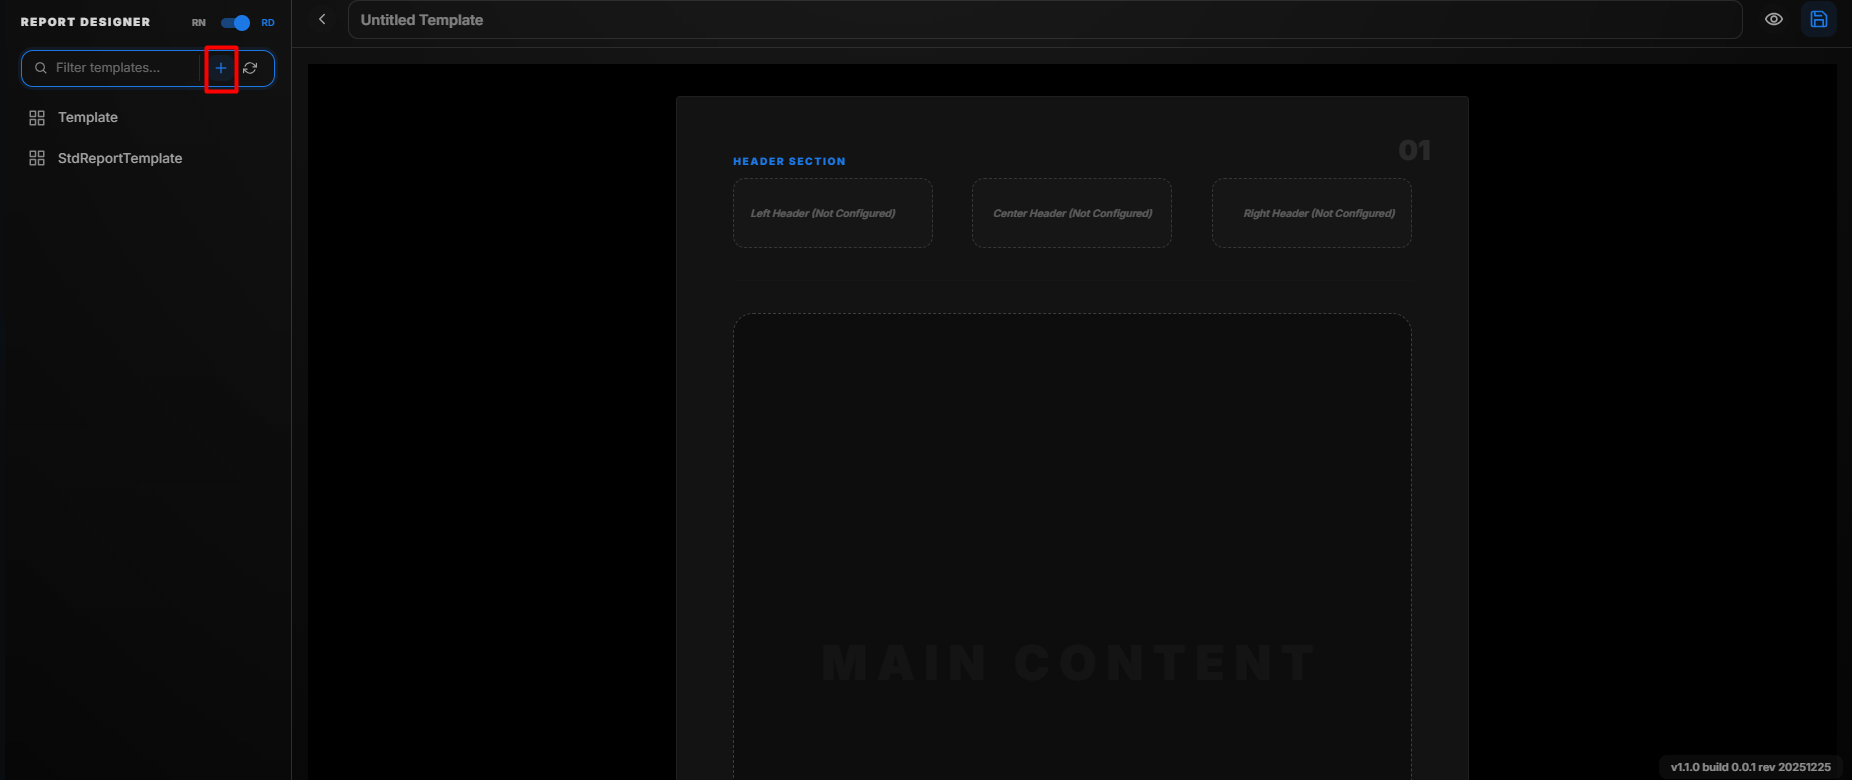 WorkFlow New
-
Edit the New Report Template Section
- Click on the "Edit" button to begin customization.
-
Name the Report Template
- Locate the "Untitled Report Template" field and enter a name for your report template.
-
Customize the Report Structure
- The template consists of:
- Three sections in Header (configurable)
- One Report body (non-configurable)
- Three sections in Footer (configurable)
- The template consists of:
-
Modify Header and Footer Sections
- Each header and footer section has a settings icon.
- Click on the settings icon to open a pop-up with customization options.
-
Configure Section Settings in the Pop-up
- The customization pop-up appears with the section name displayed at the top.
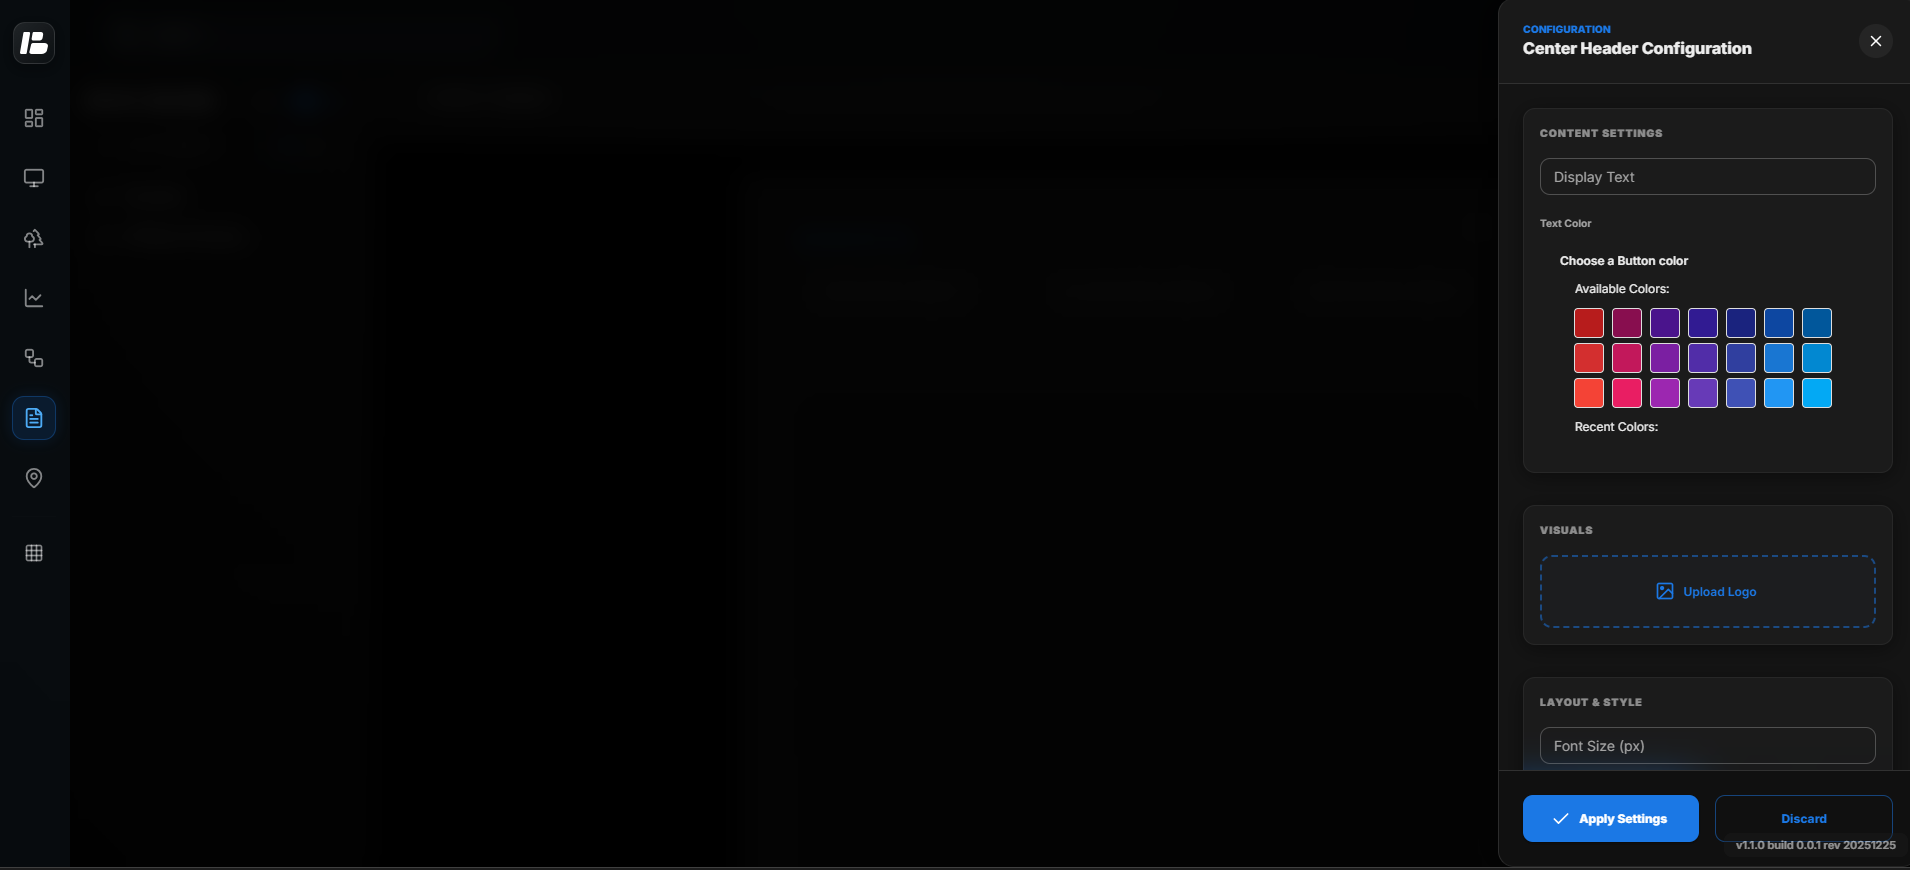 Report Designer Section - Left Header Configuration
- Below are the available customization options:
| Option | Description |
|---|---|
| Content Settings | Configure the main content settings for the selected display or widget. |
| Text Colours | Customize the text color for labels, values, or headings. |
| Visuals | Allows adding images or logos only. |
| Layout Styles | Select and configure the layout style of the display. |
| Alignment | Adjust the alignment of content (left, center, right). |
| Date Format | Choose the preferred date format for displaying date and time. |
| Apply Settings | Click to apply and save the configured settings. |
| Discard Changes | Click to discard all unsaved changes and revert to the previous settings. |
- Preview the Report Template
- Click on the "Preview" button to switch from edit mode to preview mode and see how the report template will look.
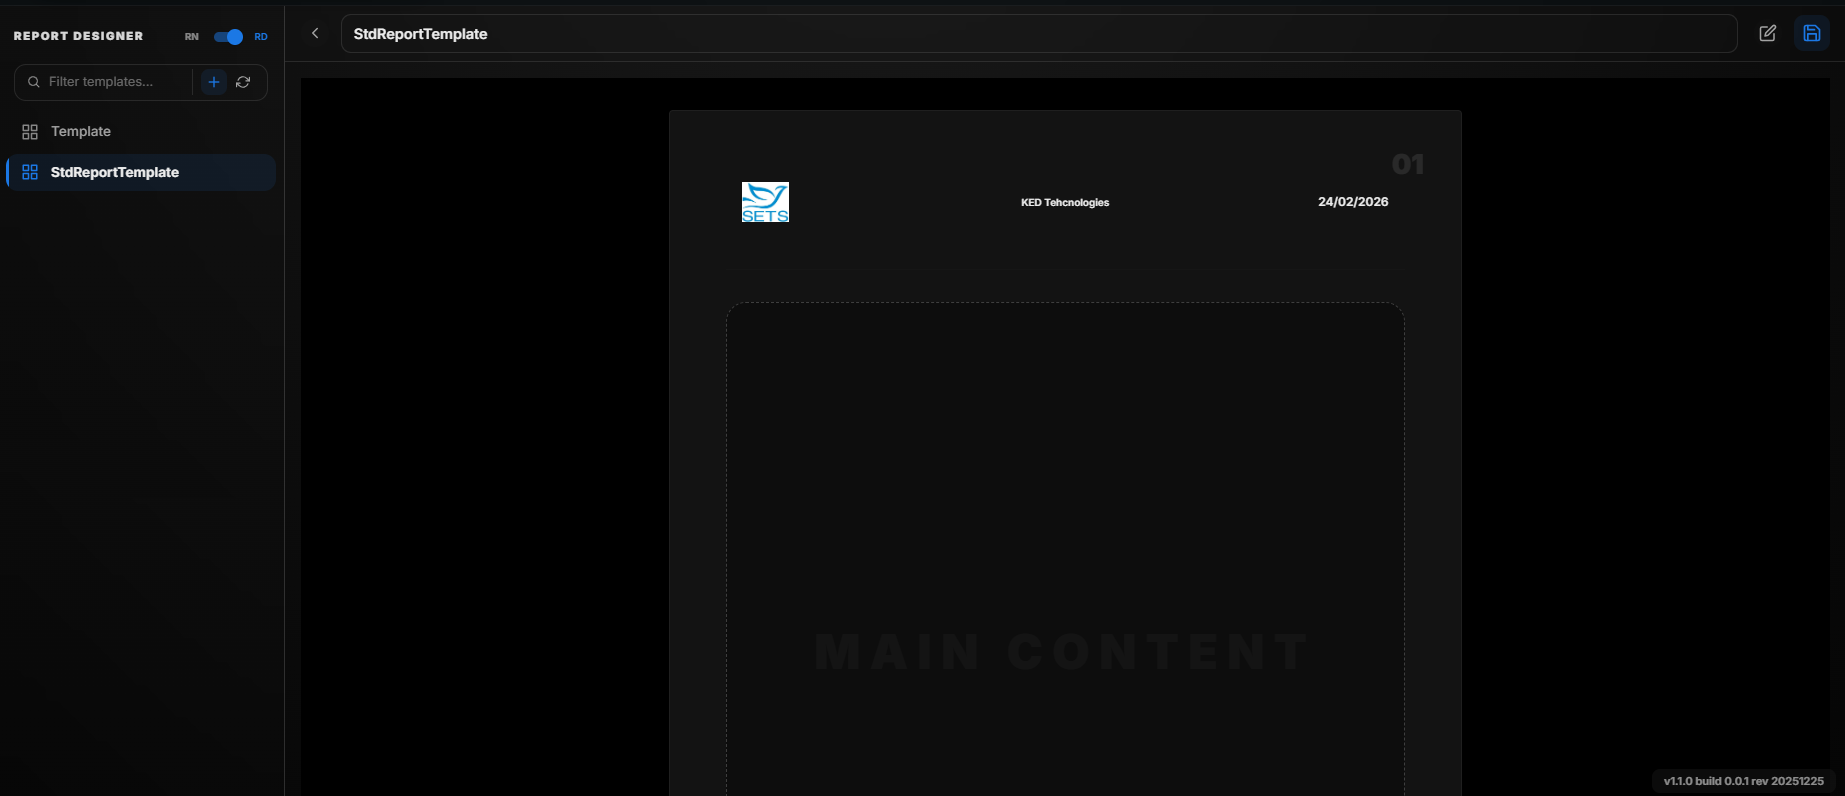 ReportPreview
- Save Template
- Click the "Save" button to save the created Report Template.
Modifying the Created Report Template
To modify an existing report template, follow these steps:
-
Open the Report Template
- In the Report Designer Browser, click on the respective report template you want to modify.
- The selected report template will be displayed.
-
Rename the Report Template
- Click on the name of the report template and enter a new name to rename it.
-
Edit the Report Template
- Click on the "Edit" button to enter edit mode.
- Make the necessary changes in the header or footer sections.
-
Preview the Report Template
- Once the modifications are complete, click on the "Preview" button to switch to preview mode and review the changes.
-
Save Changes
- Click on the "Save" button to save the modifications.
Deleting a Report Template
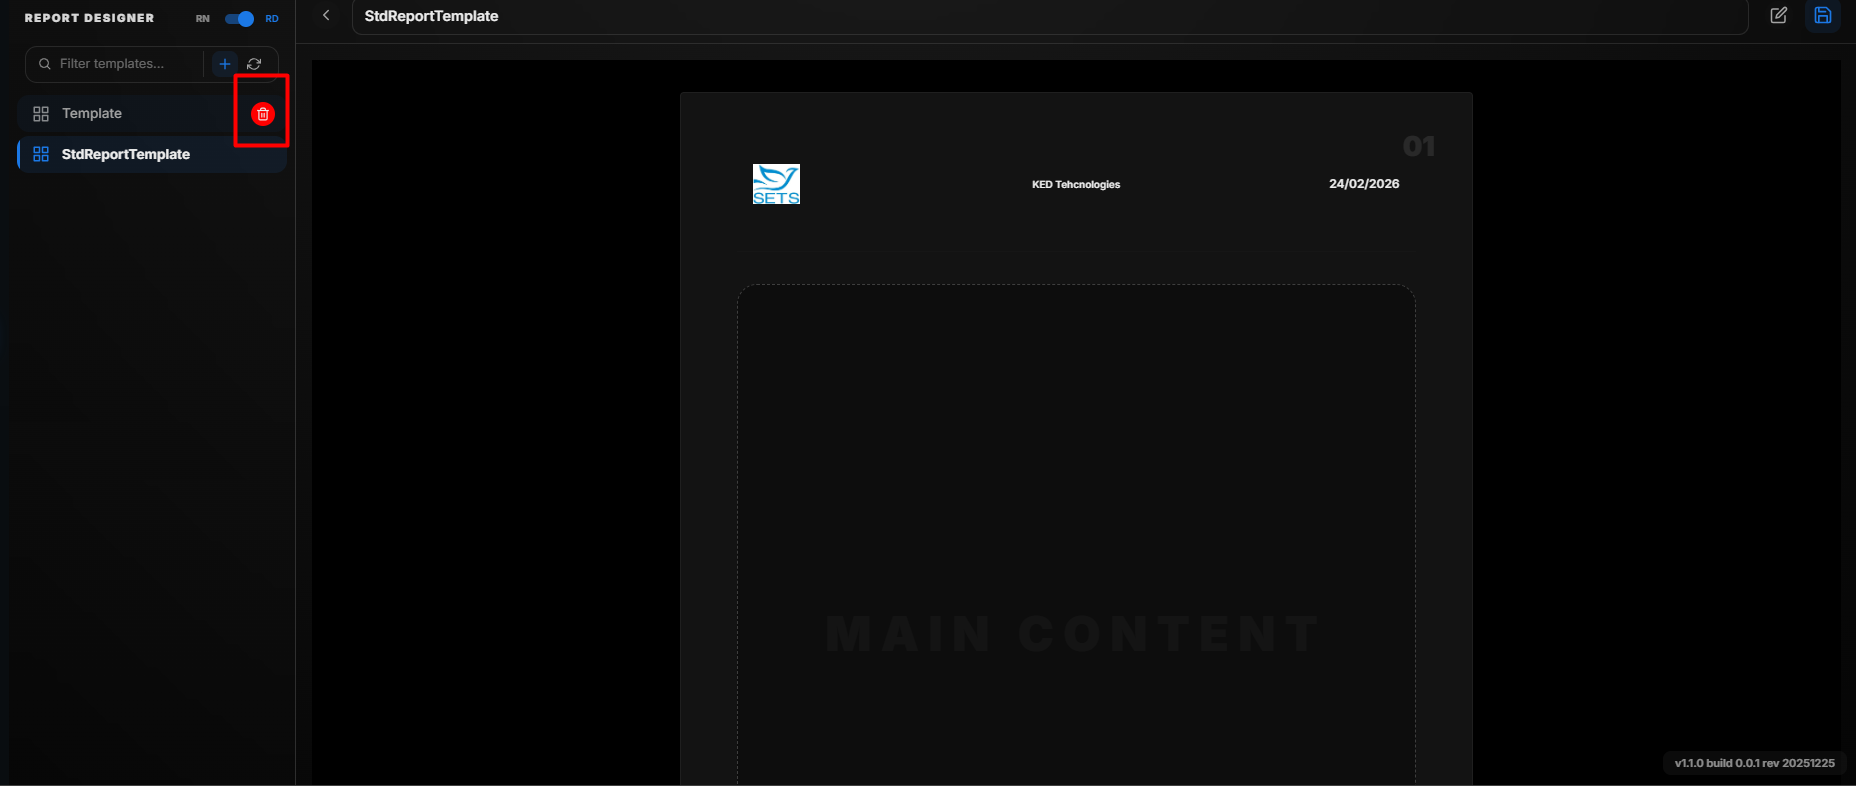 Report Delete
To delete an existing report template, follow these steps:
-
Locate the Report Template
- Open the Report Designer Browser pane.
-
Initiate Deletion
- Click on the "Delete" button next to the respective report template.
- A confirmation pop-up will appear.
-
Confirm or Cancel Deletion
- Click on the "Confirm" button to permanently delete the report template.
- Click on the "Cancel" button to cancel the deletion and retain the template.
Report Navigator
The Report Navigator allows users to configure and generate reports based on their requirements. It provides options to select the data points, choose the report type, and apply a predefined report template. Users can also set the start and end dates for the report to ensure relevant data is included. Once configured, reports can be viewed in different formats, such as table or chart views, for easy analysis and interpretation.
Creating a New Report
-
Access the Report Navigator
- Open the Report Navigator section.
- A new report is displayed by default, or you can create a new one by clicking the "+" button next to the Report Navigator switch.
-
Name the Report
- Locate the "Untitled Report" field.
- Enter a name for your report.
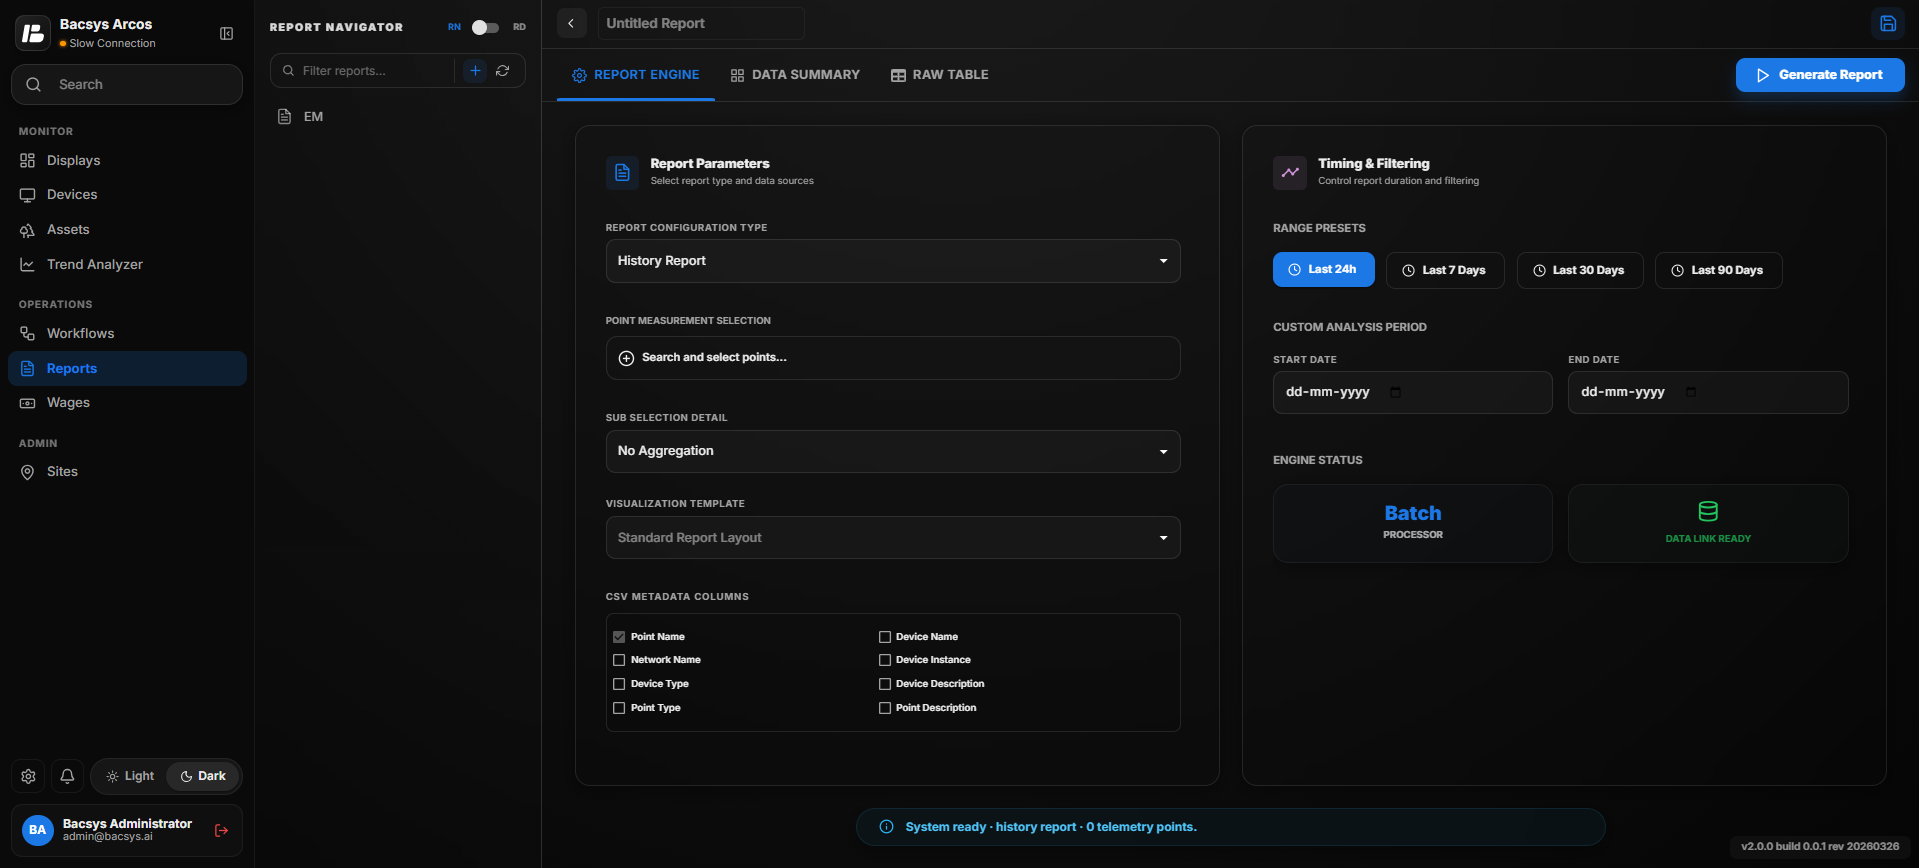 Report Navigator
- Finalize Report Creation
- Once the name is entered, the new report is created with the given name.
Report Engine
Report Configuration
In the Report Engine, users can configure different types of reports under Report Configuration Type.
Report Configuration Type (Dropdown)
| Report Type | Description |
|---|---|
| History Report | Generates reports based on historical trend data within a selected time range. |
| Events Report | Generates reports based on recorded system events and alarms. |
| Instantaneous Report | Generates reports using real-time data values. |
| Matrix Report | Generates structured reports in matrix format for comparative analysis. |
| Consumption Report | Generates reports based on energy or resource consumption data. |
History ReportConfiguration
The History Report displays historical trend data for selected points within a specified time range. It enables users to analyze recorded data using tabular and graphical views and export reports in multiple formats.
History Report Configuration
Creating a History Report
- Open the Report Navigator.
- Click the + icon to create a new report.
- Enter a report name as desired.
- From the Report Configuration Type dropdown, select History Report.
Point Measurement Selection
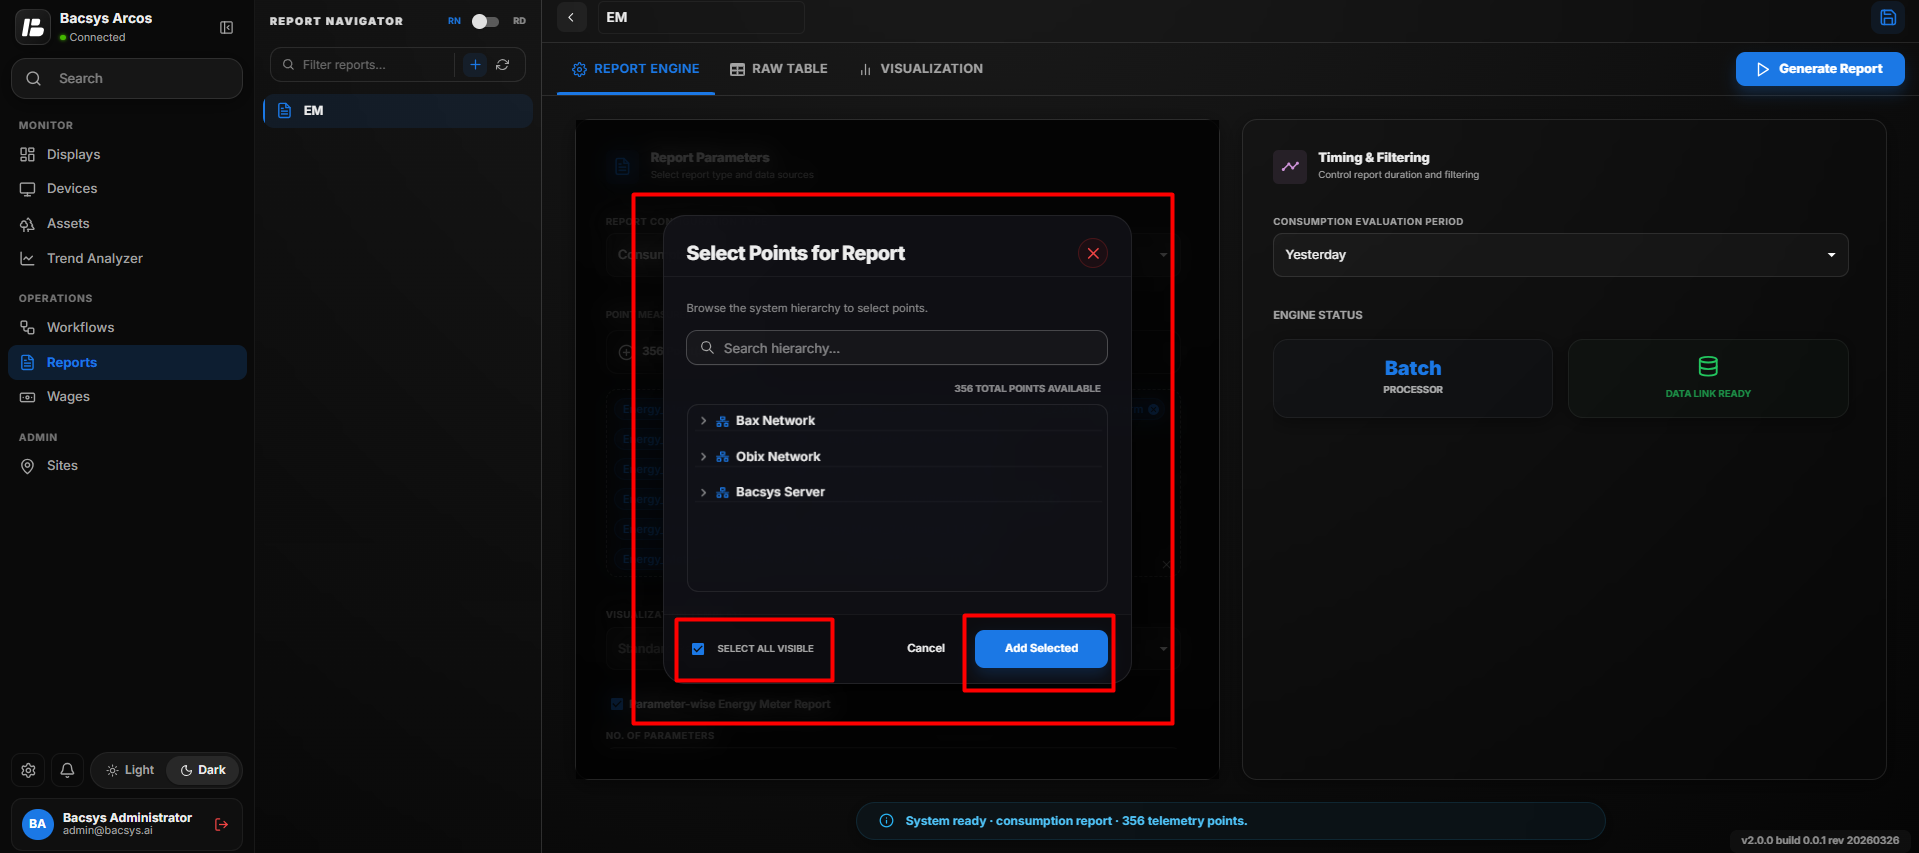
The Point Measurement Selection section allows users to choose the data points that will be included in the report.
Steps
- Click the + icon in the Point Measurement Selection section.
- A Point Selection dialog box appears.
- Browse and select the required device or expand the device tree to view the available points.
- Select one or more points by checking the corresponding checkboxes.
- To include all available points, use the Select All option.
- Click Add Selected to add the chosen points to the report configuration.
Note
- Only points with Trend enabled can be added to a History Report.
- Multiple devices and points can be selected simultaneously.
- The selected points are displayed in the Point Measurement Selection list and will be included when the report is generated.
Sub Selection Detail
The Sub Selection Detail section allows users to configure data aggregation.
Available aggregation options include:
- No Aggregation
- 15 Minutes
- 30 Minutes
- 1 Hour
- 8 Hours
- 1 Day
- 1 Week
- 1 Month
Select the aggregation period according to your reporting requirements.
CSV Metadata Columns
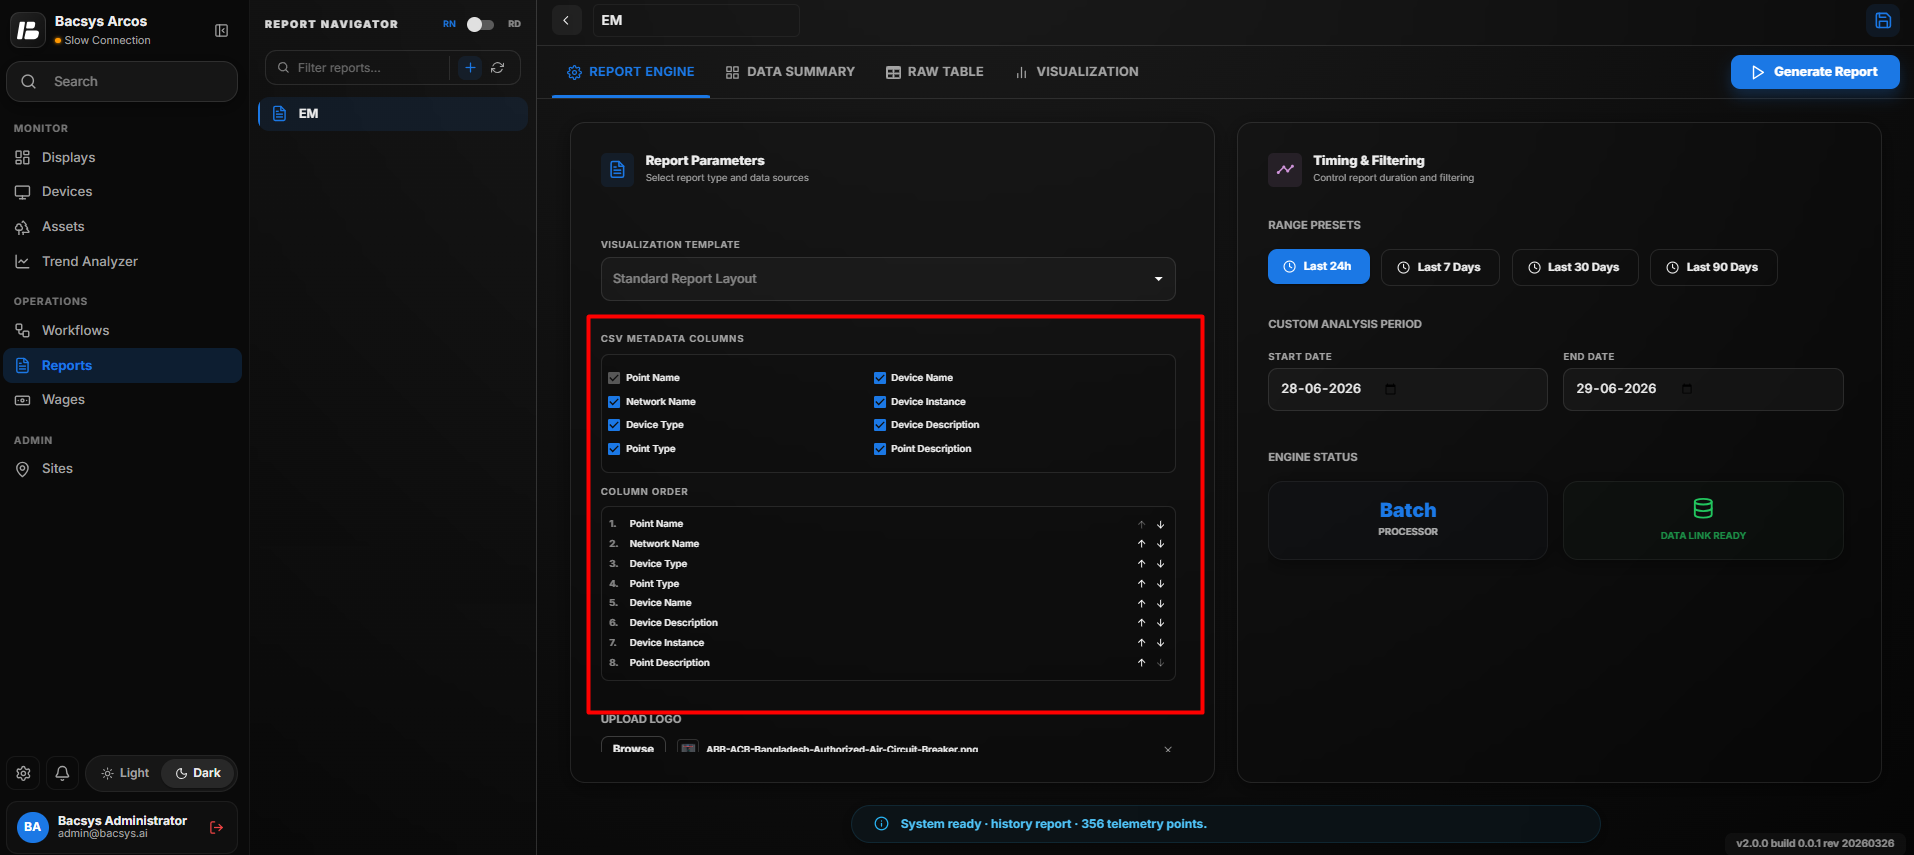
The CSV Metadata Columns section allows users to choose which information should be included in the exported report.
- Select the required checkboxes.
- Move the selected columns into the preferred display order.
- The exported report will include only the selected metadata fields.
Report Logo
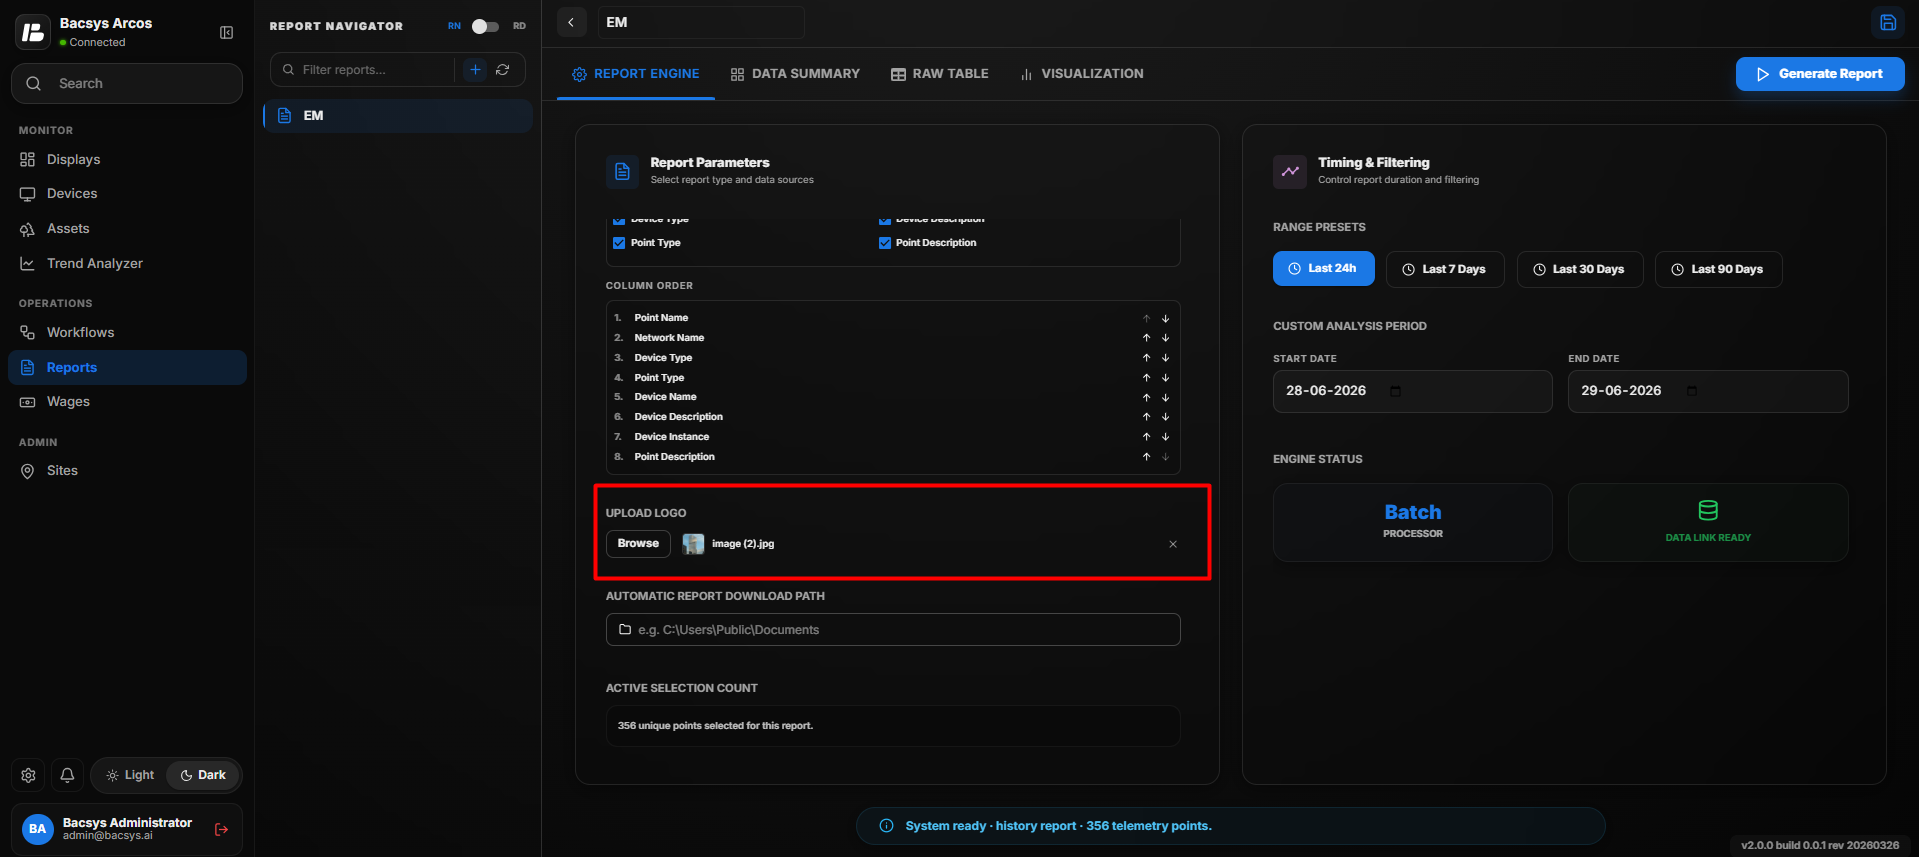
Users can include a custom company logo in the generated report.
- Click Upload Logo.
- Browse and select an image from your local system.
- The selected logo will appear in the generated report.
Automatic Report Download Path
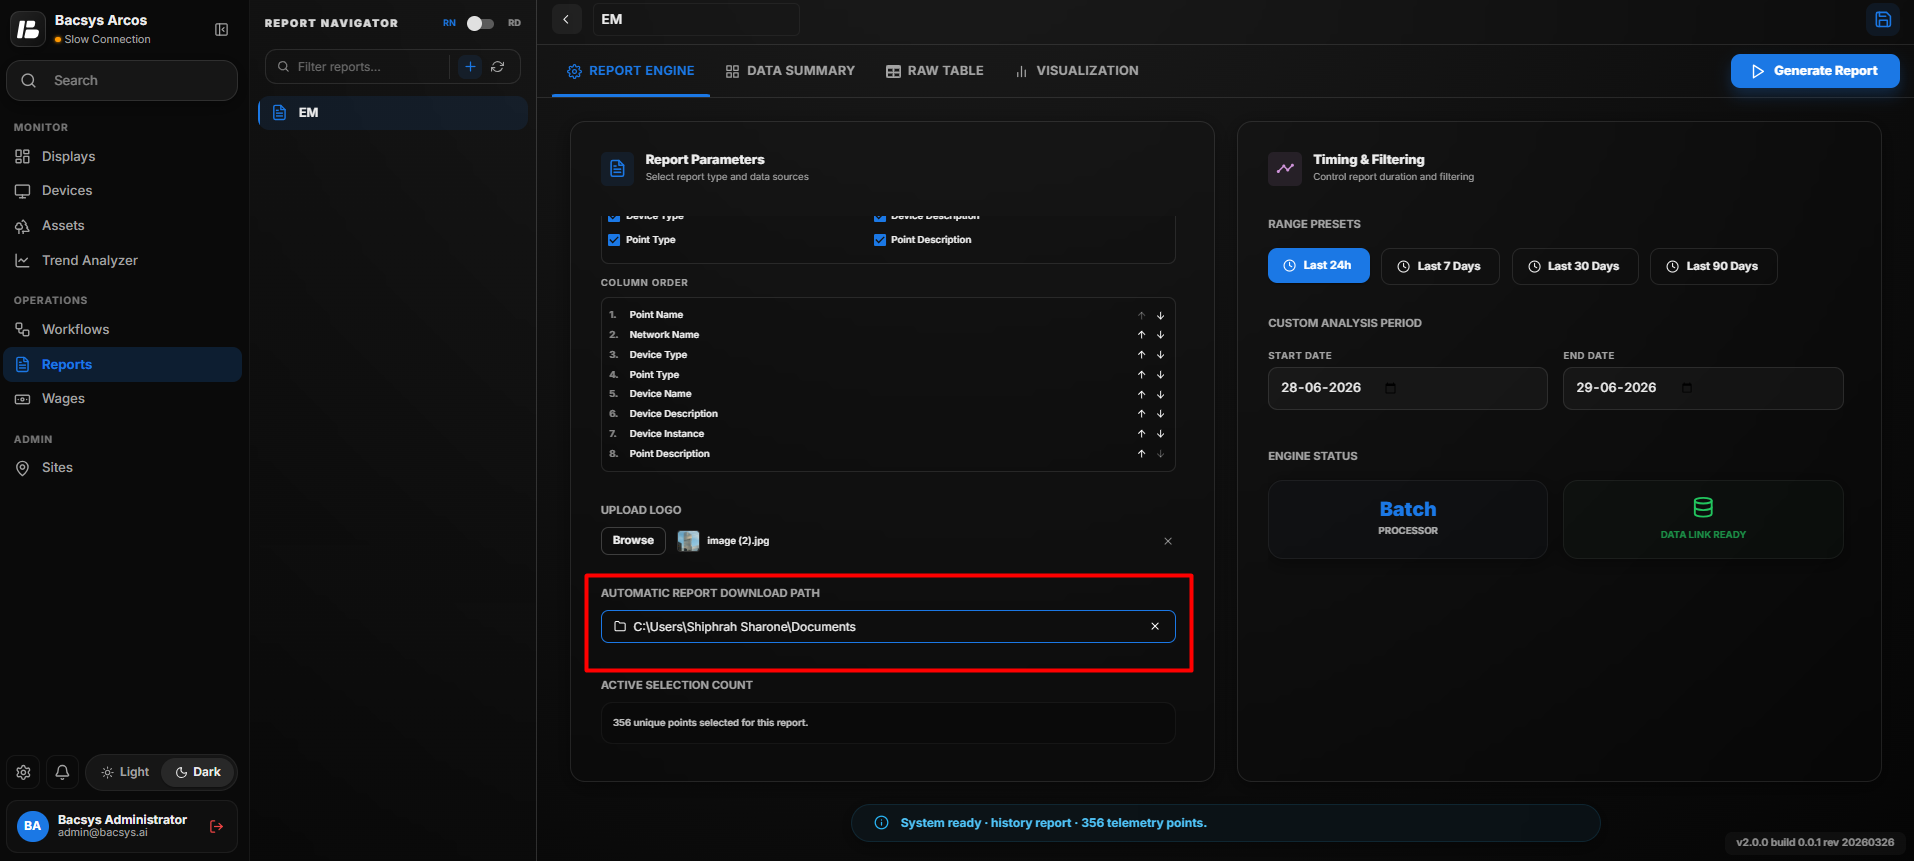 The Automatic Report Download Path specifies where generated reports will be saved automatically.
- Click Browse.
- Select the desired folder.
- Save the configuration.
All generated reports will be downloaded to the configured location.
Range Presets
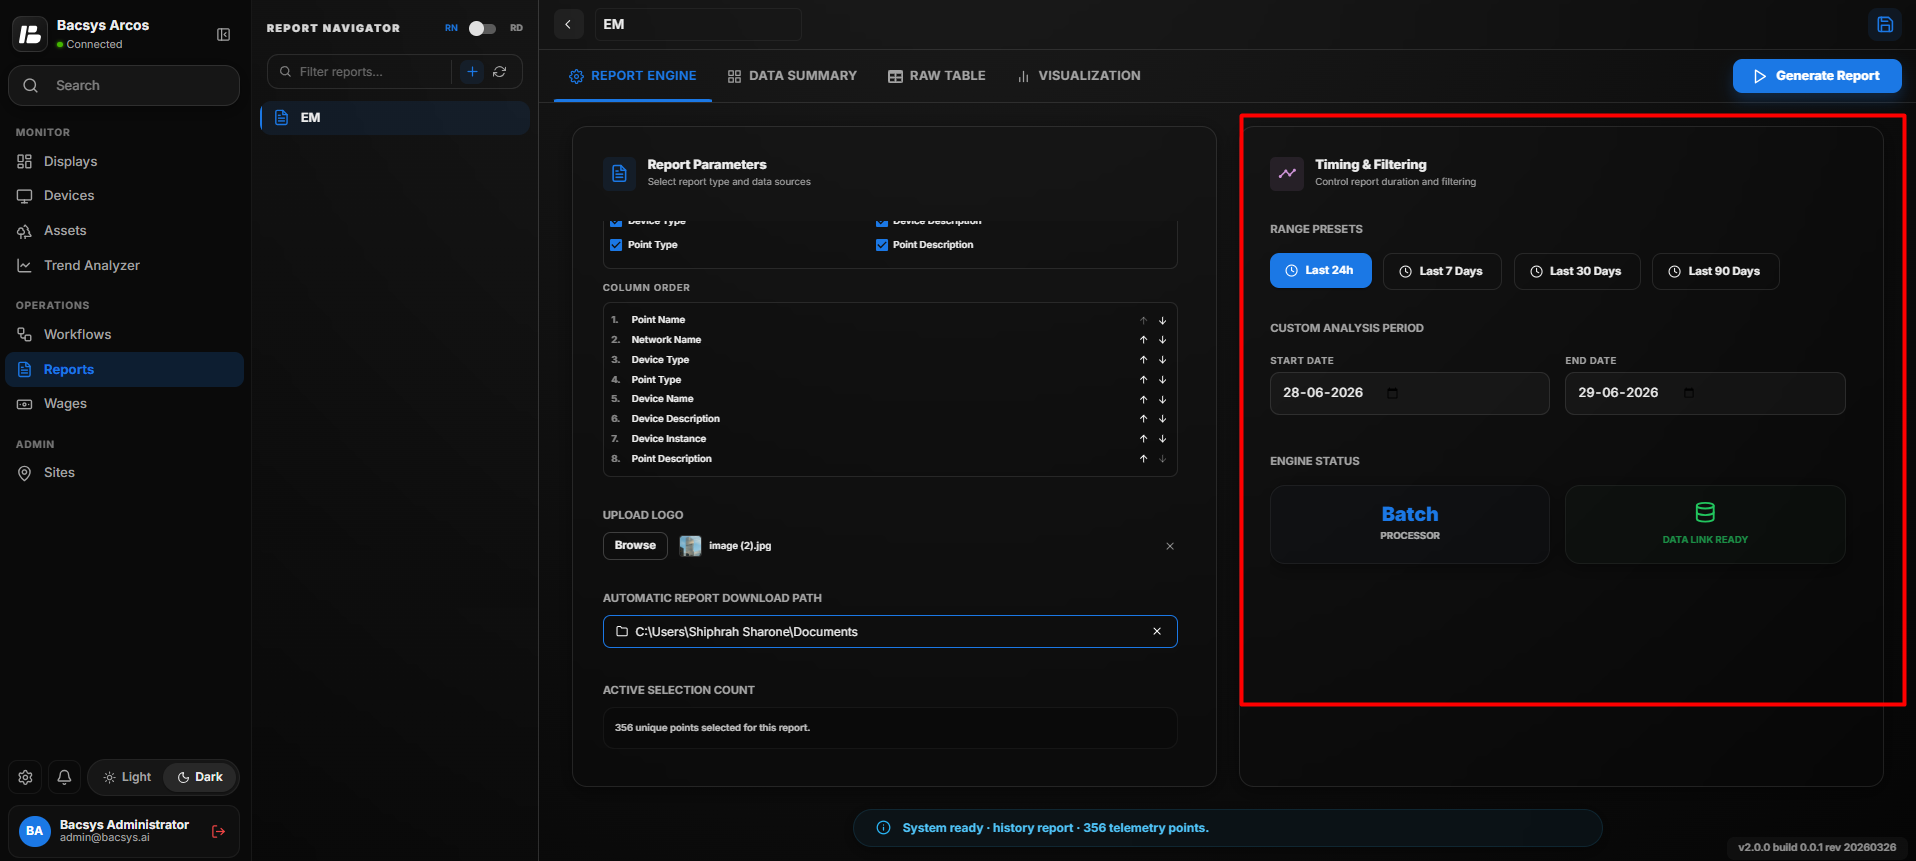
The Range Presets option provides quick date selections for report generation.
Available presets include:
- Last 24 Hours
- Last 7 Days
- Last 30 Days
- Last 90 Days
Alternatively, users can manually select the Start Date and End Date.
Generate Report
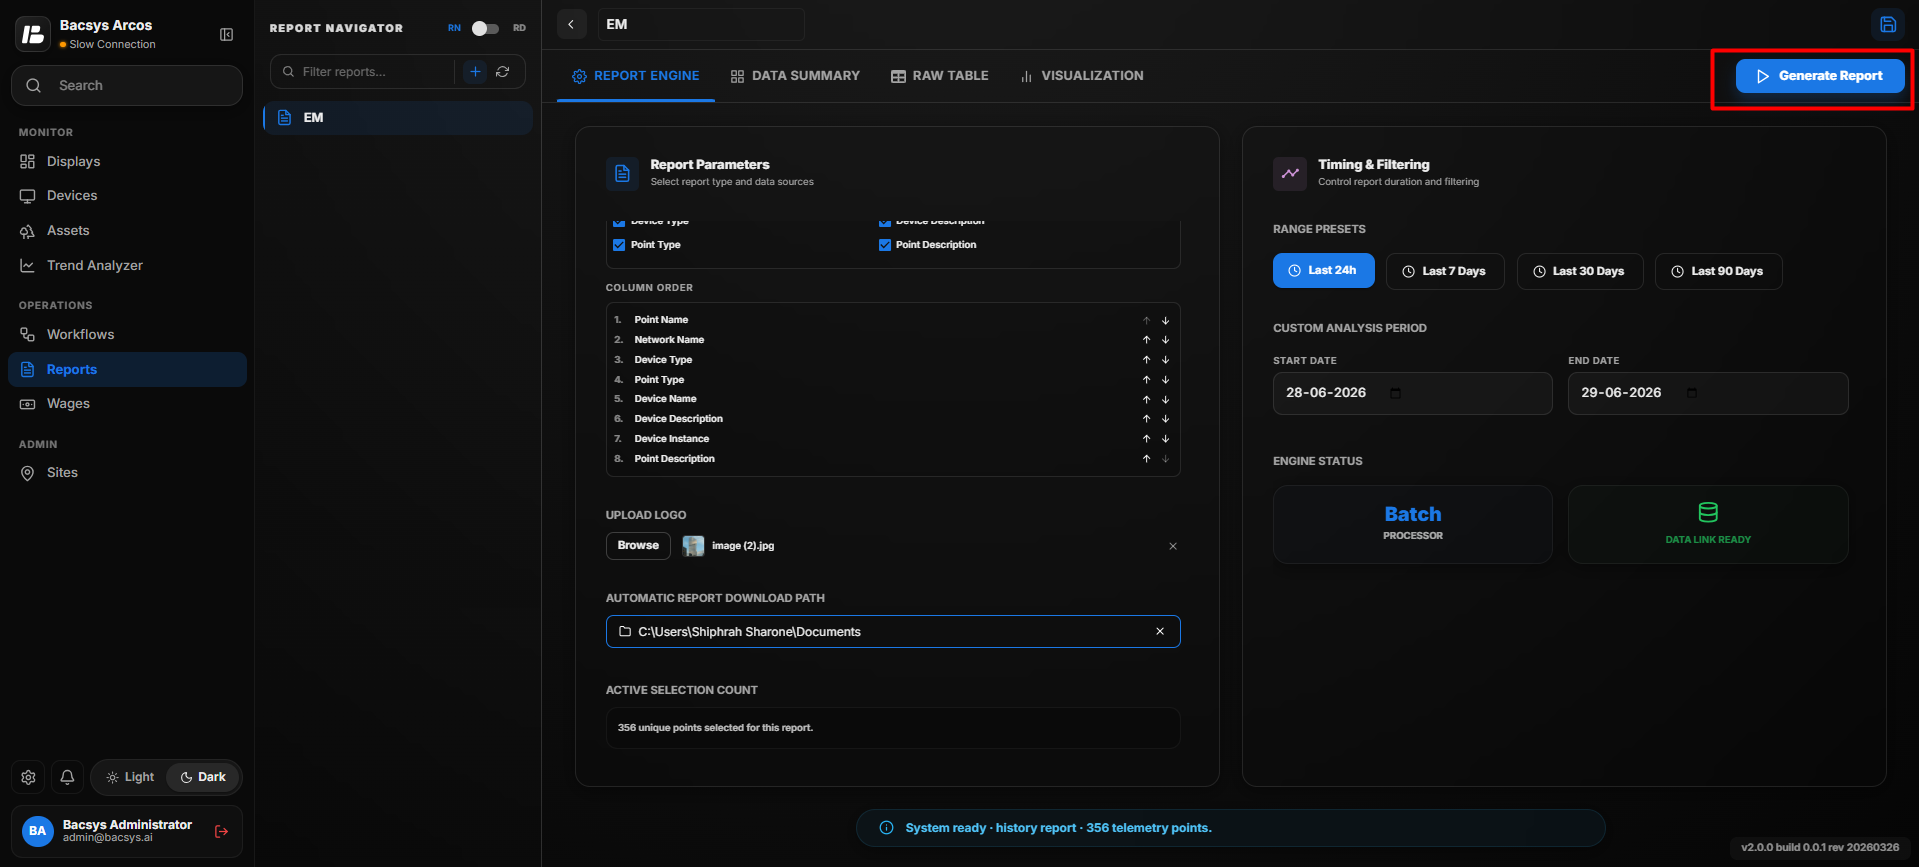 After completing the configuration:
- Verify all selected points and settings.
- Click Generate Report.
The system processes the selected data and generates the report.
Data Summary
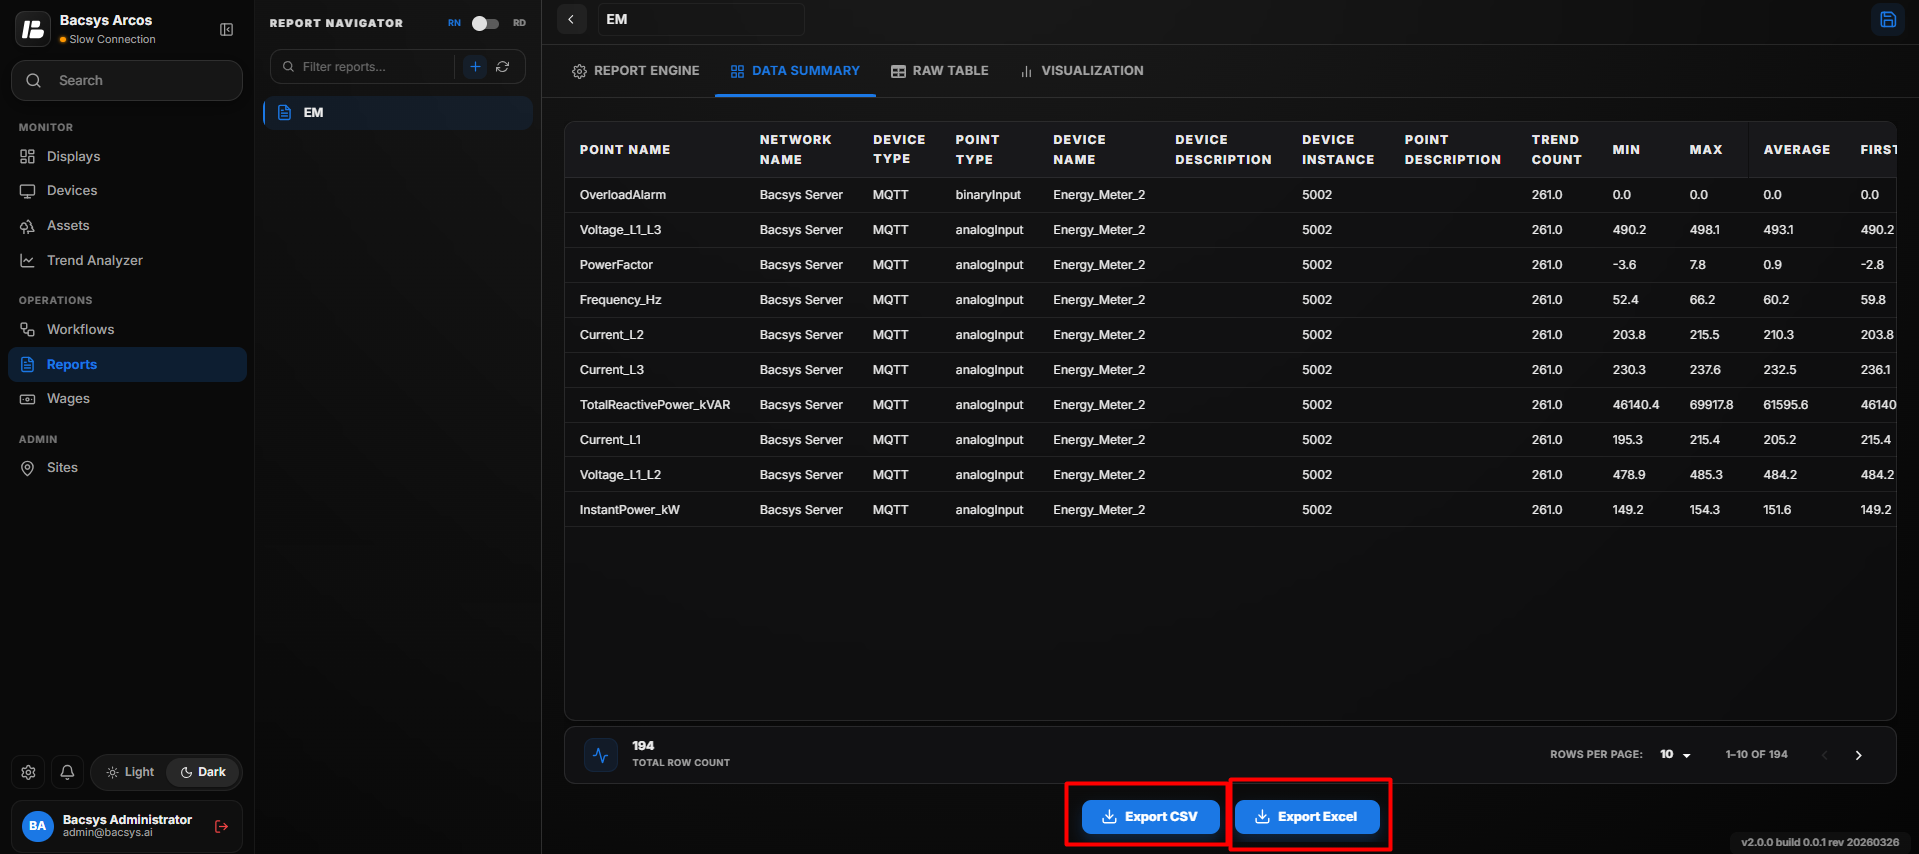 Data Summary
The Data Summary tab displays a statistical overview of the generated report.
It includes:
- Point Name
- Trend Count
- Minimum Value
- Maximum Value
- Average Value
- First Recorded Value
- First Timestamp
- Last Recorded Value
- Last Timestamp
Users can export the summary as:
- Excel
- CSV
Raw Table
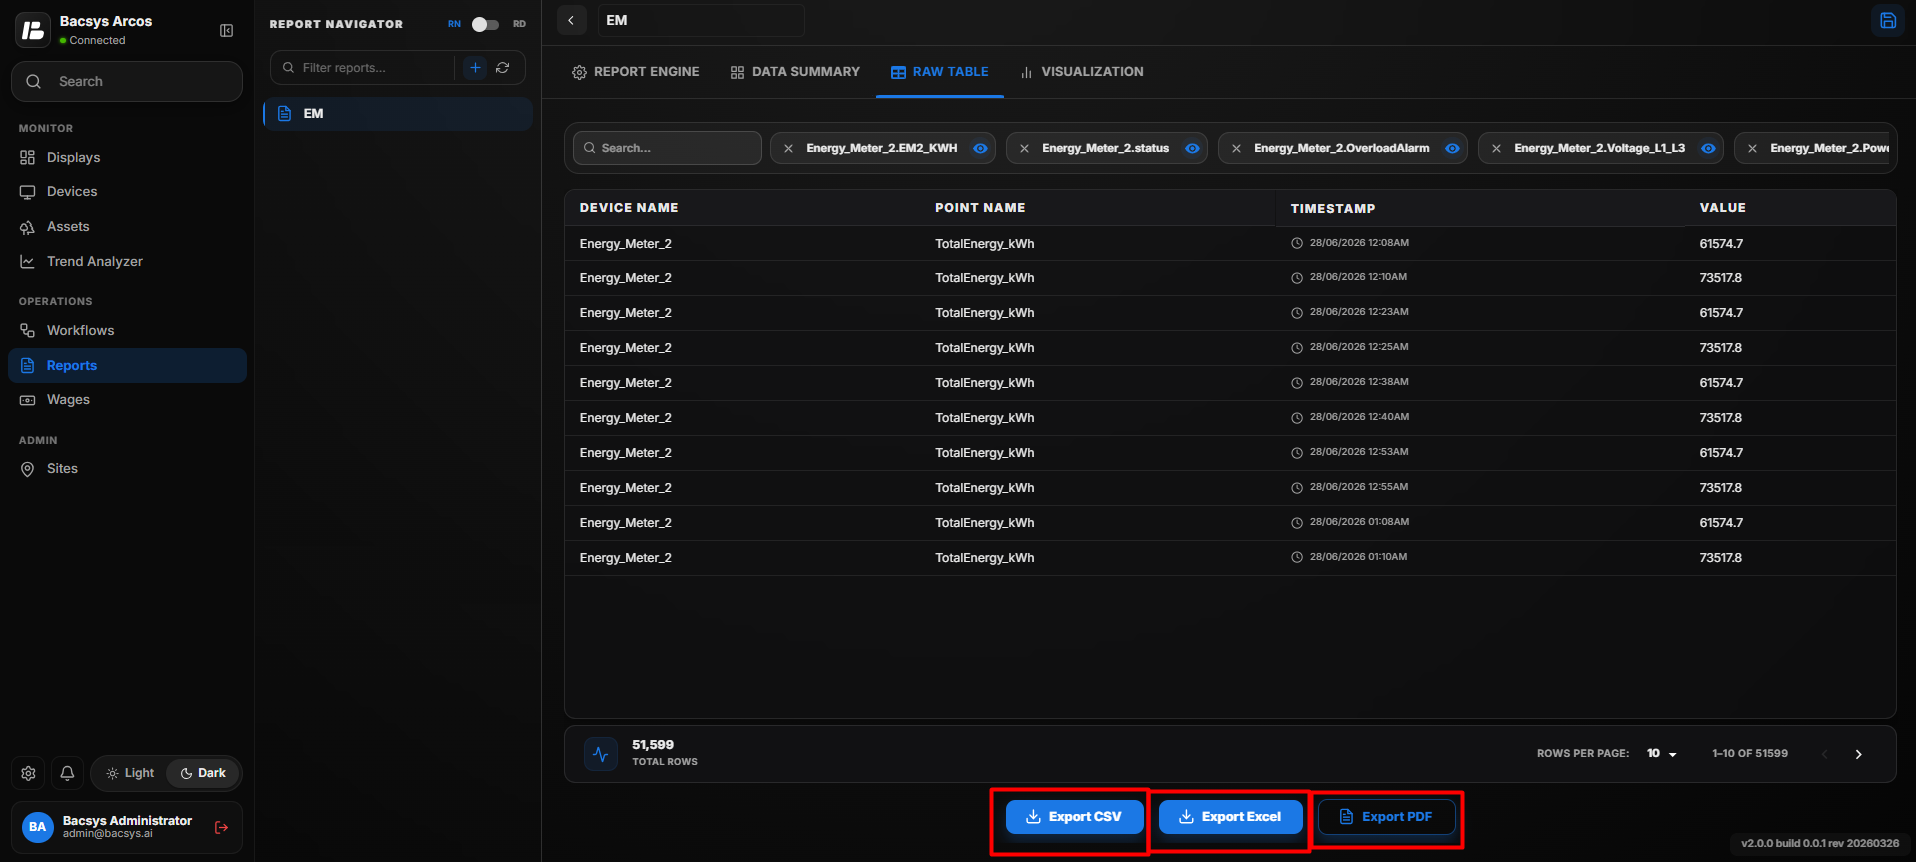 Raw Table
The Raw Table displays all recorded trend data exactly as stored in the database.
Each record contains:
- Timestamp
- Point Name
- Recorded Value
The Raw Table can be exported in:
- Excel
- CSV
Visualization
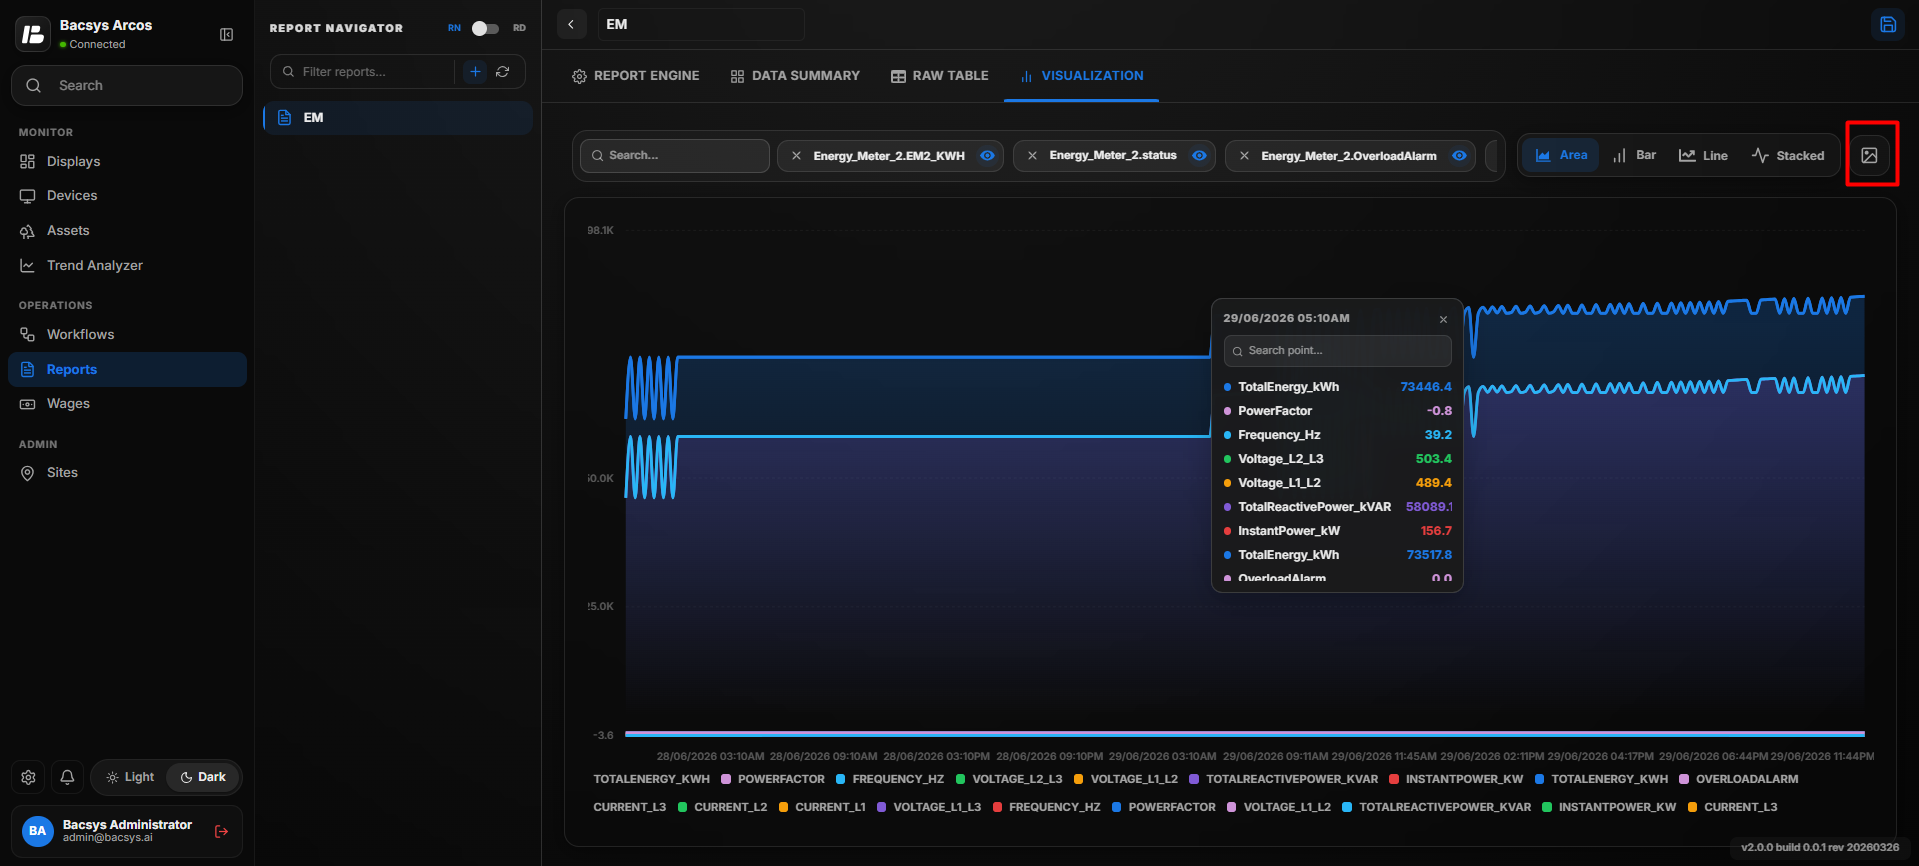
Visualization
The Visualization tab displays the selected trend data graphically.
Available chart types include:
- Area Chart
- Bar Chart
- Line Chart
- Stacked Chart
Users can:
- Hover over any data point to view its exact value.
- Compare trends visually.
- Download the displayed graph as an image by clicking the Photo icon.
Events Report Configuration
The Events Report displays alarm and event information for selected points within a specified time range. It enables users to analyze recorded events, view alarm details, and export reports in multiple formats.
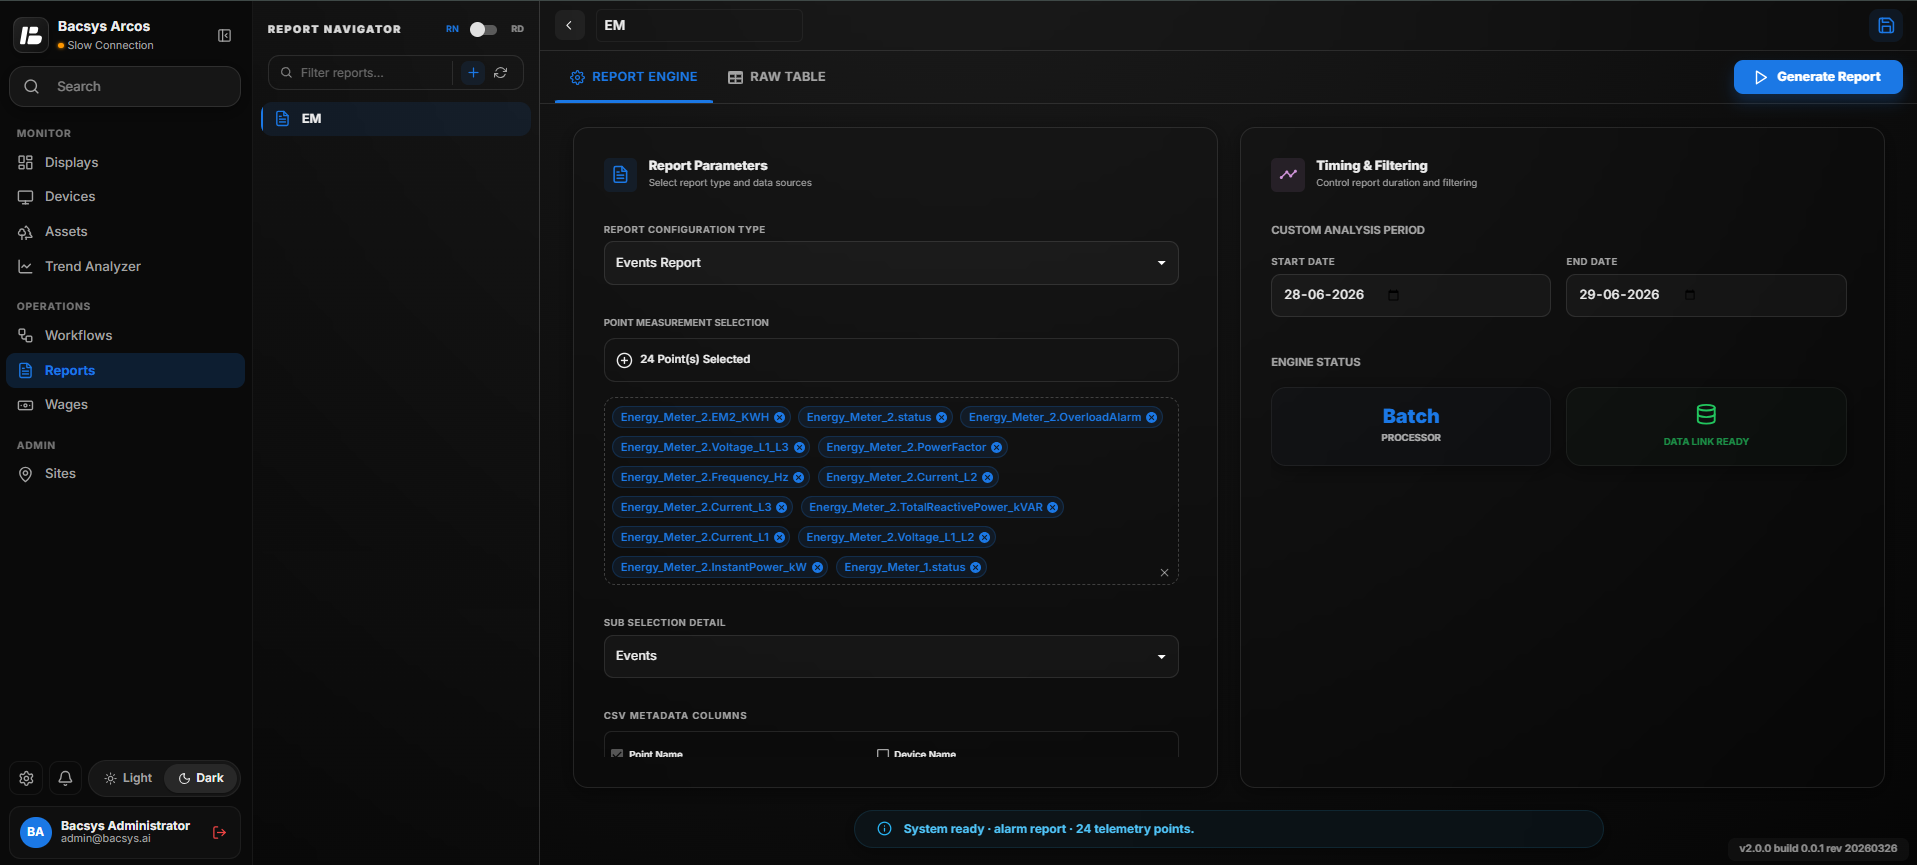
Events Report Configuration
Creating an Events Report
- Open the Report Navigator.
- Click the + icon to create a new report.
- Enter a report name as desired.
- From the Report Configuration Type dropdown, select Events Report.
Point Measurement Selection
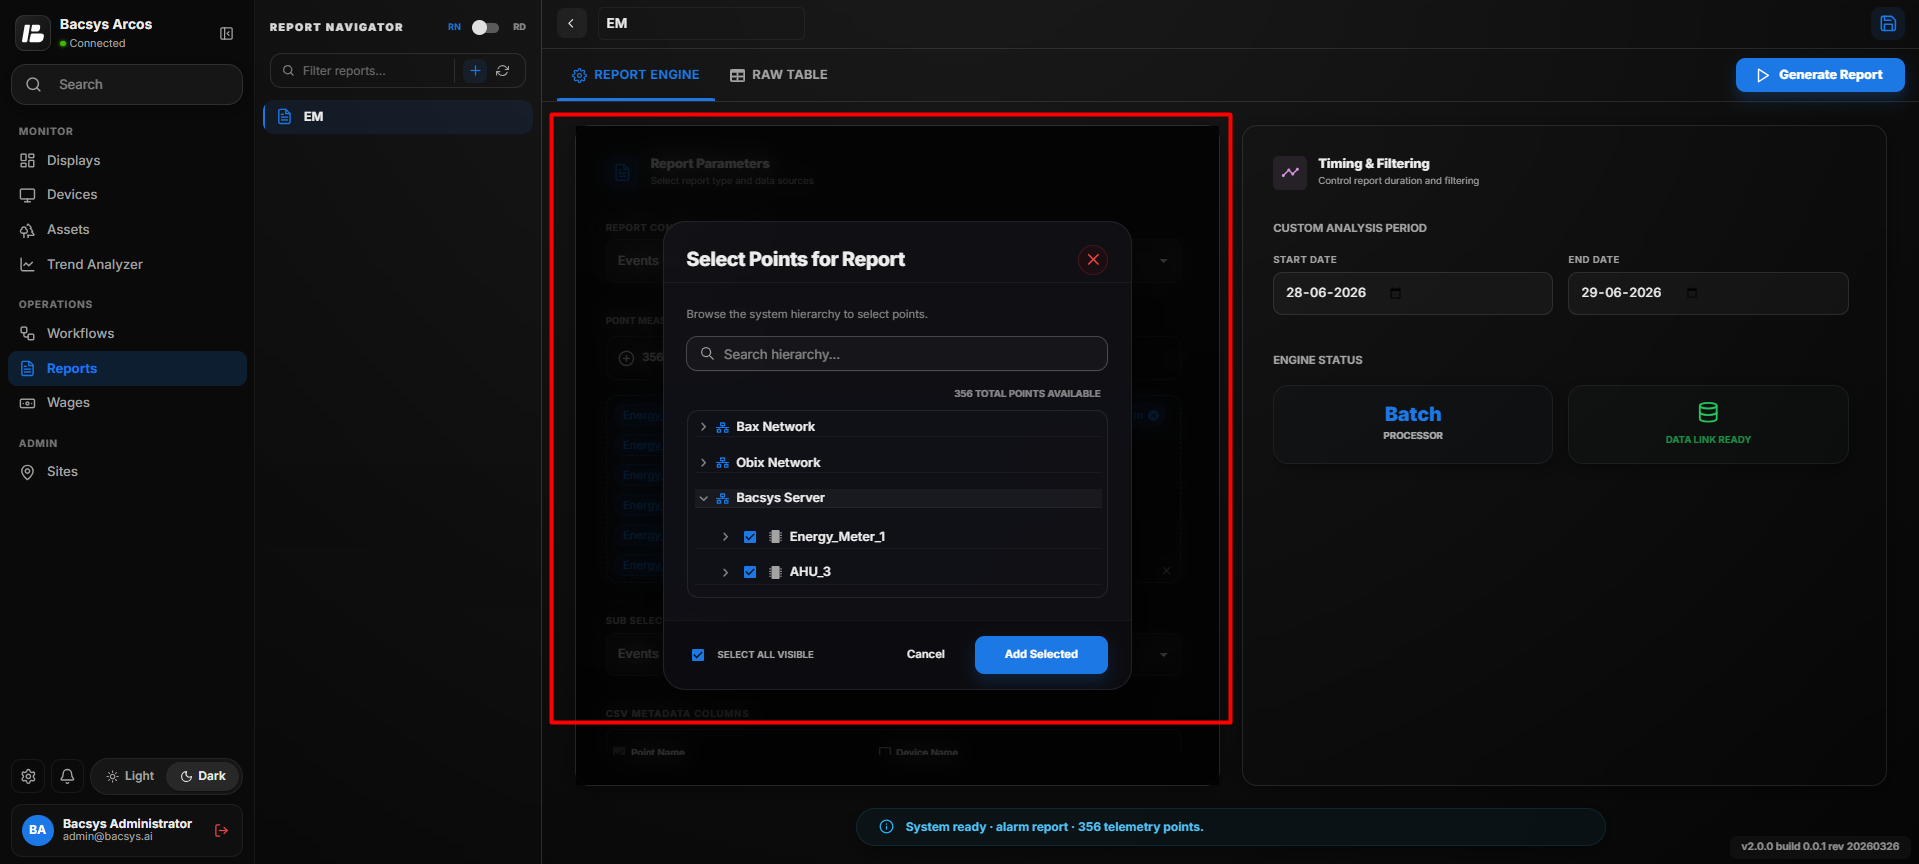
The Point Measurement Selection section allows users to choose the points for which event and alarm data will be generated.
Steps
- Click the + icon in the Point Measurement Selection section.
- A Point Selection dialog box appears.
- Browse and select the required device or expand the device tree to view the available points.
- Select one or more points by checking the corresponding checkboxes.
- To include all available points, use the Select All option.
- Click Add Selected to add the chosen points to the report configuration.
Note
- Multiple devices and points can be selected simultaneously.
- The selected points are displayed in the Point Measurement Selection list and will be included when the report is generated.
Event Configuration
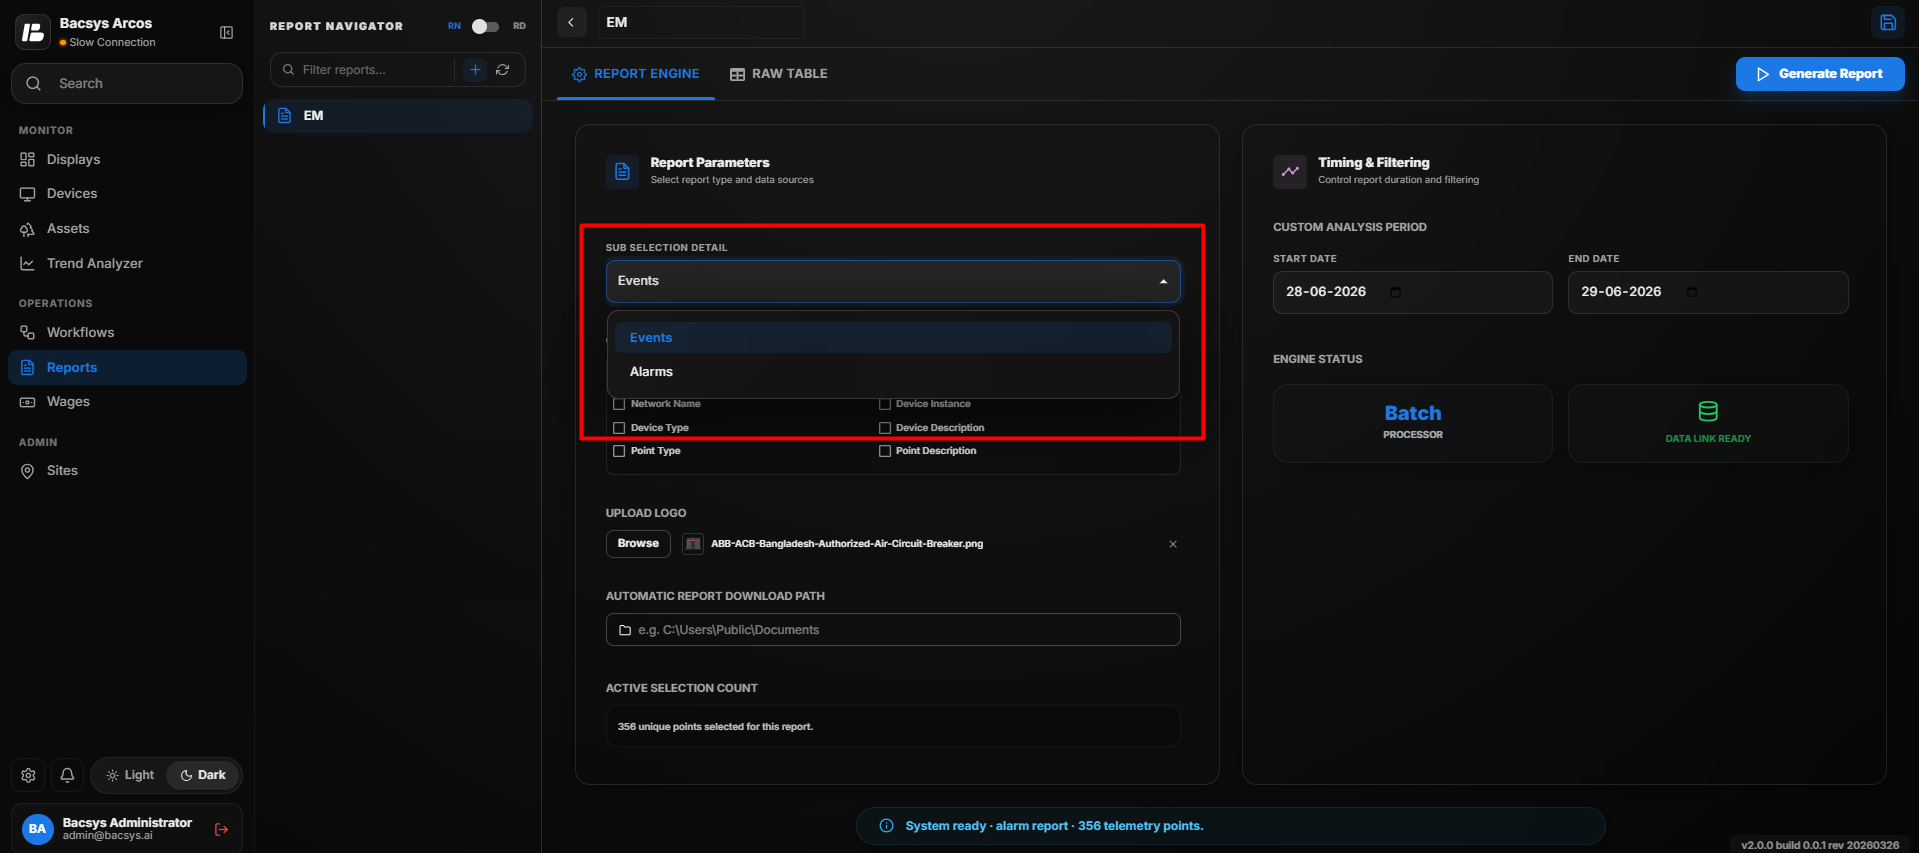
Configure the event report using the available filters.
- Select the required Event Type.
- Select the required Source State.
CSV Metadata Columns
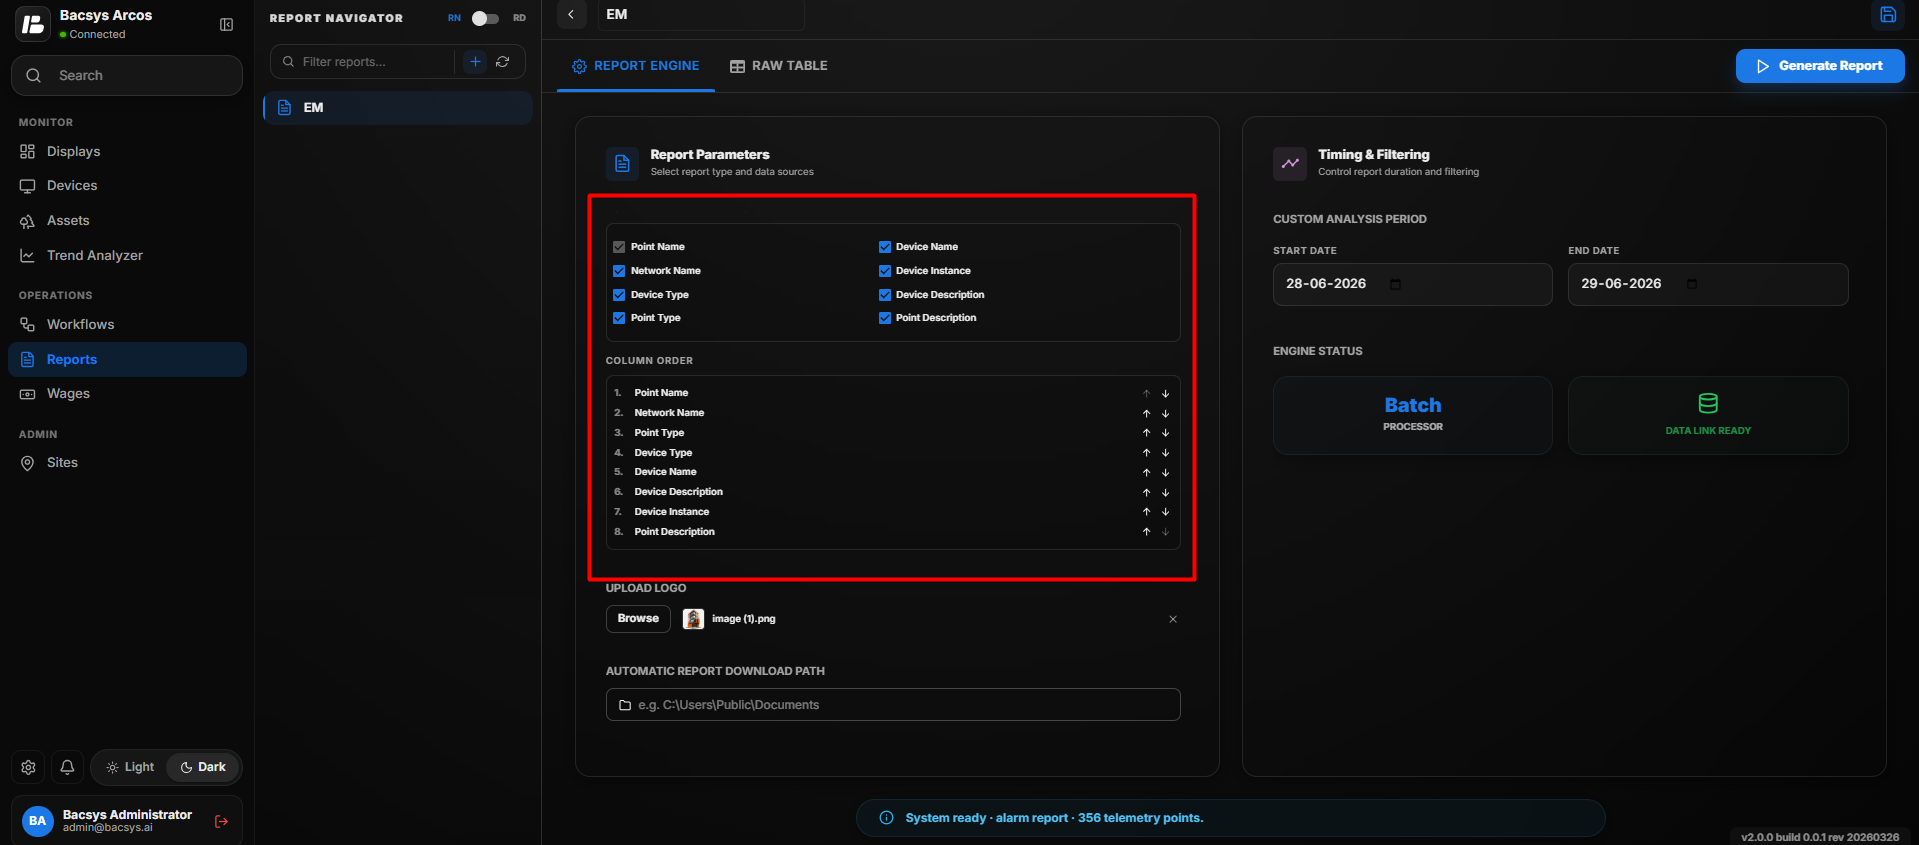
The CSV Metadata Columns section allows users to choose which information should be included in the exported report.
- Select the required checkboxes.
- Move the selected columns into the preferred display order.
- The exported report will include only the selected metadata fields.
Report Logo
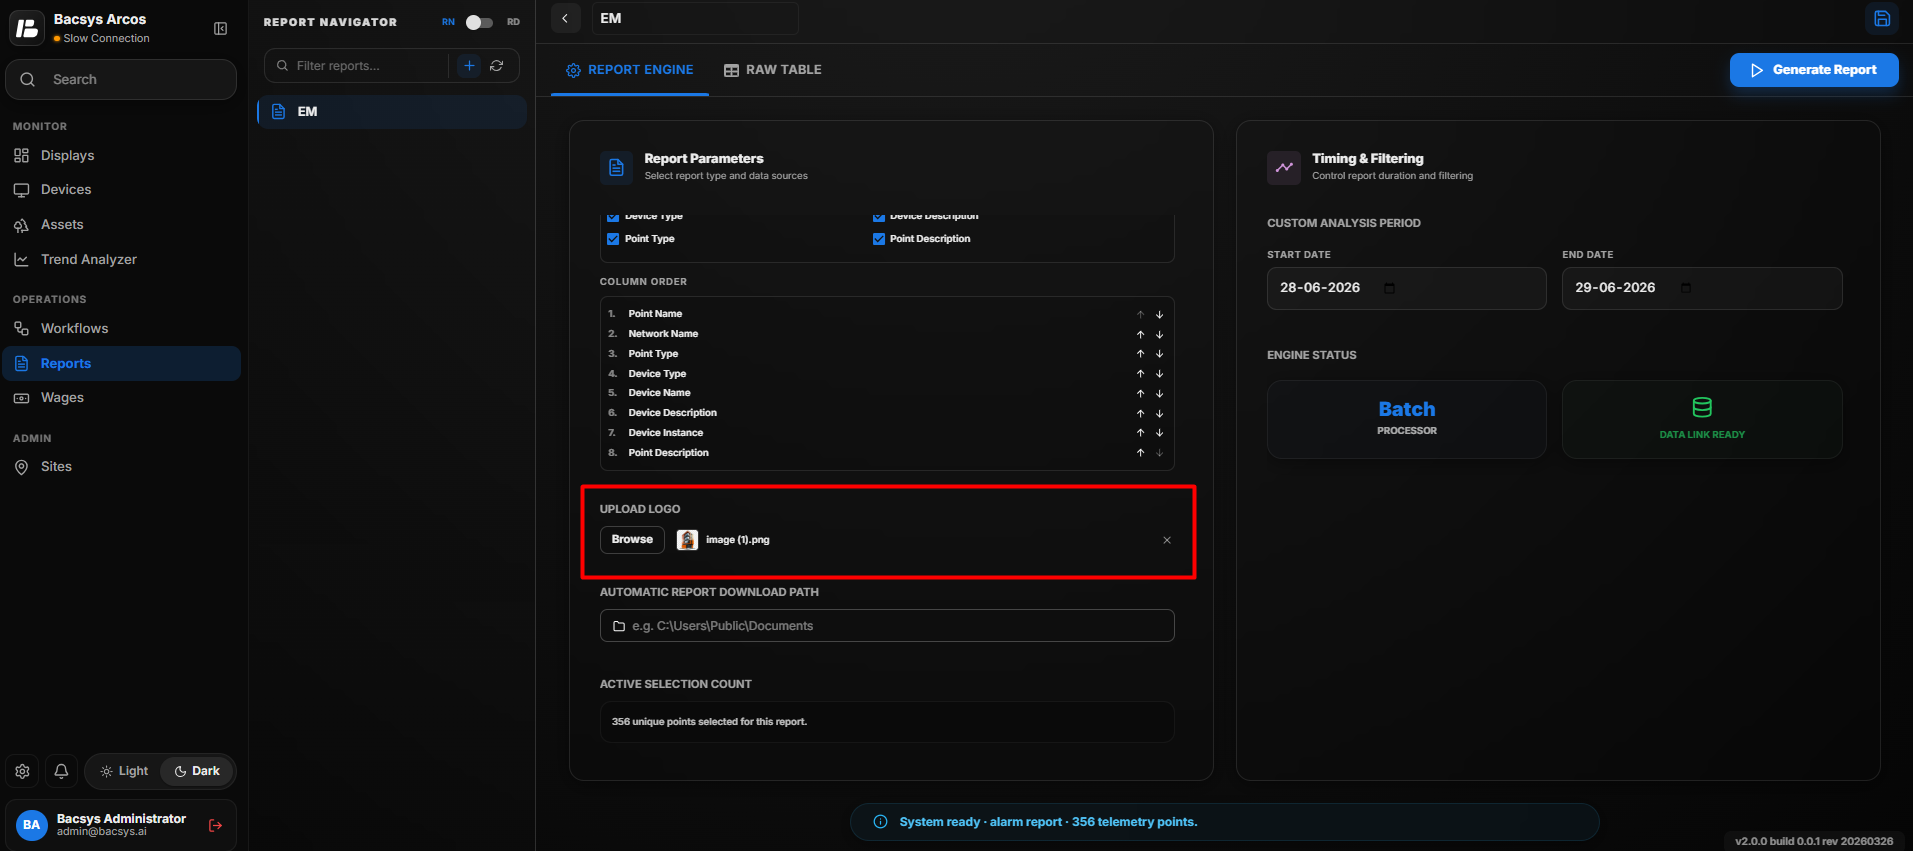
Users can include a custom company logo in the generated report.
- Click Upload Logo.
- Browse and select an image from your local system.
- The selected logo will appear in the generated report.
Automatic Report Download Path
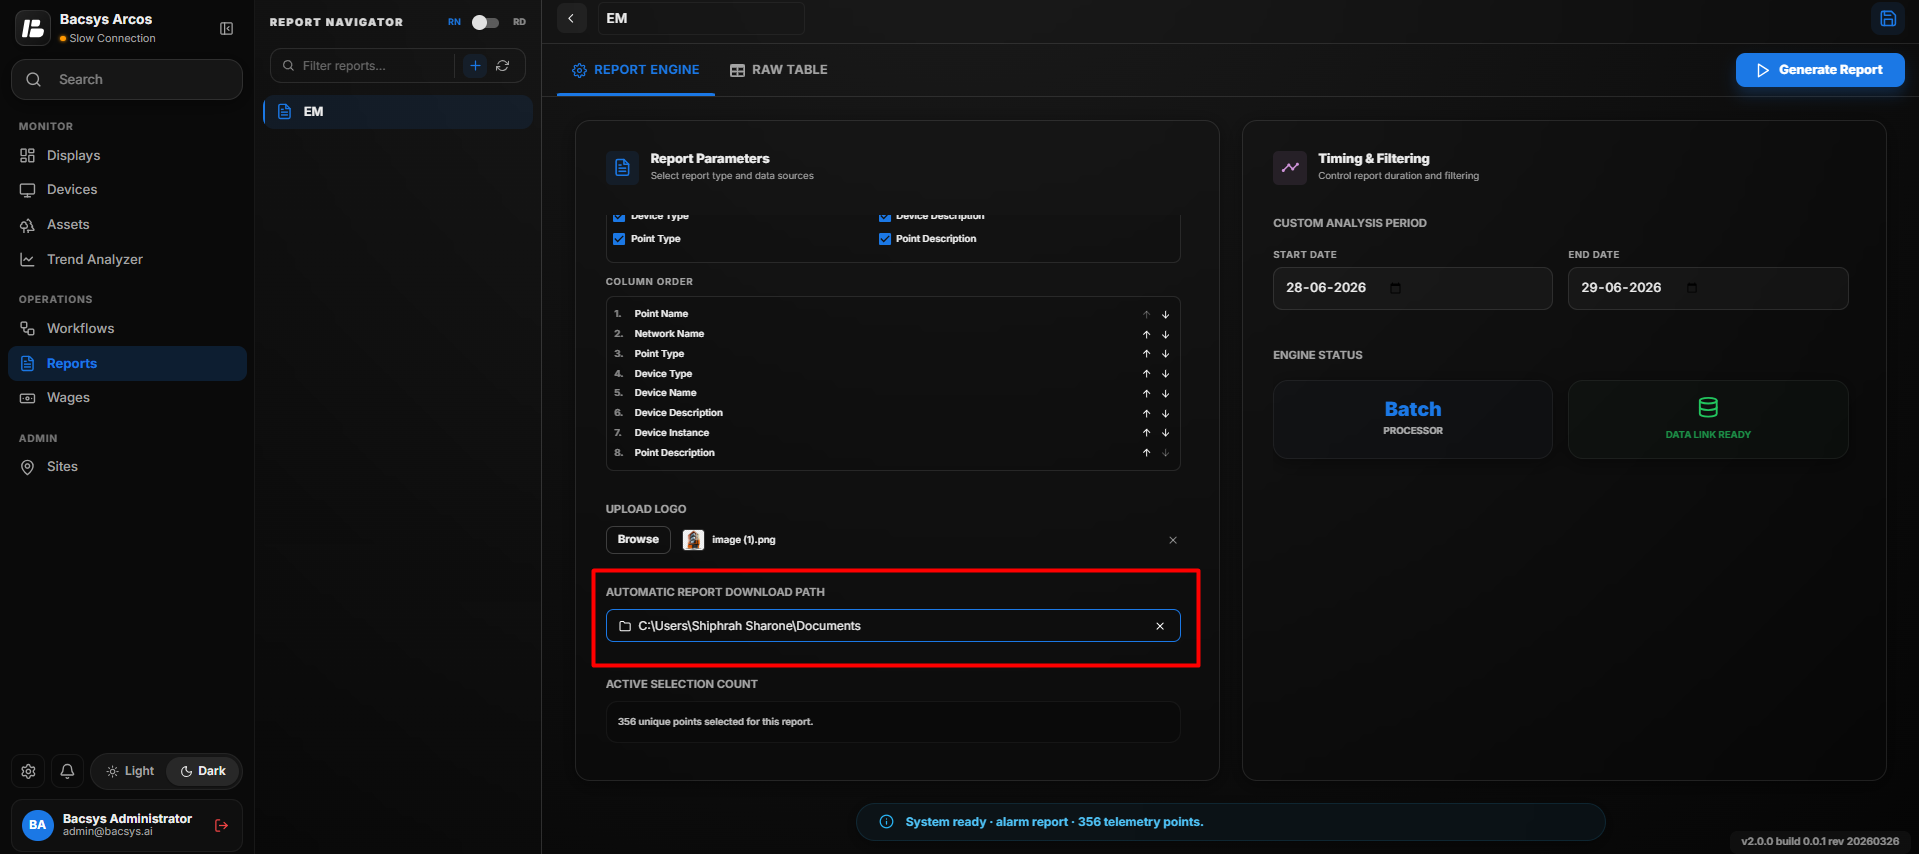 The Automatic Report Download Path specifies where generated reports will be saved automatically.
- Click Browse.
- Select the desired folder.
- Save the configuration.
All generated reports will be downloaded to the configured location.
Range Presets
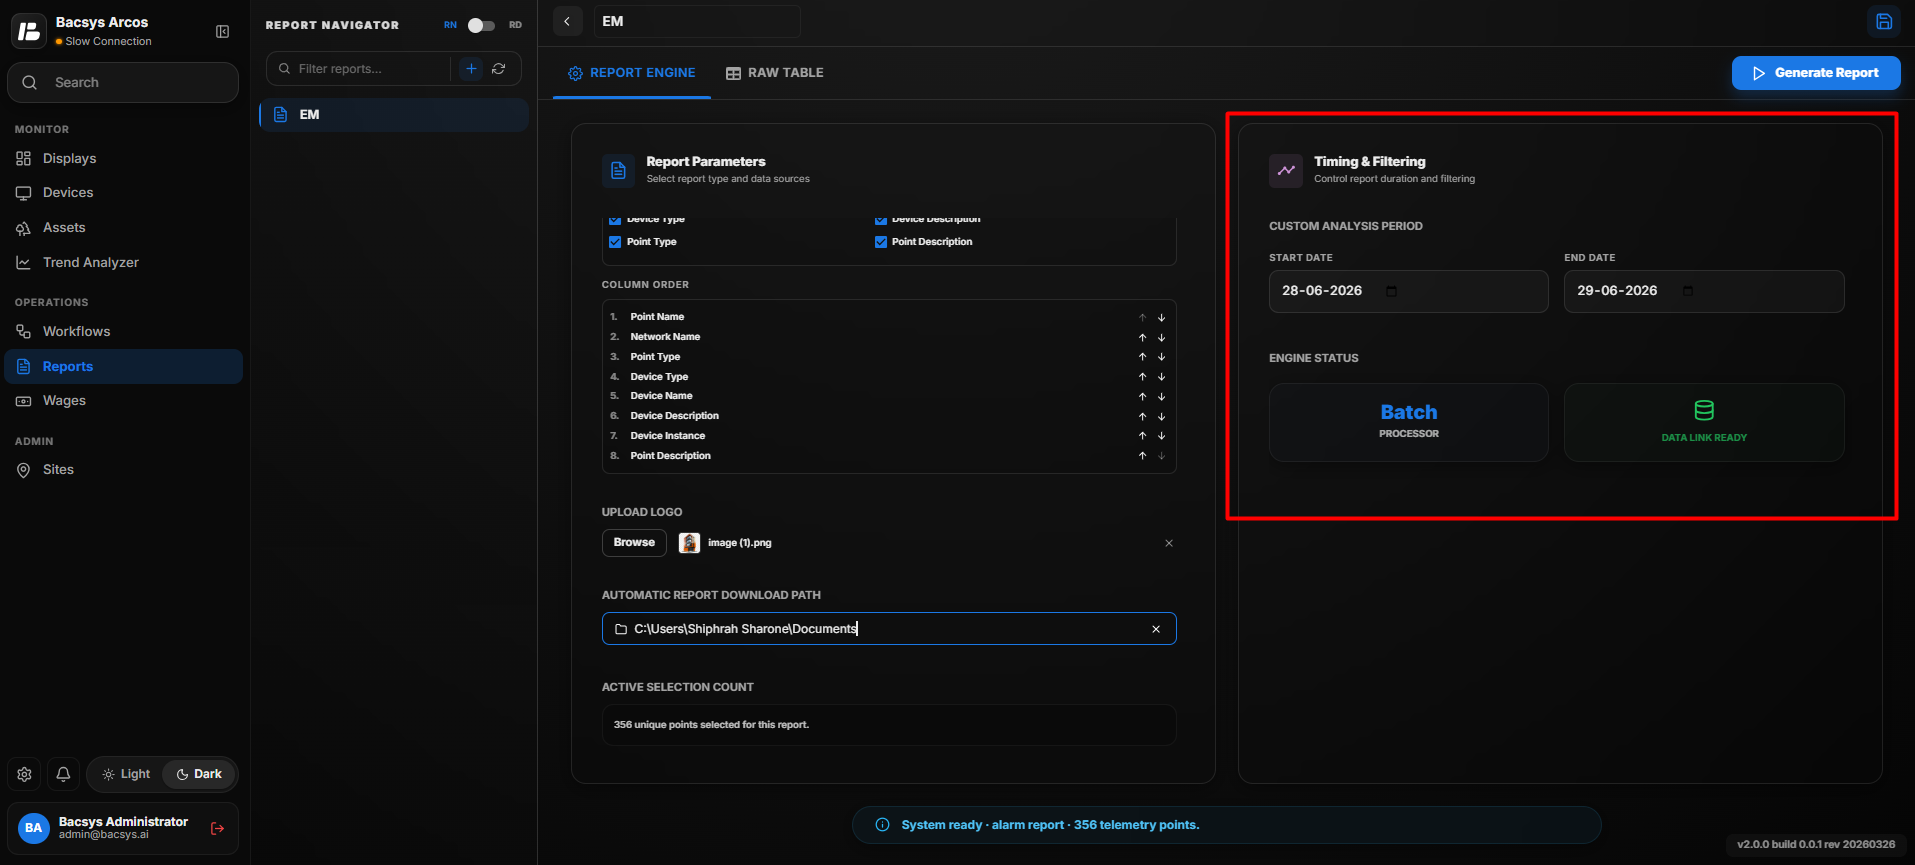
The Range Presets option provides quick date selections for report generation.
Available presets include:
- Last 24 Hours
- Last 7 Days
- Last 30 Days
- Last 90 Days
Alternatively, users can manually select the Start Date and End Date.
Generate Report
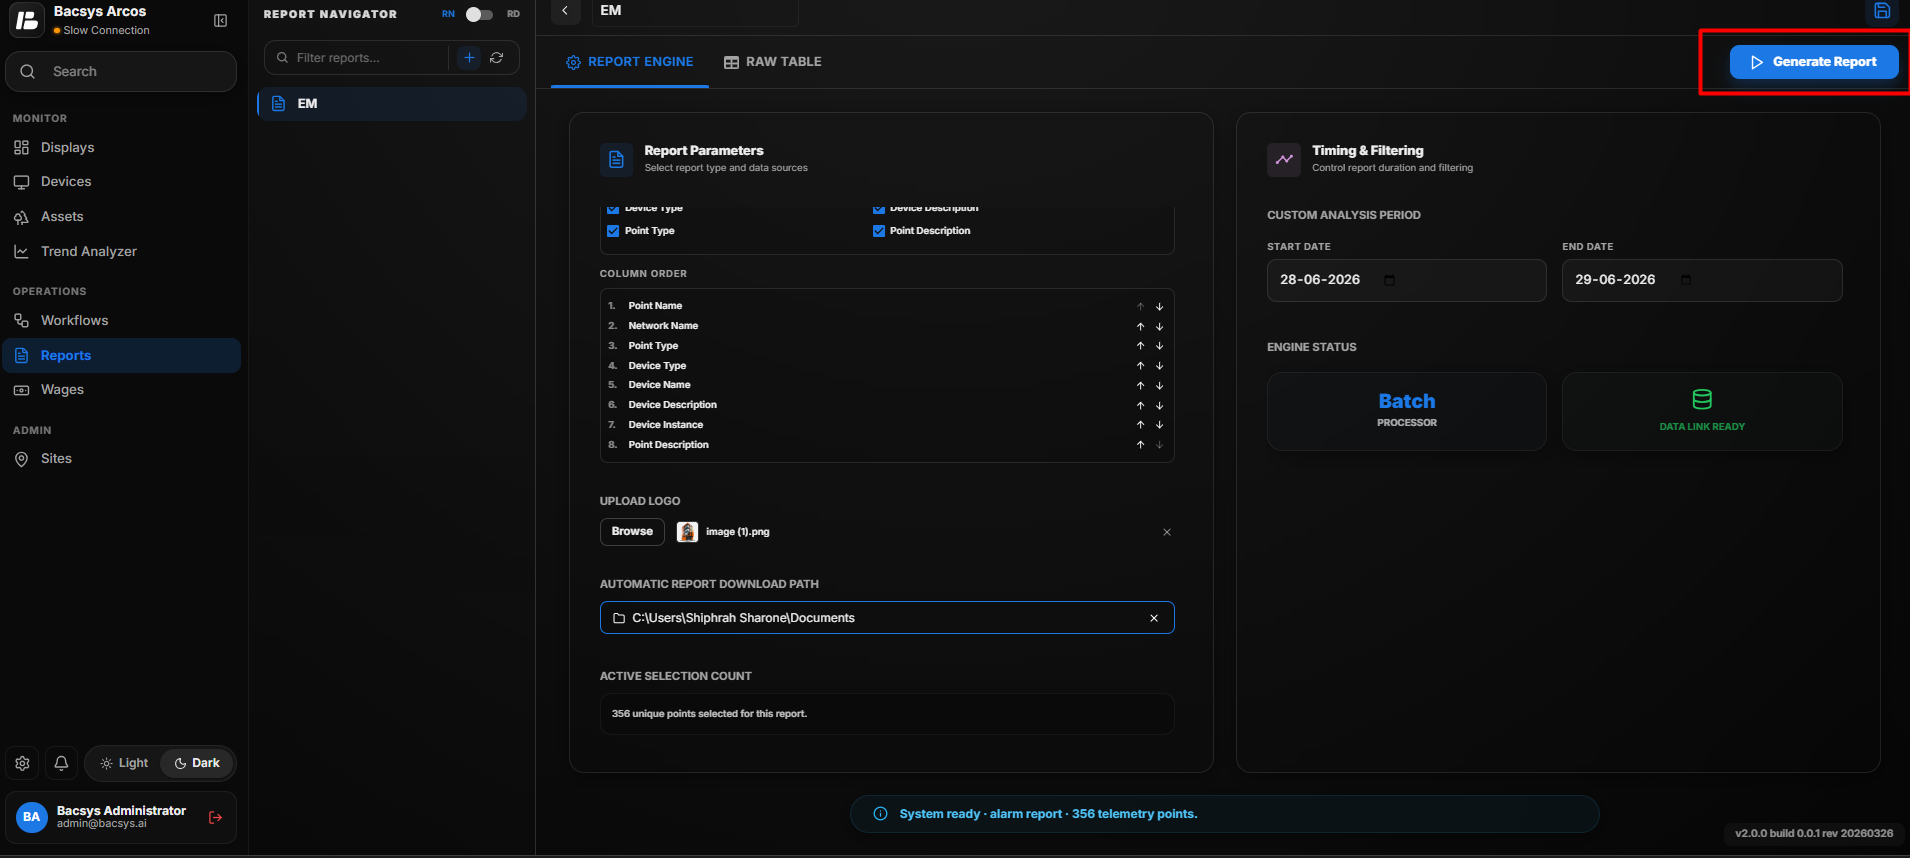 After completing the configuration:
- Verify all selected points and settings.
- Click Generate Report.
The system processes the selected data and generates the report.
Raw Table
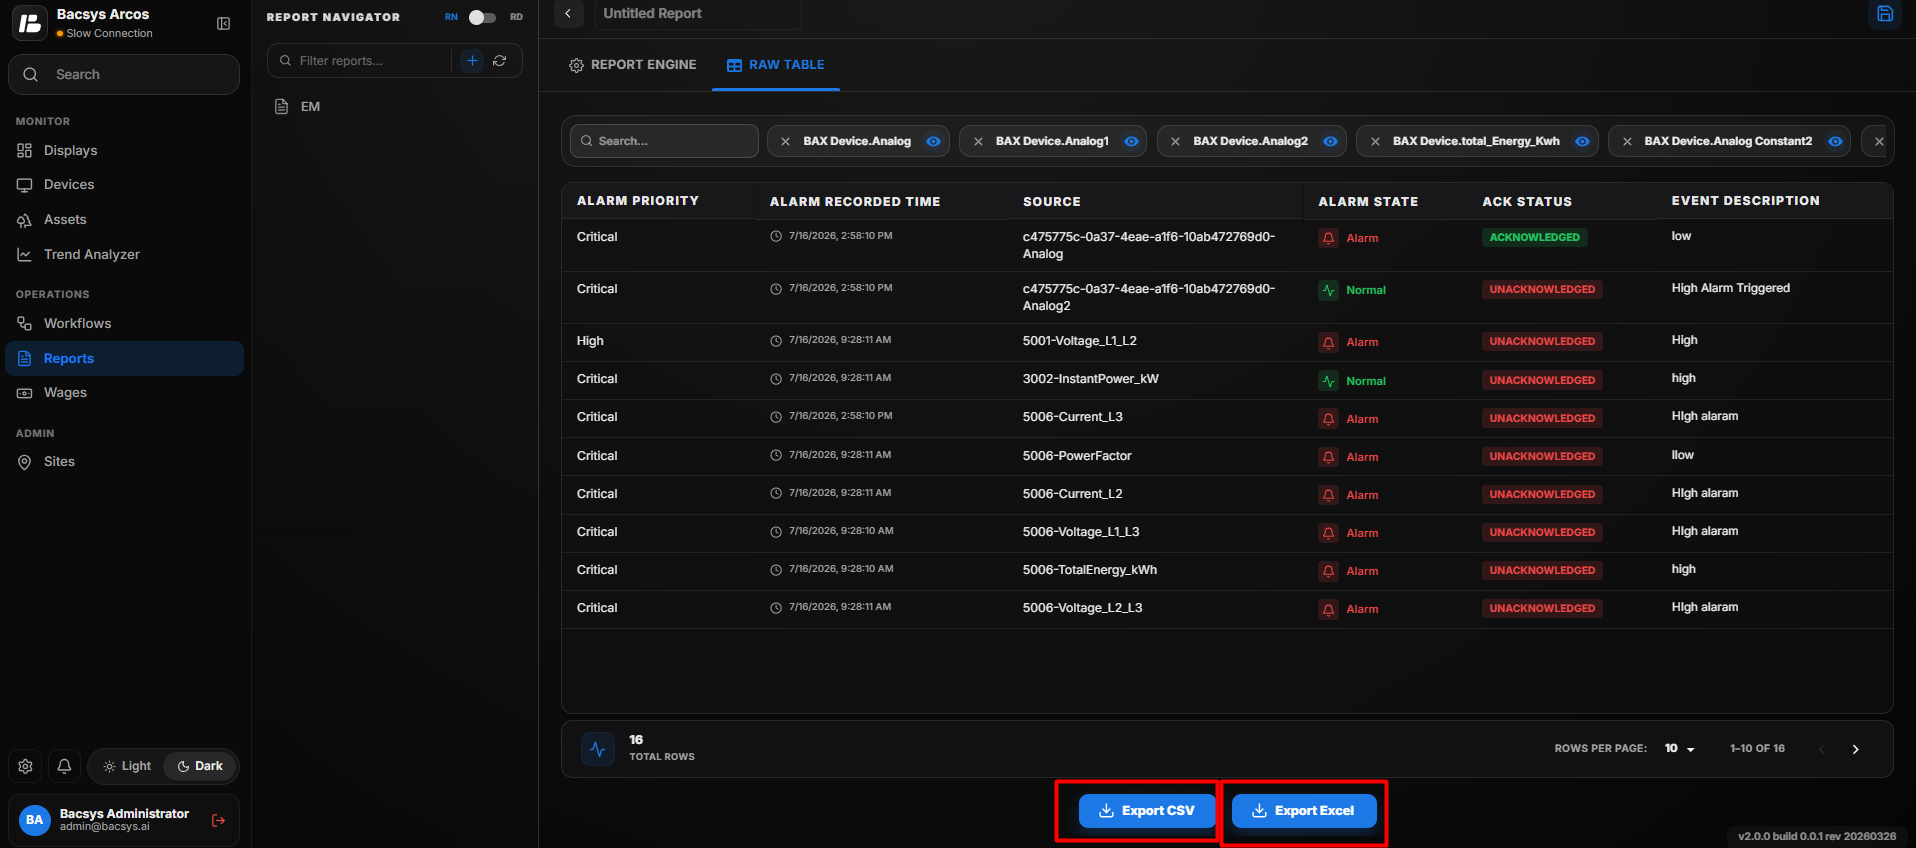
Events Report - Raw Table
The Raw Table displays all recorded events and alarms for the selected points within the specified time range.
The table includes information such as:
- Timestamp
- Point Name
- Event Type
- Alarm Status
- Priority
- Source State
- Description
Users can export the generated event data using:
- Export CSV
- Export Excel
These export options allow users to download the complete event report for further analysis or record keeping.
Instantaneous Report Configuration
The Instantaneous Report displays the current values of selected data points at the time the report is generated. It is useful for monitoring real-time device status and obtaining the latest point values without using historical trend data.
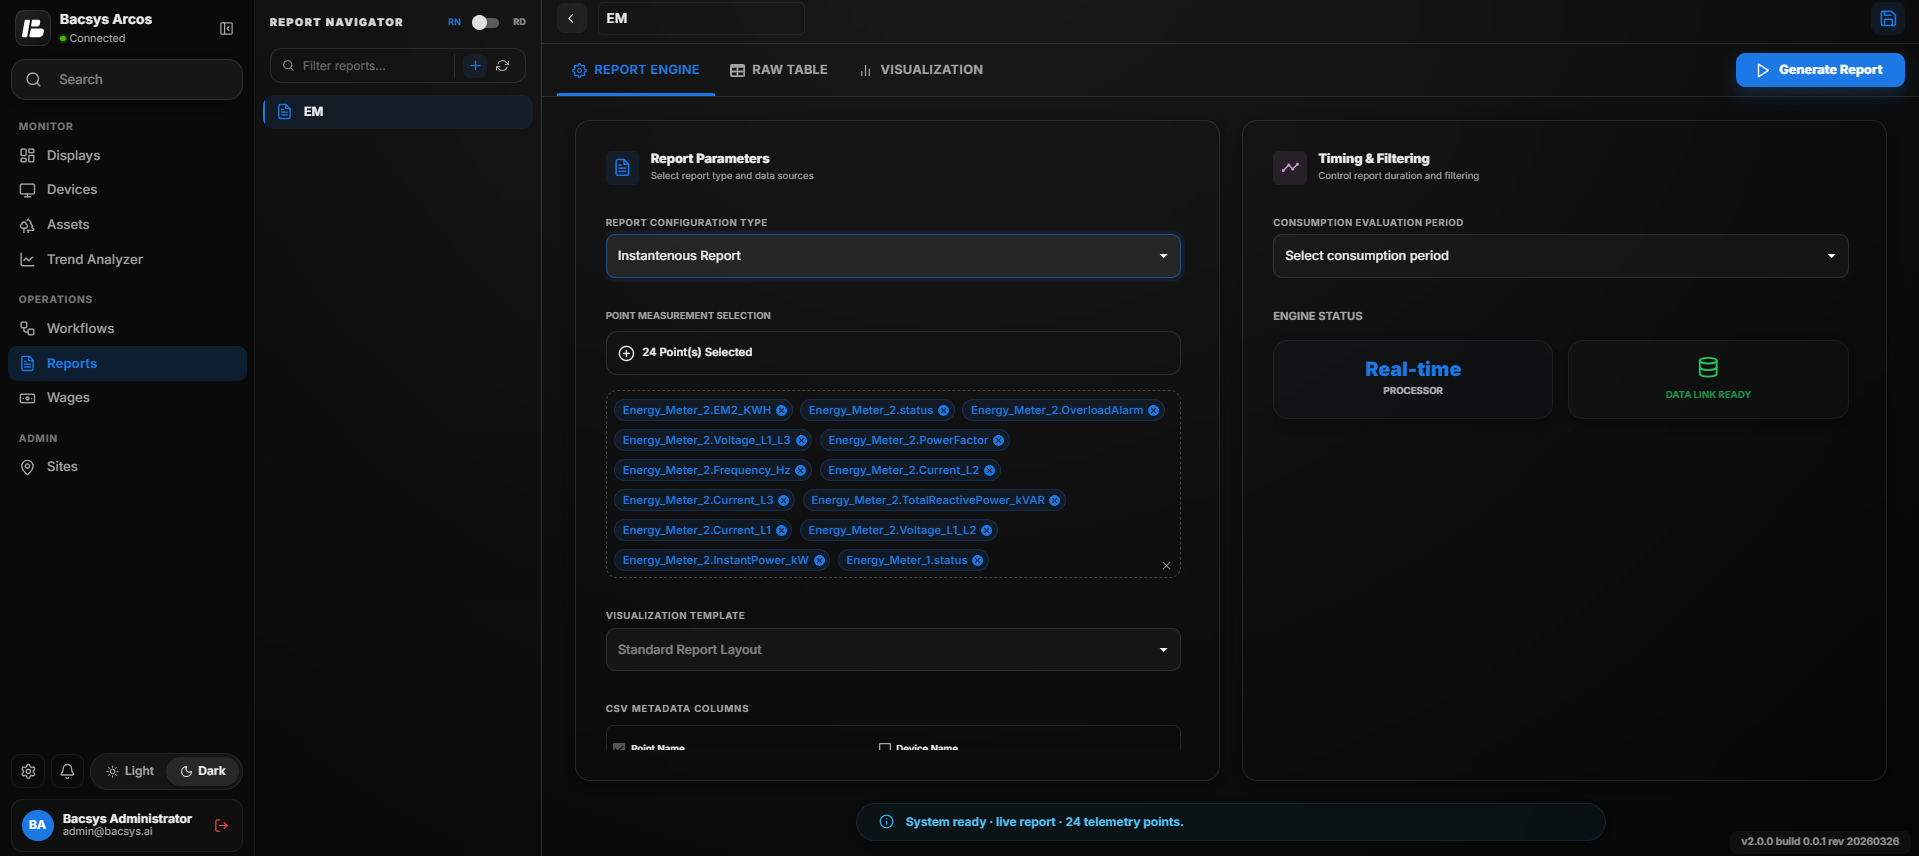 Instantaneous Report Configuration
Creating an Instantaneous Report
- Open the Report Navigator.
- Click the + icon to create a new report.
- Enter a report name as desired.
- From the Report Configuration Type dropdown, select Instantaneous Report.
Point Measurement Selection
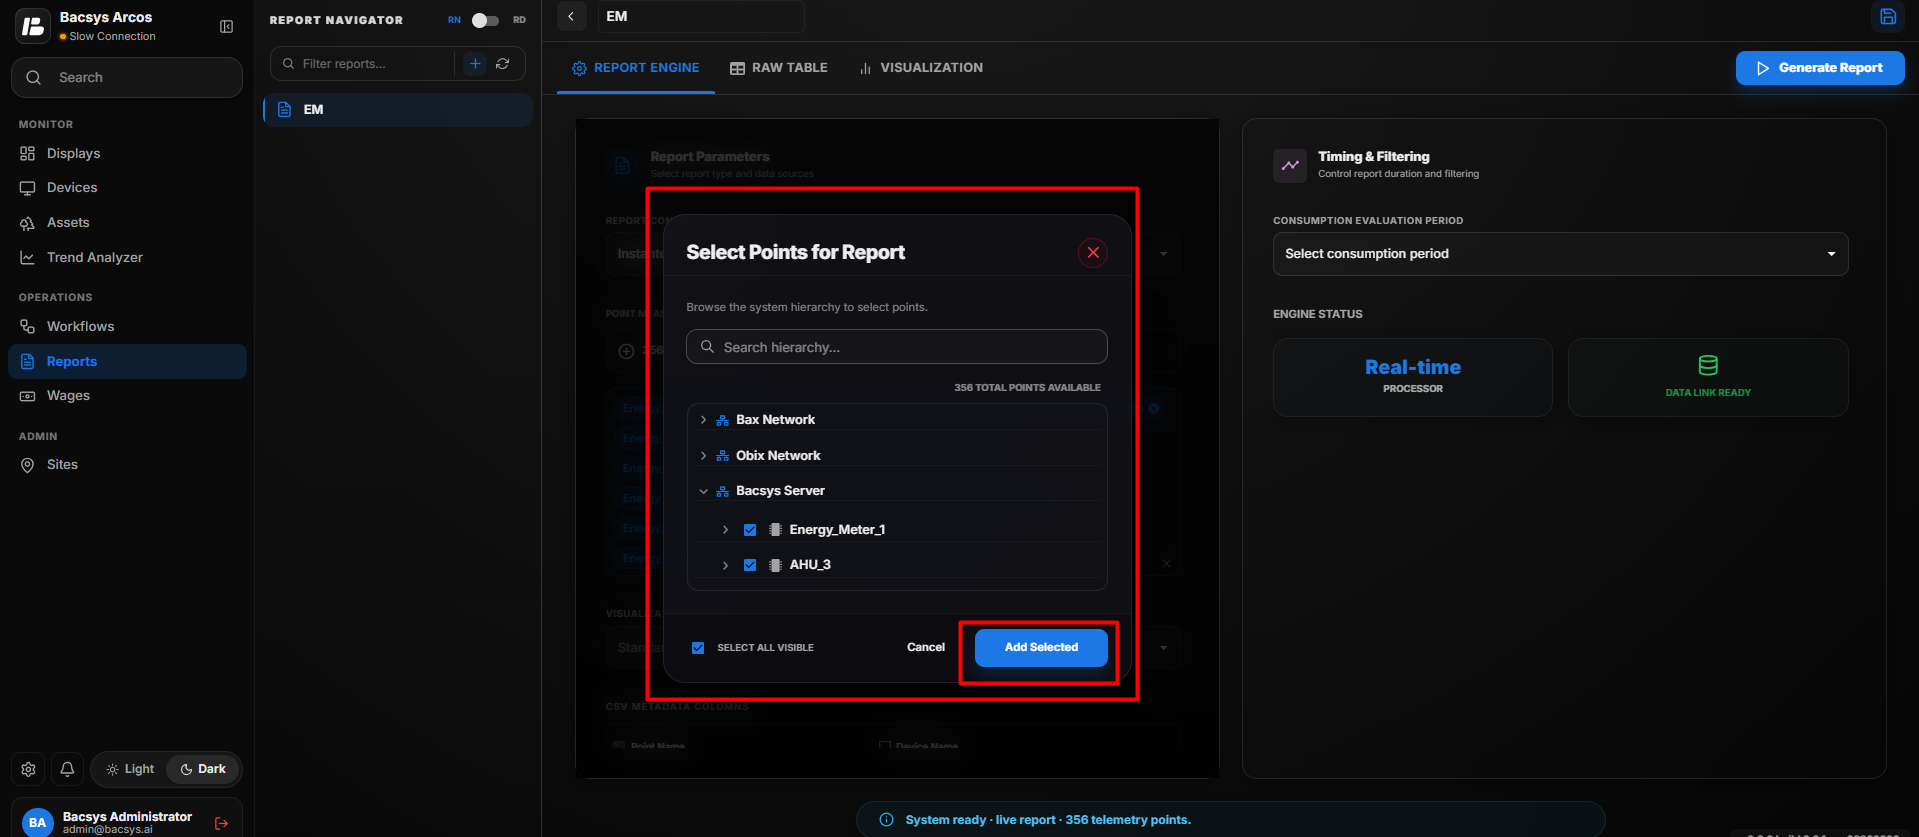
The Point Measurement Selection section allows users to select the points whose current values will be displayed in the report.
Steps
- Click the + icon in the Point Measurement Selection section.
- The Point Selection dialog box appears.
- Browse the available devices or expand the device tree.
- Select one or more points by checking the corresponding checkboxes.
- To include all available points, use the Select All option.
- Click Add Selected to add the selected points to the report.
Note
- Multiple devices and points can be selected simultaneously.
- The report displays the latest available value for each selected point.
CSV Metadata Columns
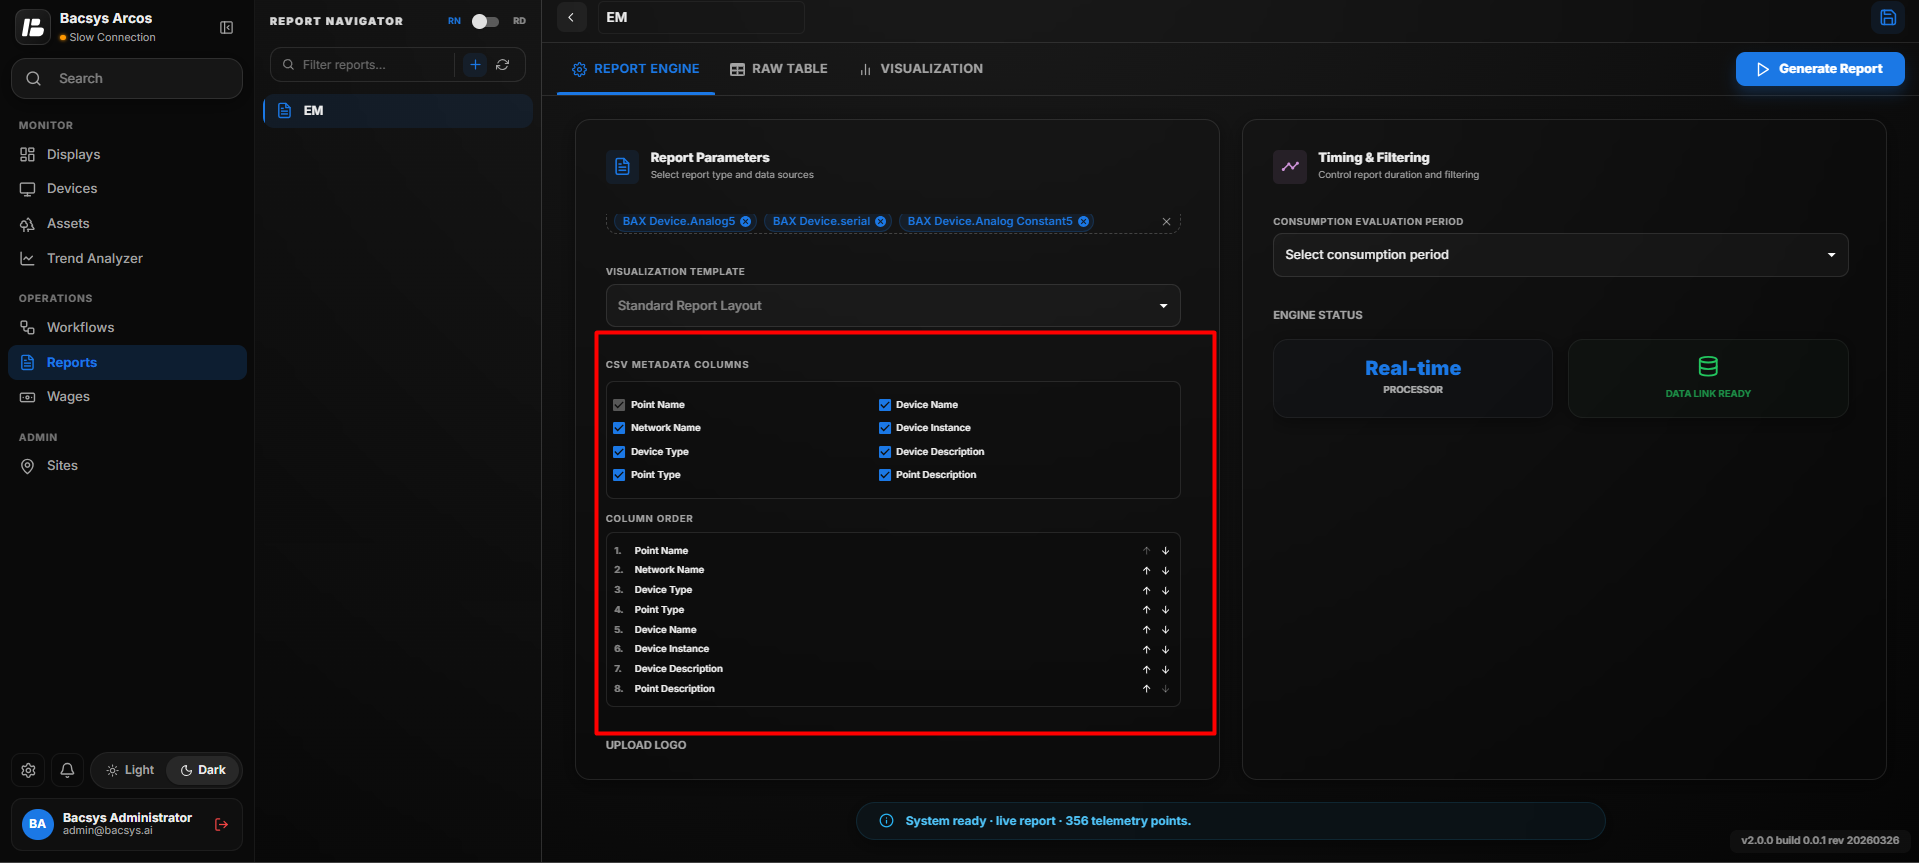
The CSV Metadata Columns section allows users to choose which information should be included in the exported report.
- Select the required checkboxes.
- Move the selected columns into the preferred display order.
- The exported report will include only the selected metadata fields.
Report Logo
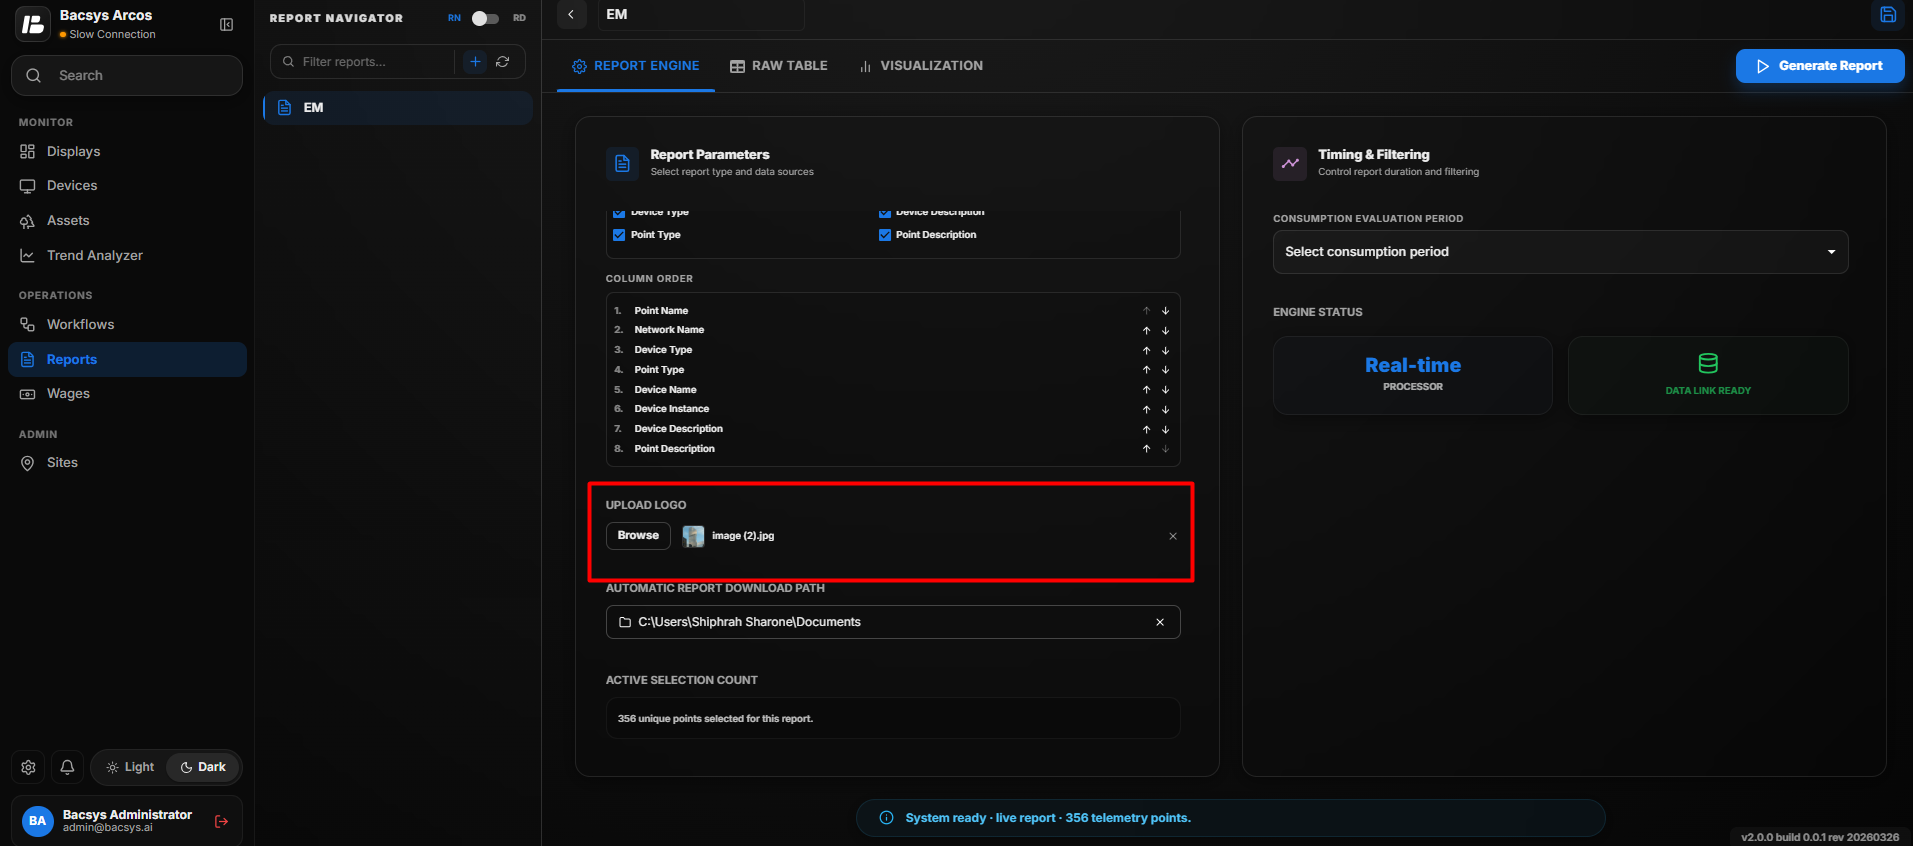
Users can include a custom company logo in the generated report.
- Click Upload Logo.
- Browse and select an image from your local system.
- The selected logo will appear in the generated report.
Automatic Report Download Path
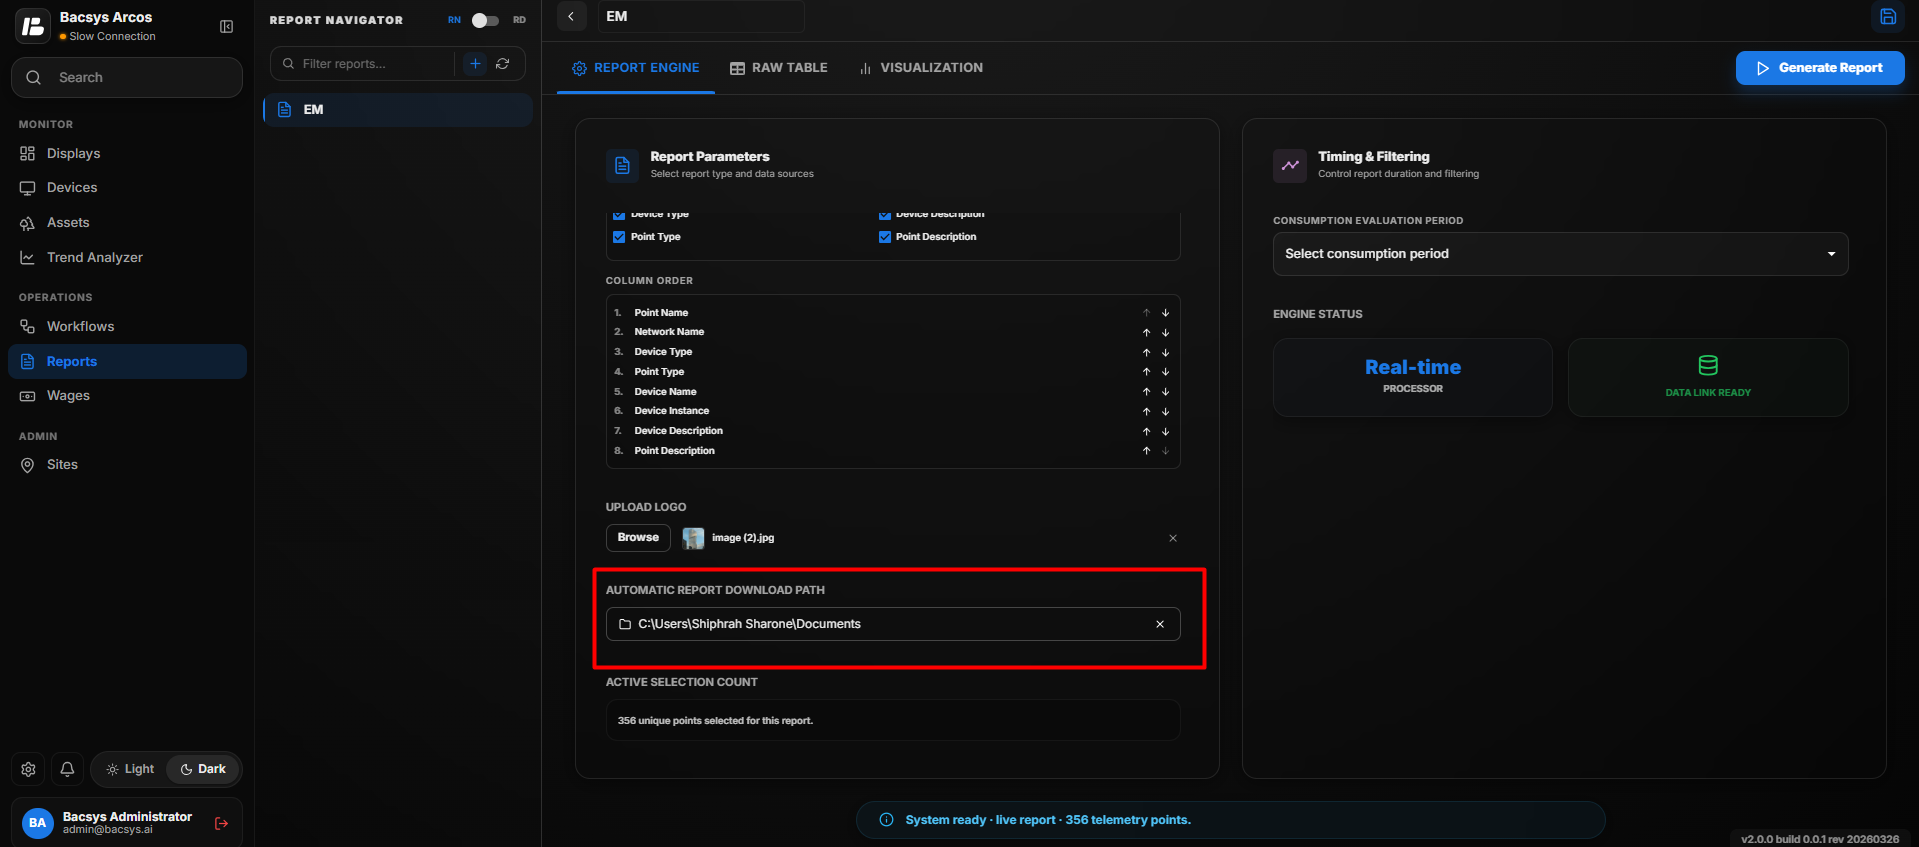 The Automatic Report Download Path specifies where generated reports will be saved automatically.
- Click Browse.
- Select the desired folder.
- Save the configuration.
All generated reports will be downloaded to the configured location.
Consumption Evaluation Period
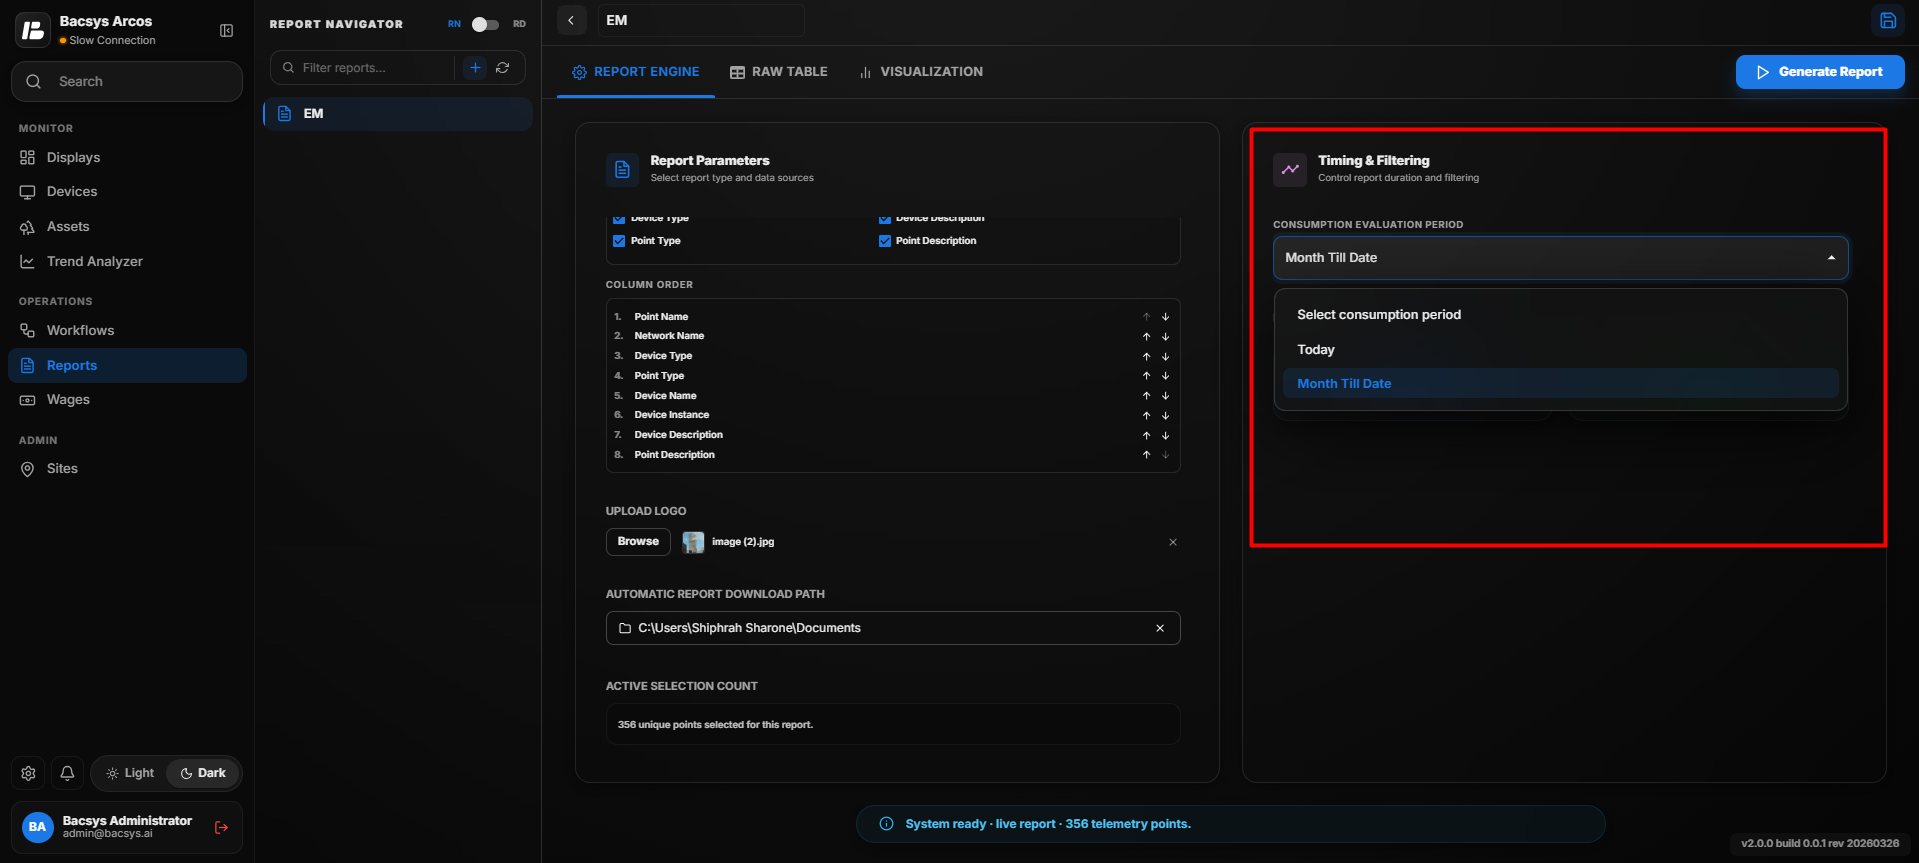
The Consumption Evaluation Period allows users to specify the time period for which the instantaneous consumption data should be generated.
Available options include:
- Today – Displays the consumption data recorded for the current day.
- Month to Date – Displays the consumption data from the beginning of the current month up to the current date.
Steps
- Select the required Consumption Evaluation Period.
- Choose either Today or Month to Date based on your reporting requirement.
- Verify the selected points and report configuration.
- Click Generate Report.
The system retrieves the consumption data for the selected evaluation period and generates the report.
Generate Report
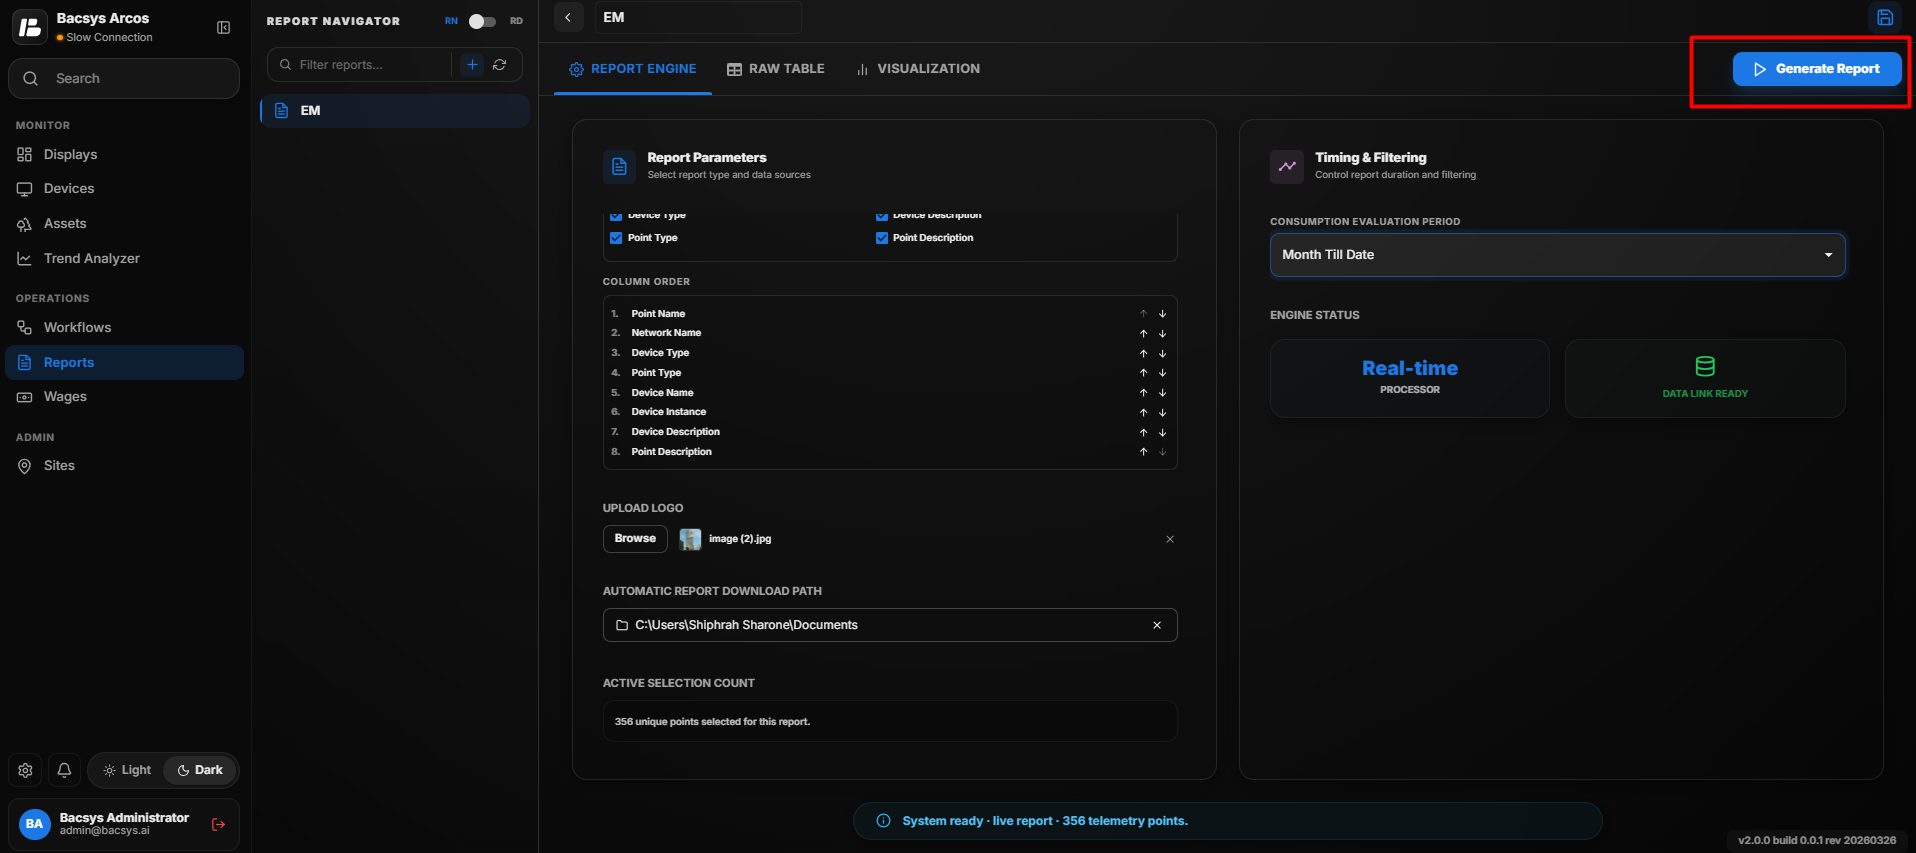
After completing the configuration:
- Verify the selected points.
- Click Generate Report.
The system retrieves the latest values for the selected points and generates the report.
Raw Table
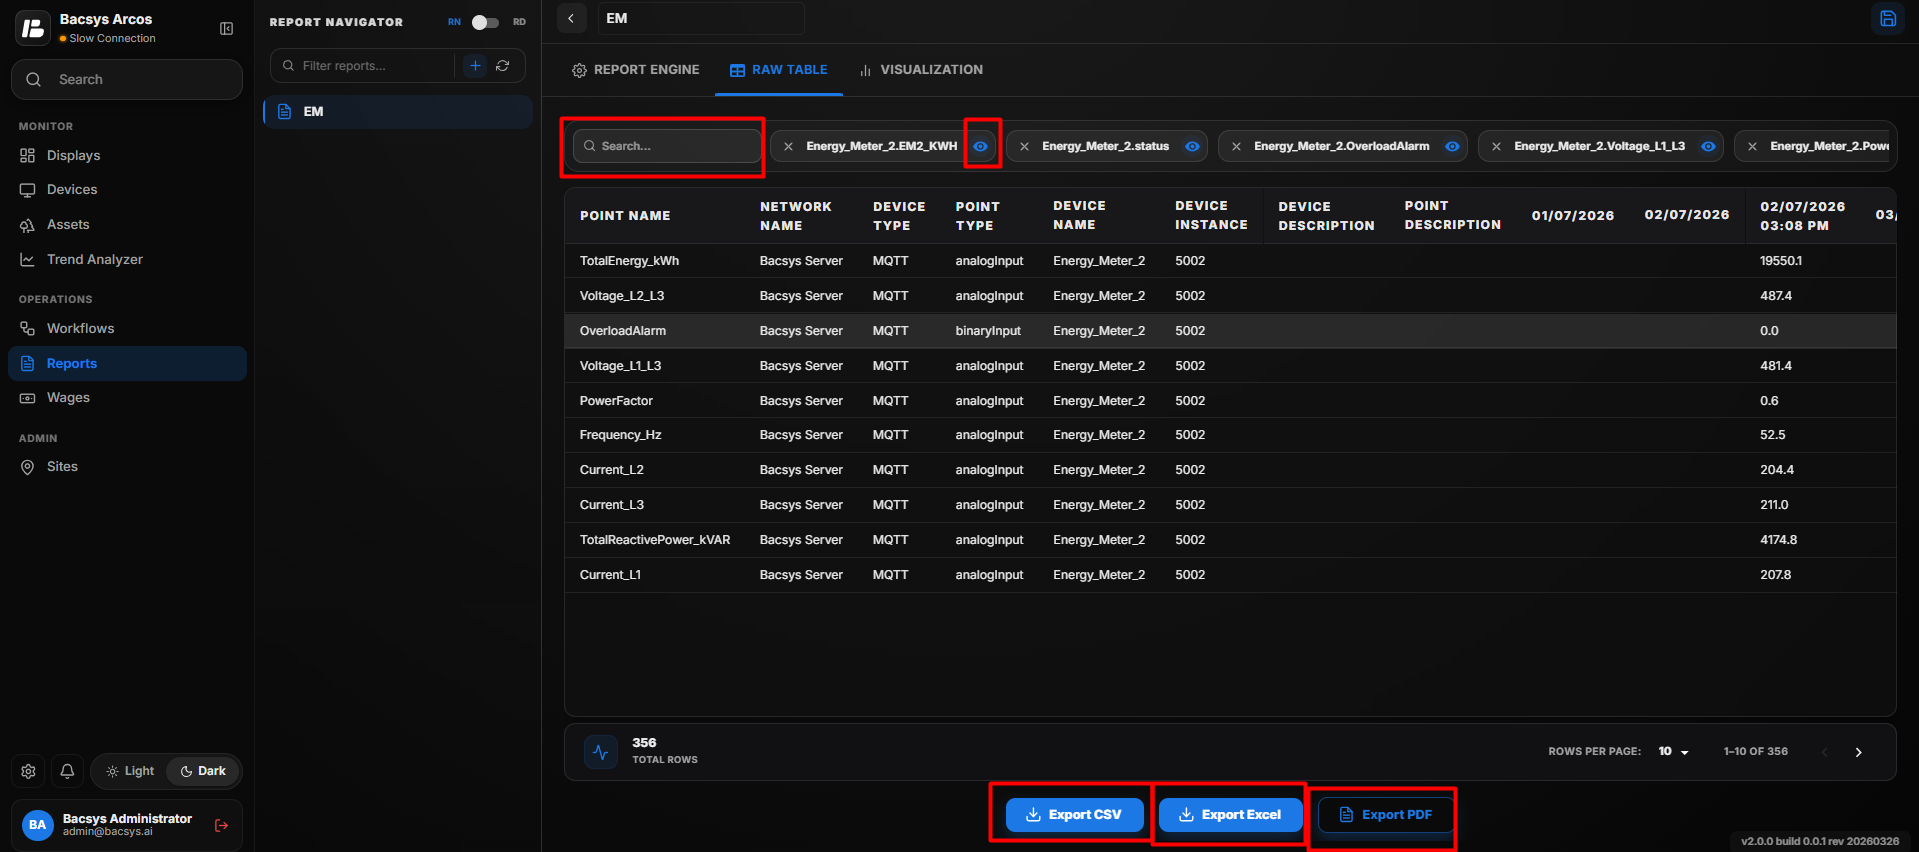
Instantaneous Report - Raw Table
The Raw Table displays the latest values of all selected points in a tabular format. It provides detailed information for each point, allowing users to review and analyze the current data.
The table includes the following information:
- Point Name
- Current Value
- Unit
- Timestamp
- Status
Features
- Search – Search for a specific point using the search box.
- Save Search – Save frequently used search criteria for quick access in future sessions.
- Show/Hide Points – Display or hide individual points from the table without removing them from the report.
- Export CSV – Export the displayed data in CSV format.
- Export Excel – Export the displayed data in Microsoft Excel format.
- Export PDF – Export the report in PDF format.
These features enable users to efficiently search, filter, manage, and export the instantaneous report data for further analysis and record keeping.
Visualization
Visualization
The Visualization tab displays the selected trend data graphically.
Available chart types include:
- Area Chart
- Bar Chart
- Line Chart
- Stacked Chart
Users can:
- Hover over any data point to view its exact value.
- Compare trends visually.
- Download the displayed graph as an image by clicking the Photo icon.
Matrix Report Configuration
The Matrix Report displays the selected point values in a structured matrix format, making it easy to compare multiple points and their corresponding values within a single report. Users can customize the report layout, export metadata, and download the generated report in multiple formats.
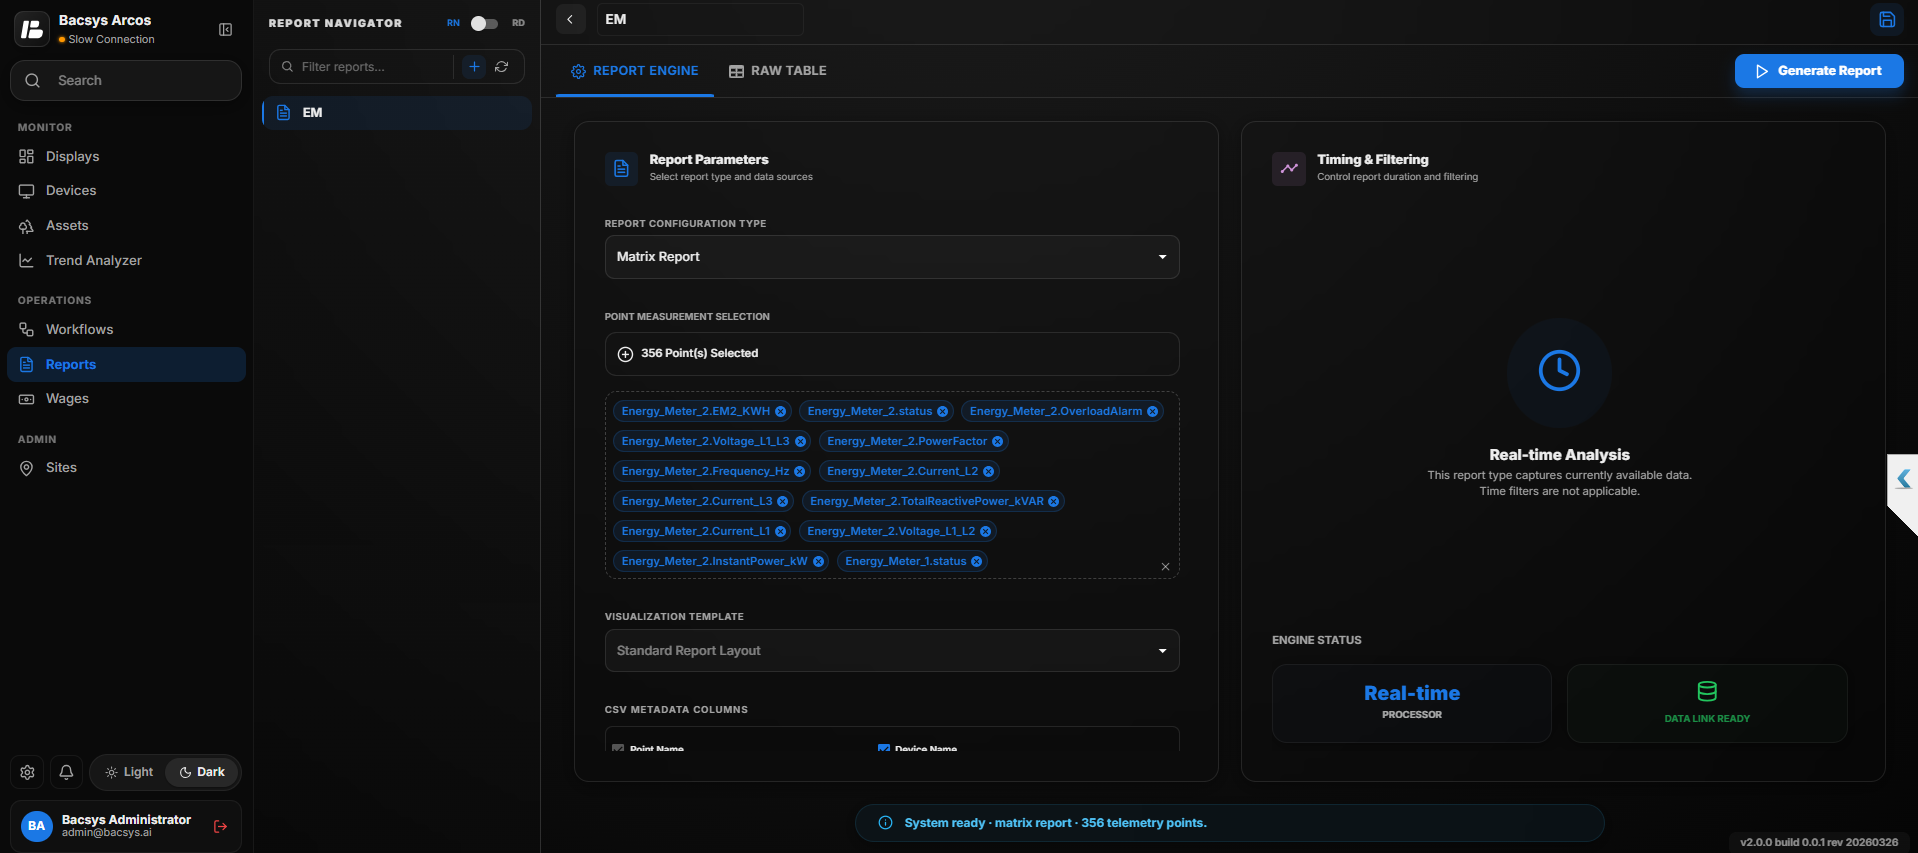
Matrix Report Configuration
Creating a Matrix Report
- Open the Report Navigator.
- Click the + icon to create a new report.
- Enter a report name as desired.
- From the Report Configuration Type dropdown, select Matrix Report.
Point Measurement Selection
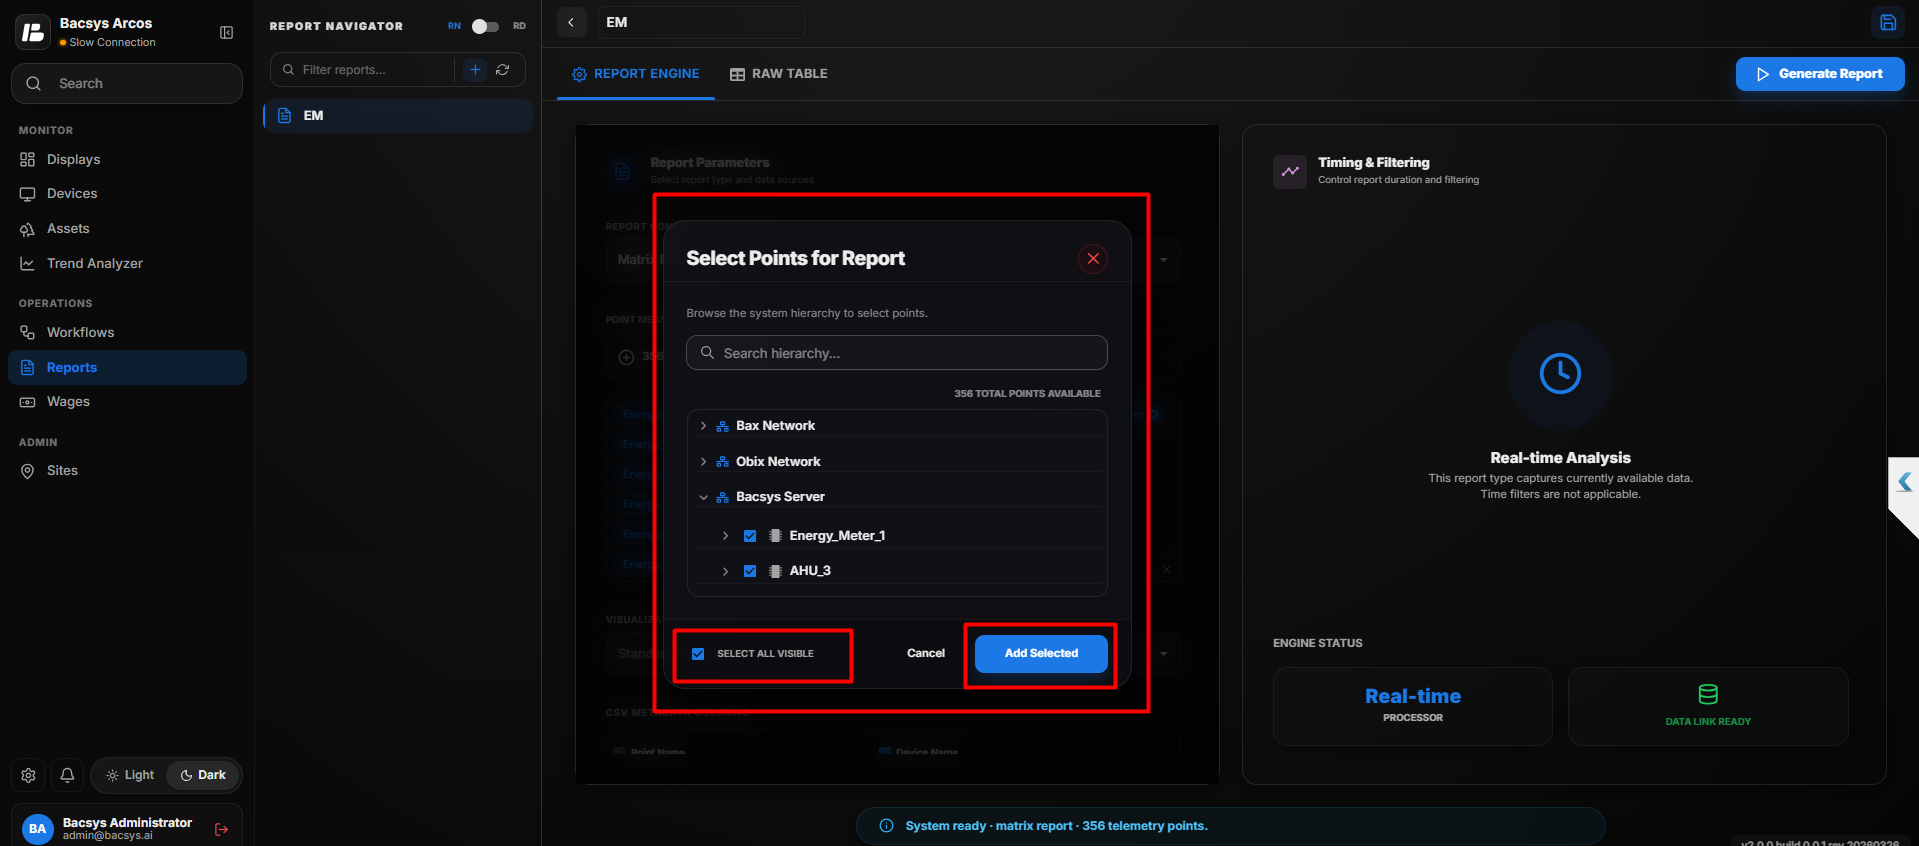
The Point Measurement Selection section allows users to select the points that will be included in the matrix report.
Steps
- Click the + icon in the Point Measurement Selection section.
- The Point Selection dialog box appears.
- Browse and expand the required device.
- Select one or more points by checking the corresponding checkboxes.
- To include all available points, use the Select All option.
- Click Add Selected to add the selected points to the report.
CSV Metadata Columns
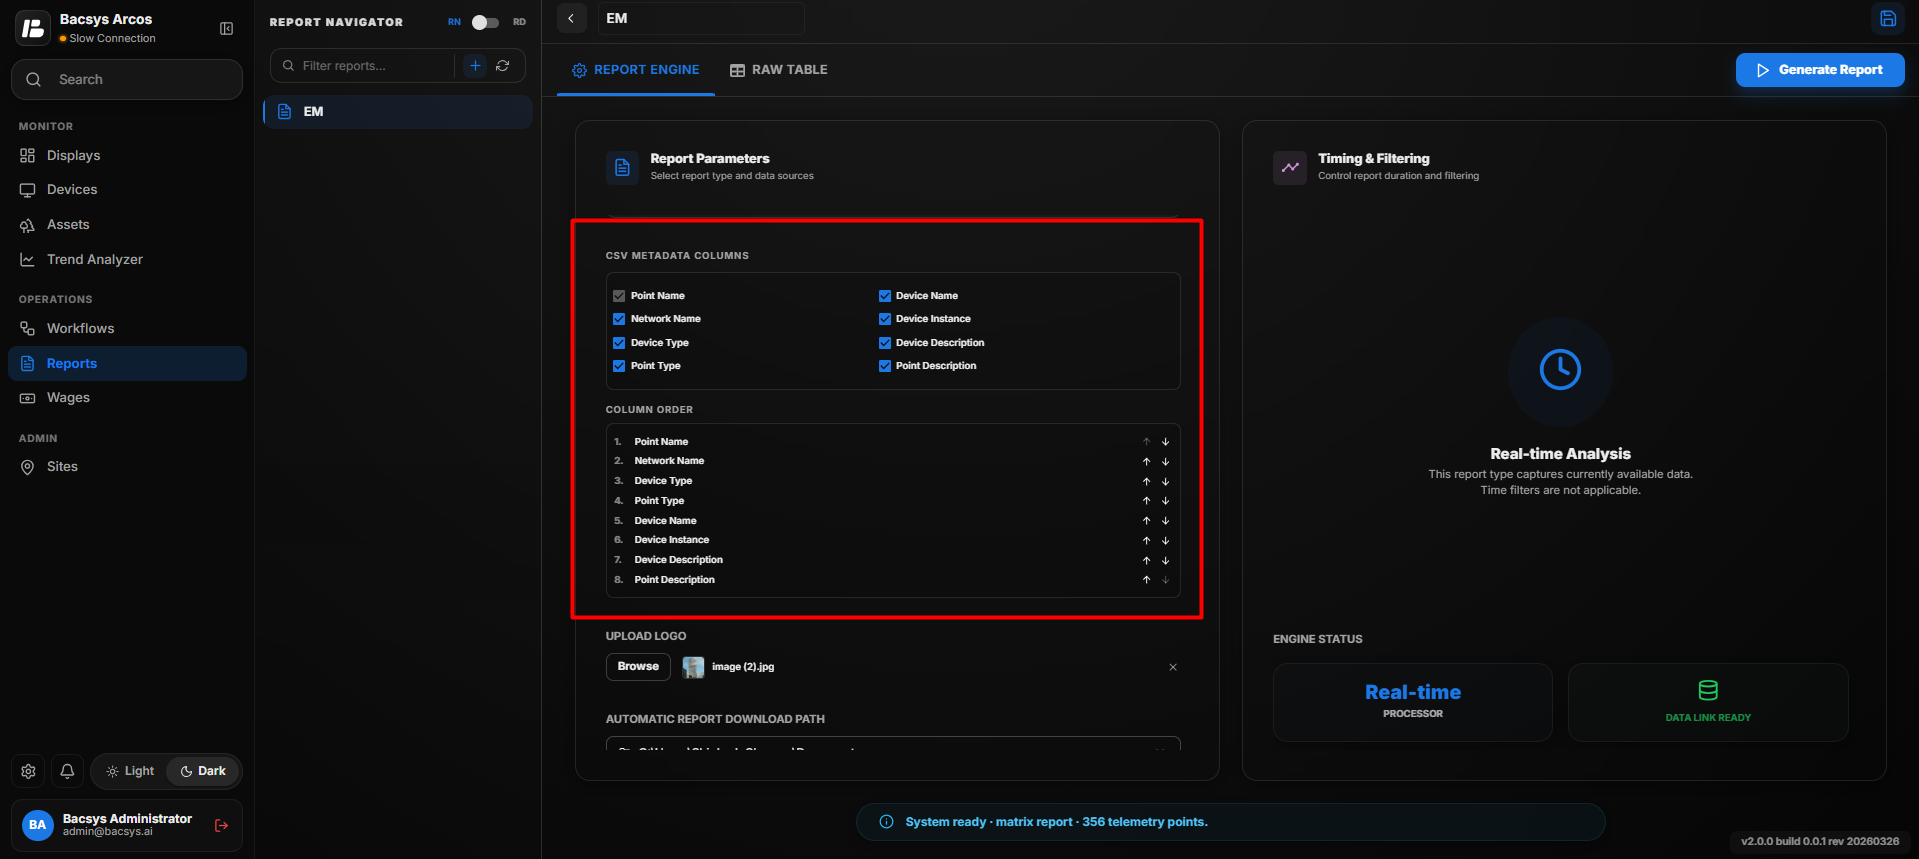
The CSV Metadata Columns section allows users to choose the metadata fields to be included in the exported report.
- Select the required metadata using the available checkboxes.
- Arrange the selected columns in the preferred order.
- Only the selected metadata fields will be included in the exported report.
Report Logo
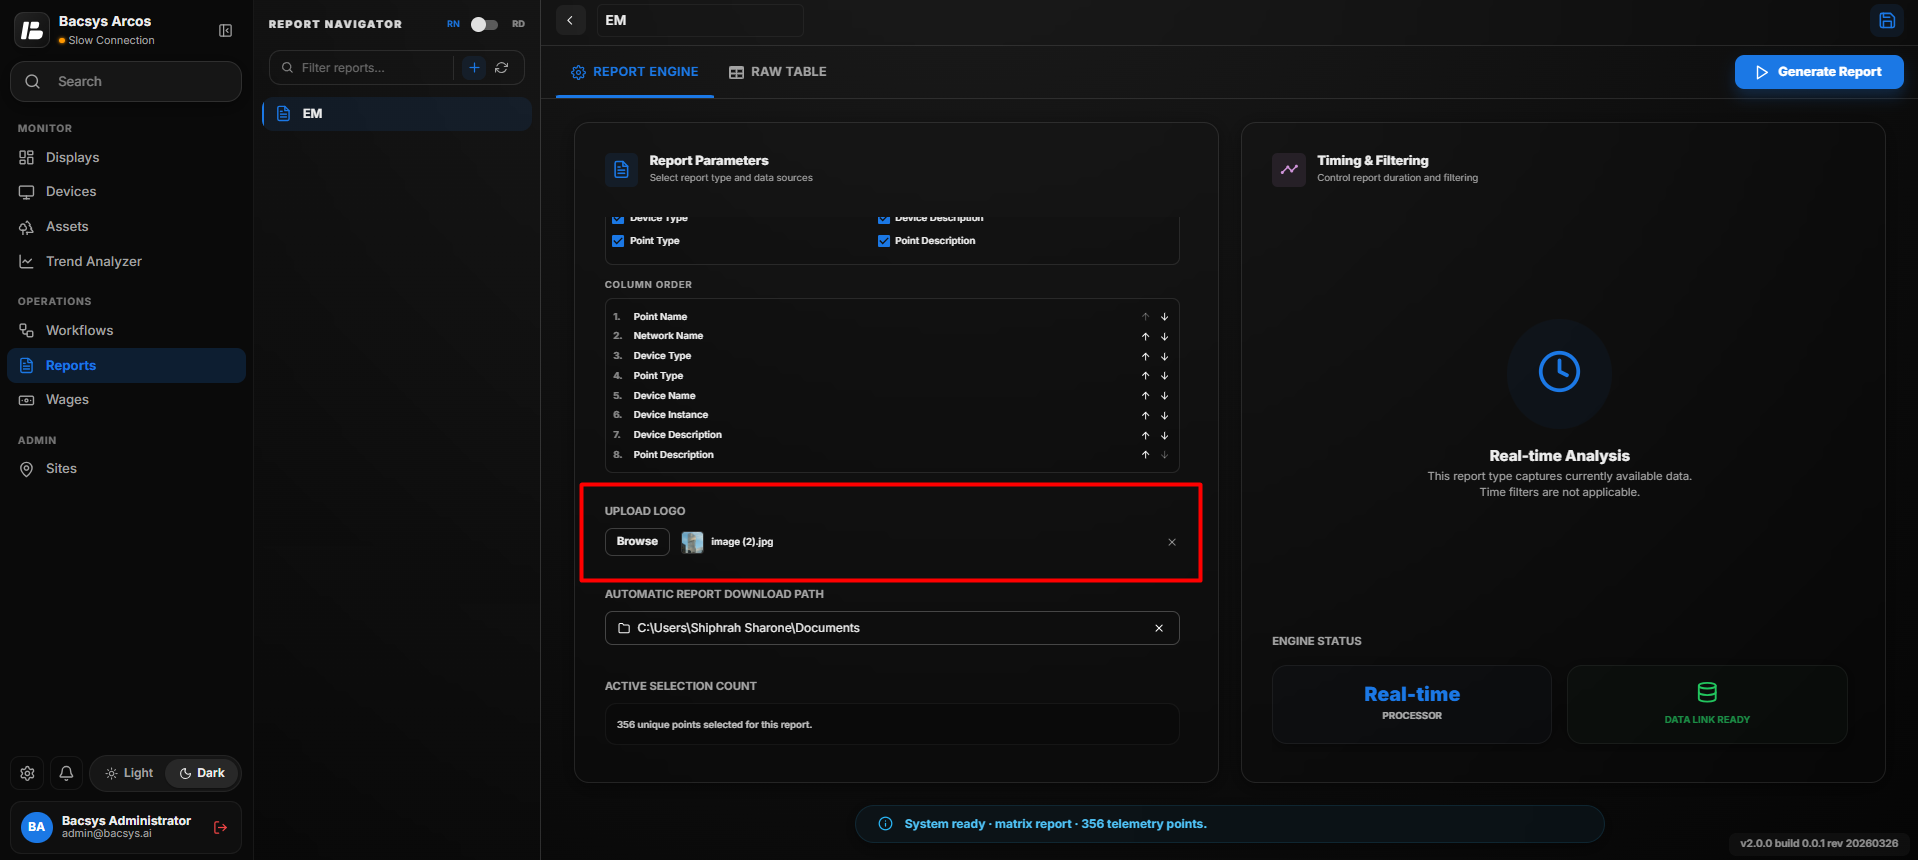
Users can include a custom logo in the generated report.
Steps
- Click Upload Logo.
- Browse and select an image from your local system.
- The selected logo will be displayed in the generated report.
Automatic Report Download Path
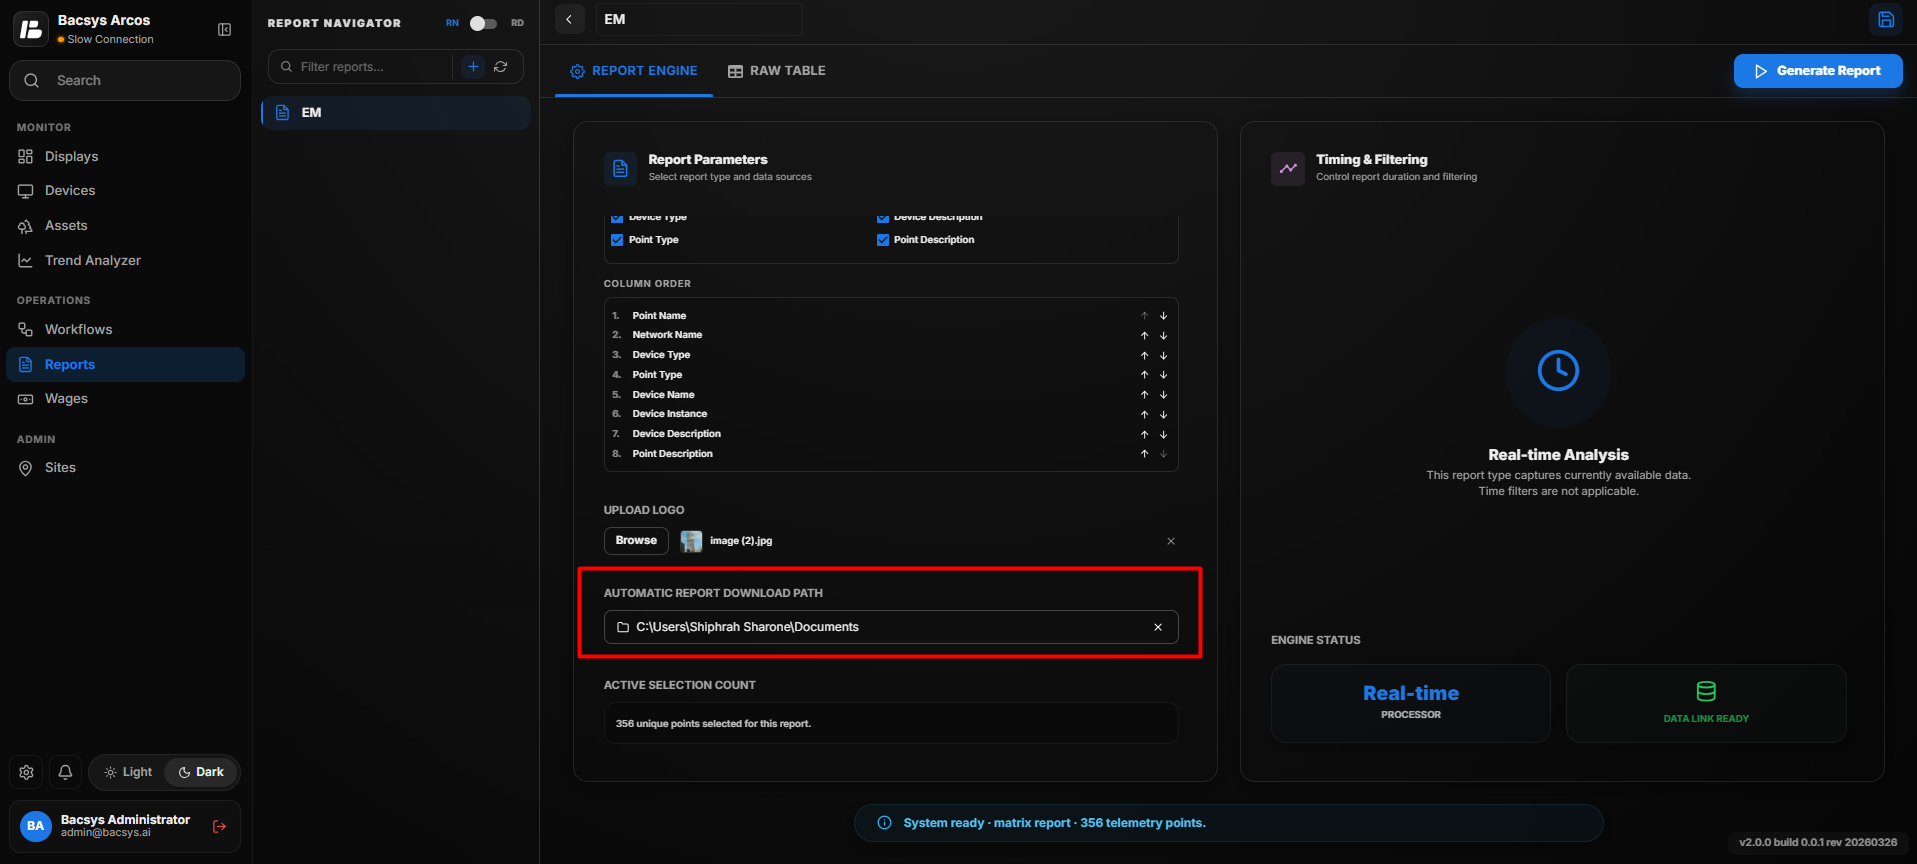
The Automatic Report Download Path specifies the folder where generated reports will be saved automatically.
Steps
- Click Browse.
- Select the desired download folder.
- Save the configuration.
- Click Generate Report to create the Matrix Report.
The generated report will automatically be saved to the configured download location.
Raw Table
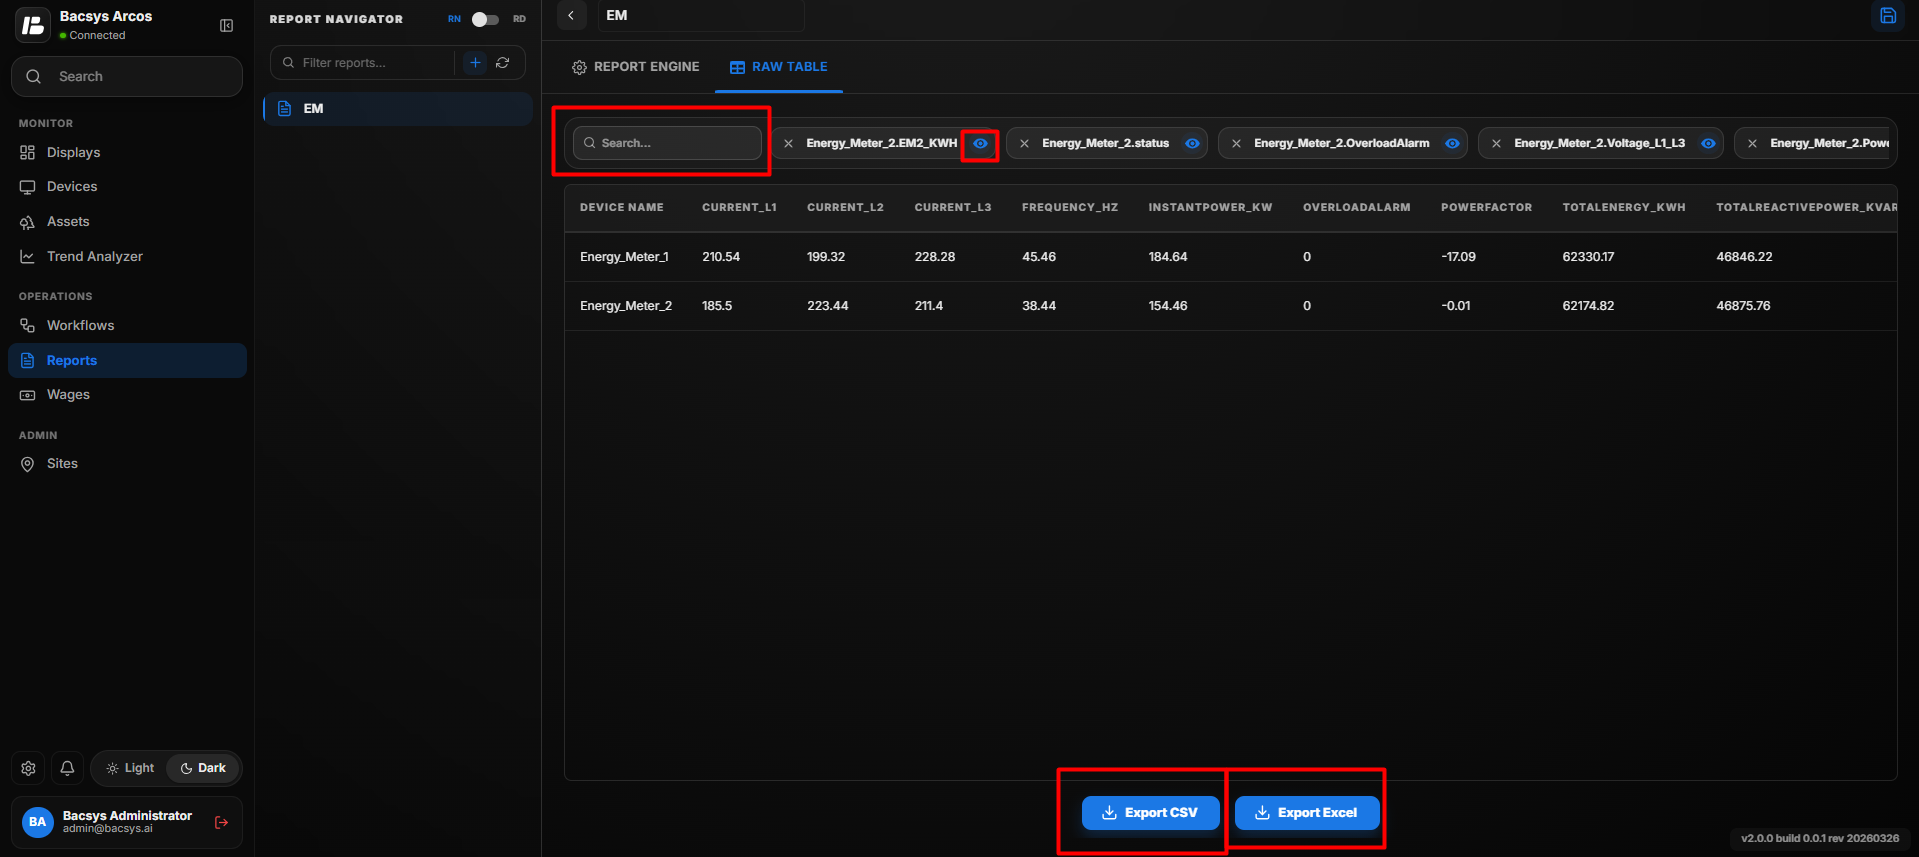
Matrix Report - Raw Table
The Raw Table displays the generated matrix data in a tabular format for easy viewing and analysis.
Features
- Search – Search for a specific point or value using the search box.
- Show/Hide Columns – Display or hide individual columns as required.
- Export CSV – Export the displayed data in CSV format.
- Export Excel – Export the displayed data in Microsoft Excel format.
These features allow users to quickly search, customize, and export the generated matrix report for further analysis and record keeping.
Consumption Report Configuration
The Consumption Report displays energy consumption data for selected points over a specified evaluation period. It enables users to analyze energy usage, generate detailed reports, and visualize consumption trends using multiple chart types.
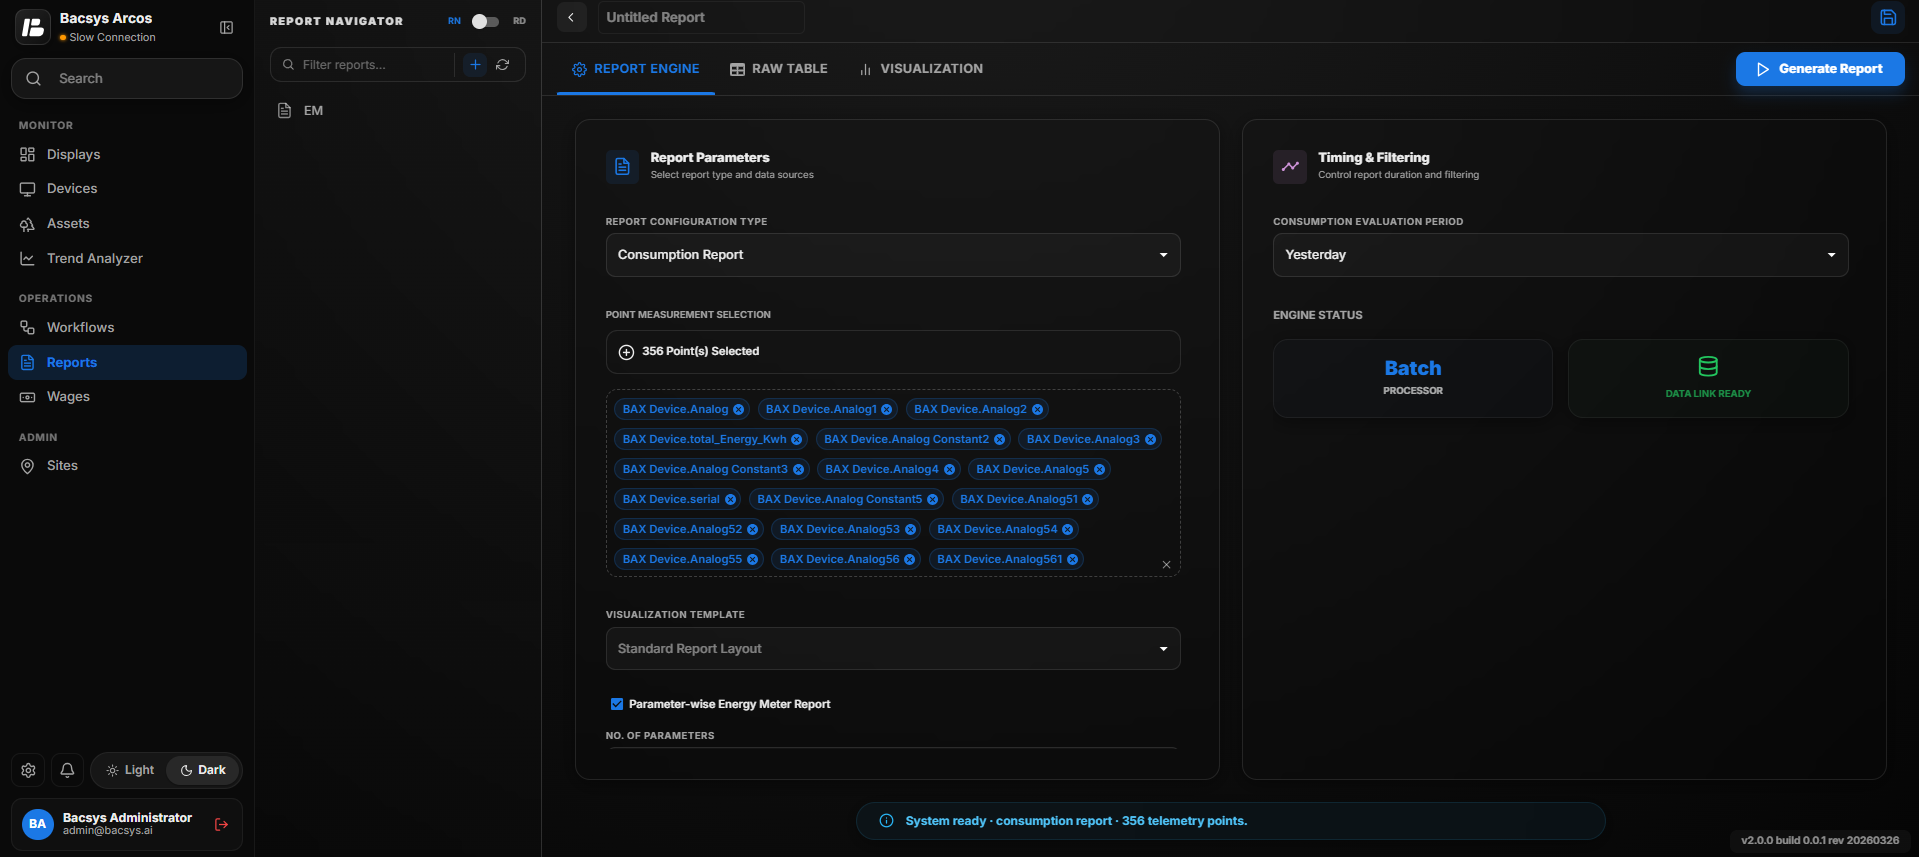
Consumption Report Configuration
Creating a Consumption Report
- Open the Report Navigator.
- Click the + icon to create a new report.
- Enter a report name as desired.
- From the Report Configuration Type dropdown, select Consumption Report.
Point Measurement Selection
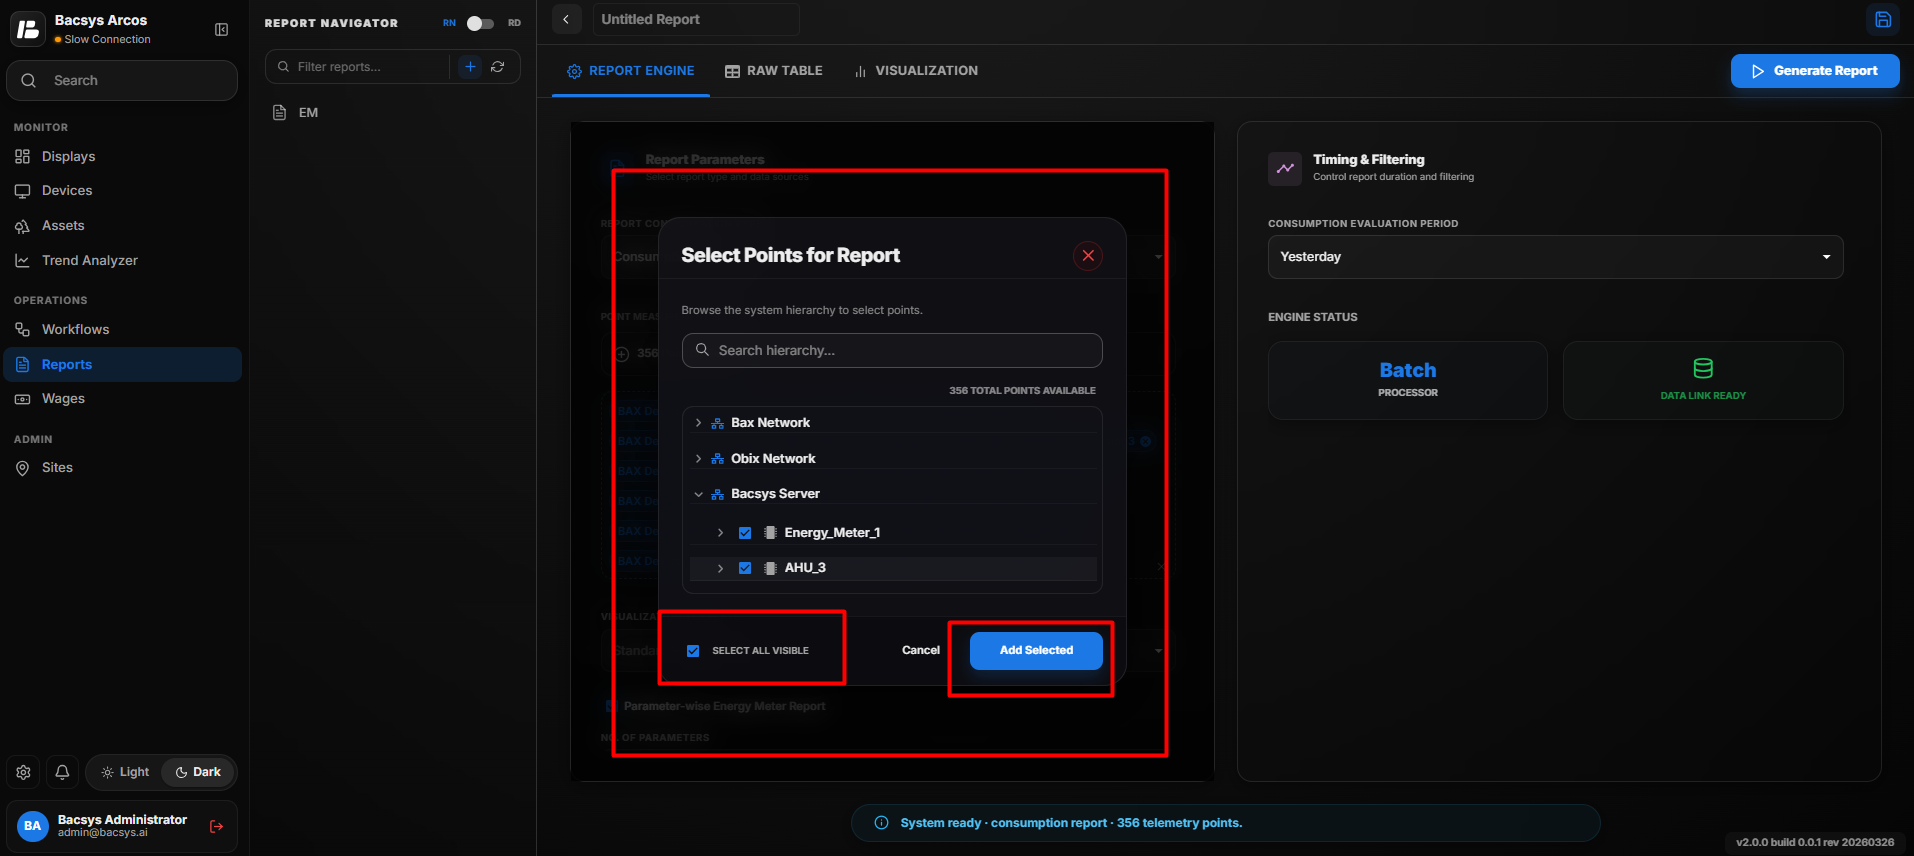
The Point Measurement Selection section allows users to select the energy meter points that will be included in the report.
Steps
- Click the + icon in the Point Measurement Selection section.
- Browse and expand the required device.
- Select one or more energy meter points.
- Click Add Selected to include the selected points in the report.
Parity Wise Energy Meter
If required, enable Parity Wise Energy Meter.
- Click Parity Wise Energy Meter.
- Enter the required unit (for example, kWh).
- A new row is added with the specified heading for energy consumption analysis.
Parameter Wise Energy Meter
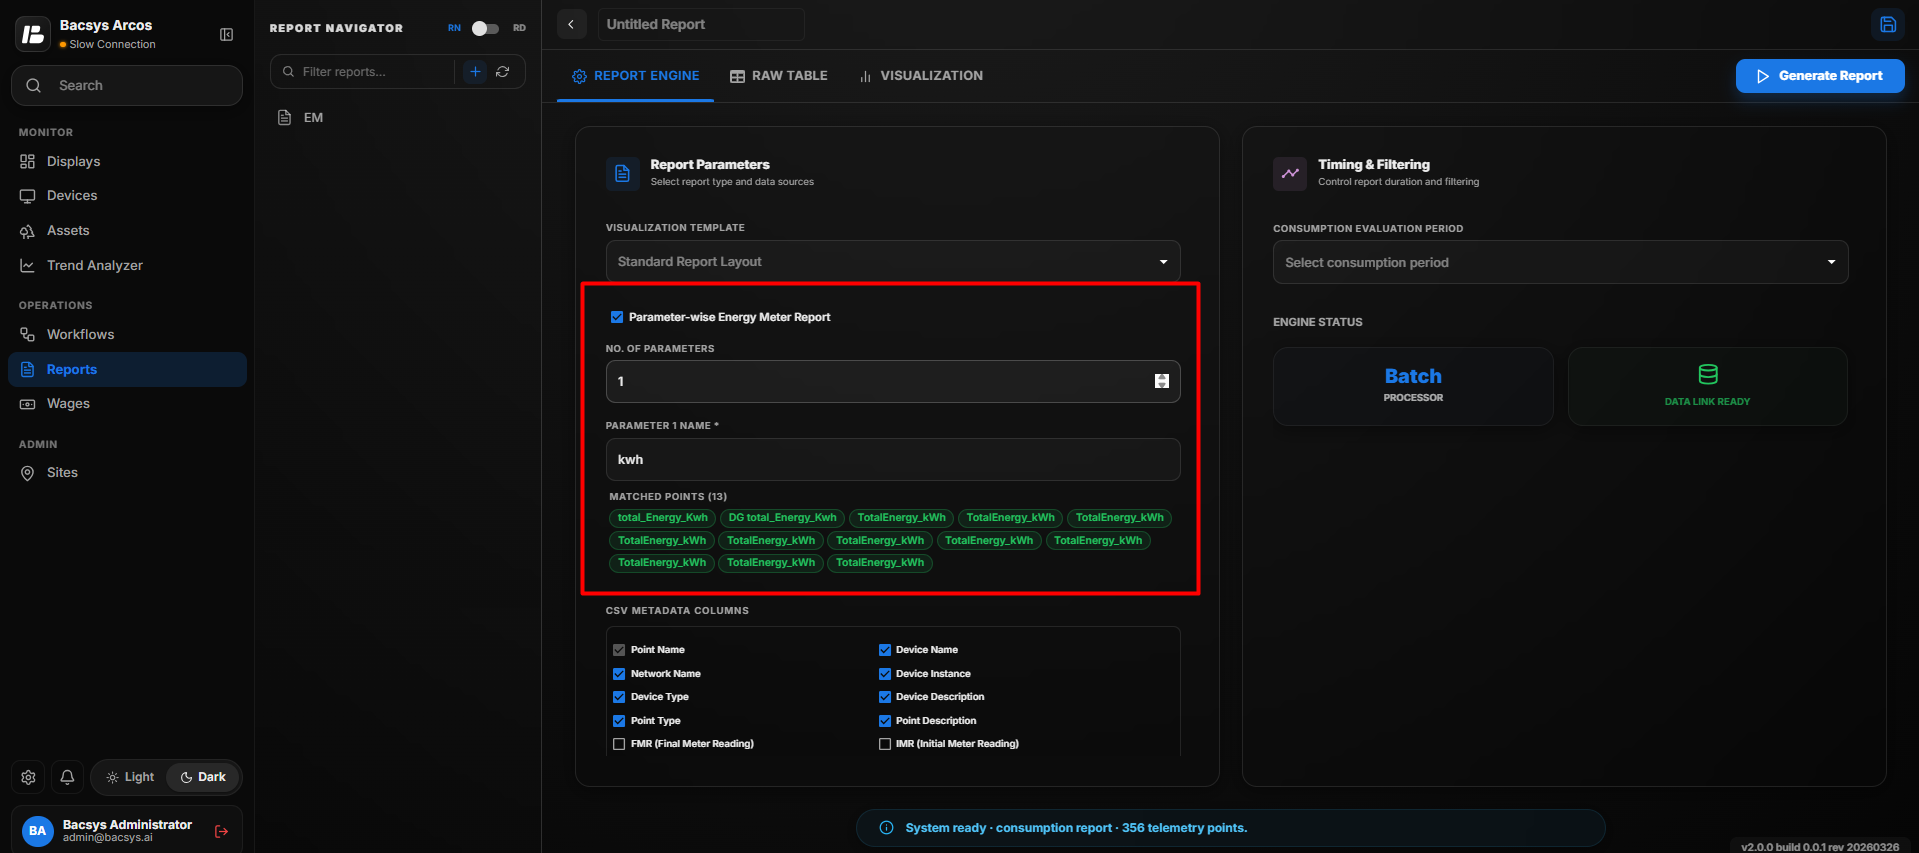
The Parameter Wise Energy Meter option allows users to organize selected energy meter points based on a specific parameter, such as kWh.
Steps
- Enable the Parameter Wise Energy Meter option.
- Enter the required parameter name (for example, kWh).
- Click Add.
The system creates a new row with the specified parameter as the heading. All selected points that contain the specified parameter are grouped under the corresponding heading, making it easier to analyze and compare energy consumption.
Note
- Users can add multiple parameter groups as required.
- Only points matching the specified parameter (for example, kWh) are displayed under the corresponding parameter heading.
- Additional parameters can be added in the same way to organize the report according to different energy measurements.
CSV Metadata Columns
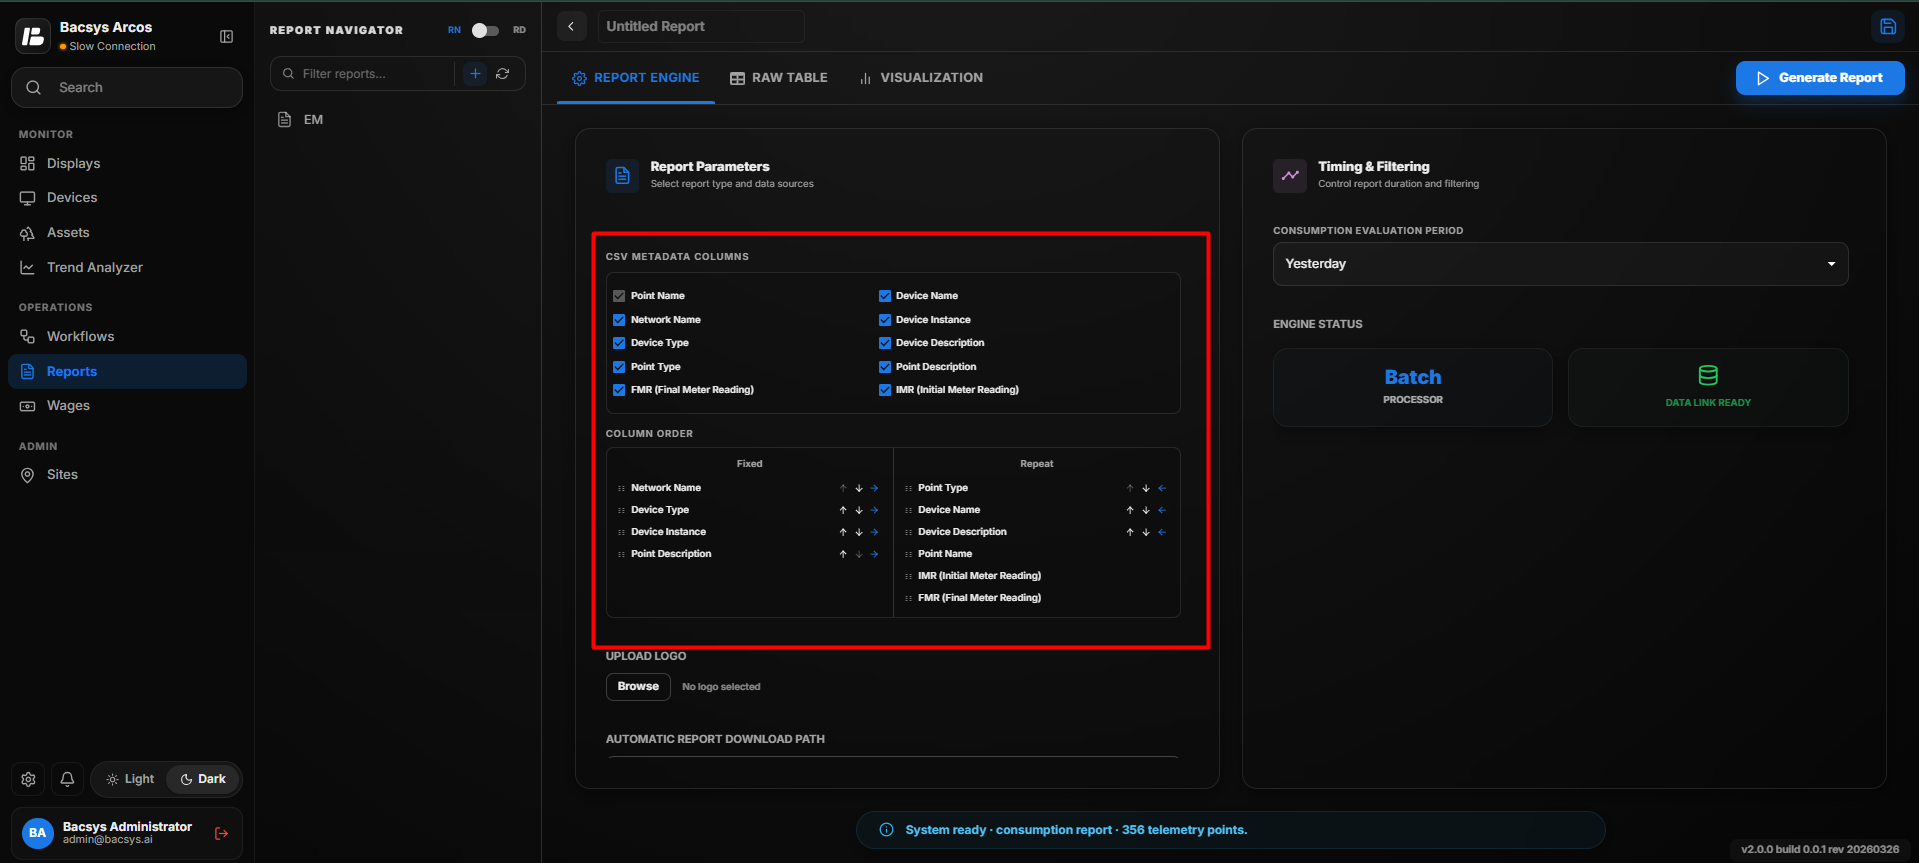
The CSV Metadata Columns section allows users to select the metadata fields that will be included in the exported report.
- Select the required metadata fields using the available checkboxes.
- Arrange the selected columns as required.
- Only the selected metadata fields will appear in the exported report.
Report Logo
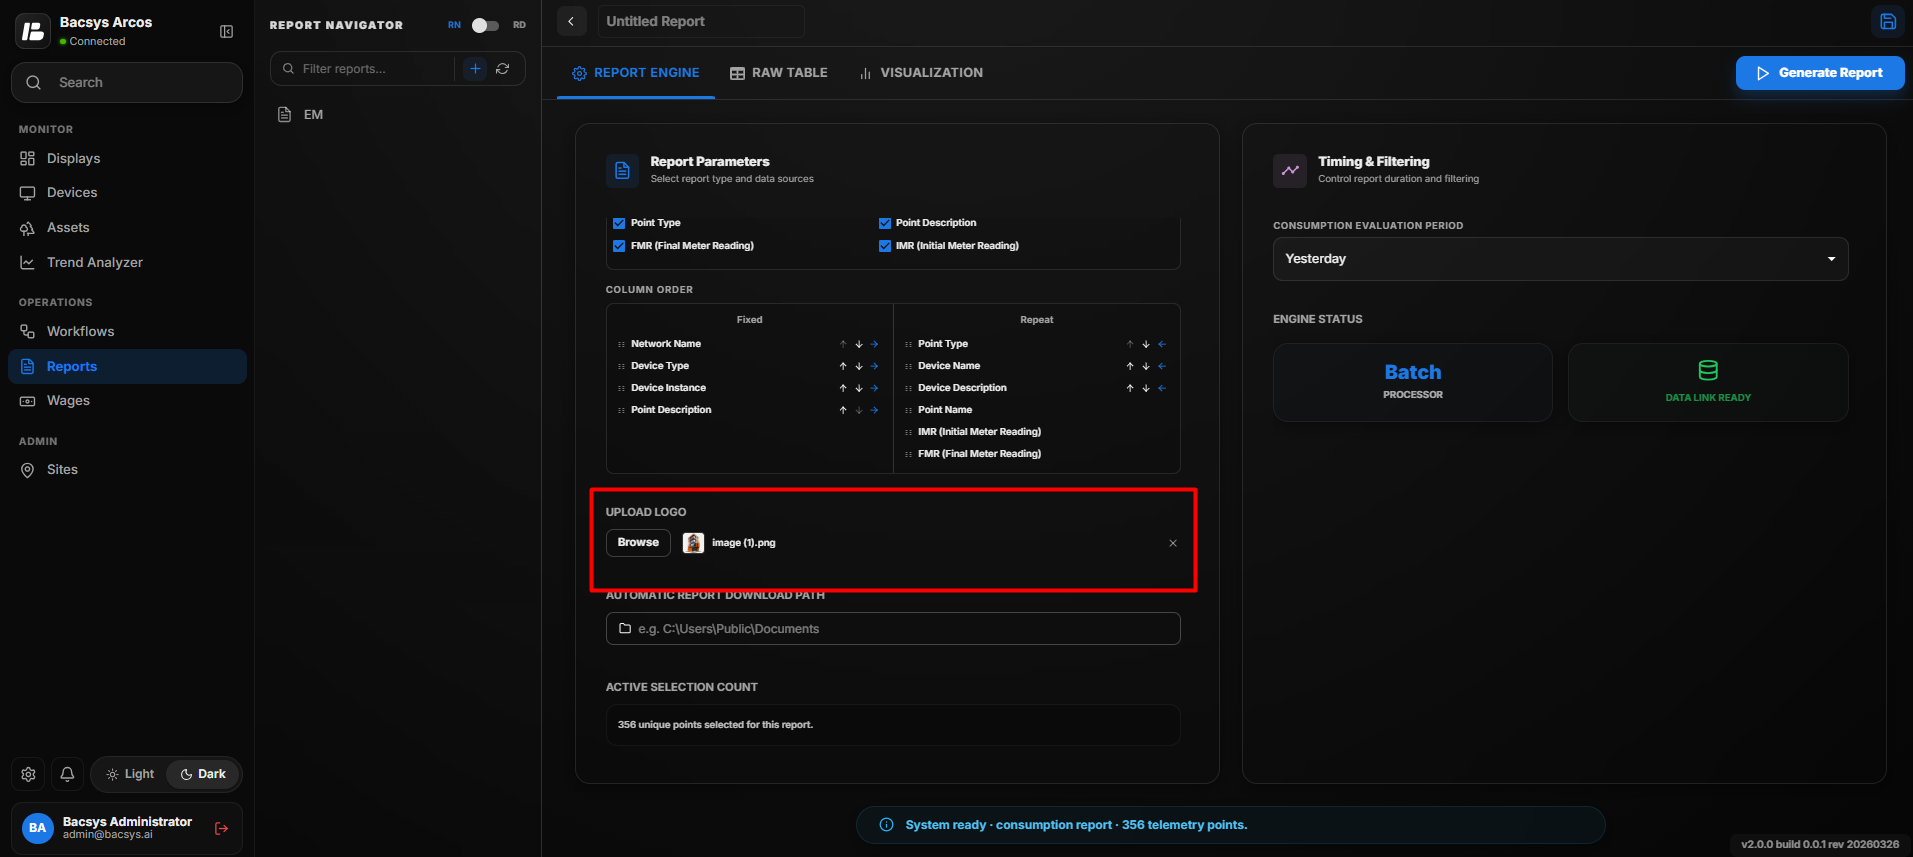
Users can include a custom company logo in the generated report.
- Click Upload Logo.
- Browse and select an image from the local system.
- The selected logo will be included in the generated report.
Automatic Report Download Path
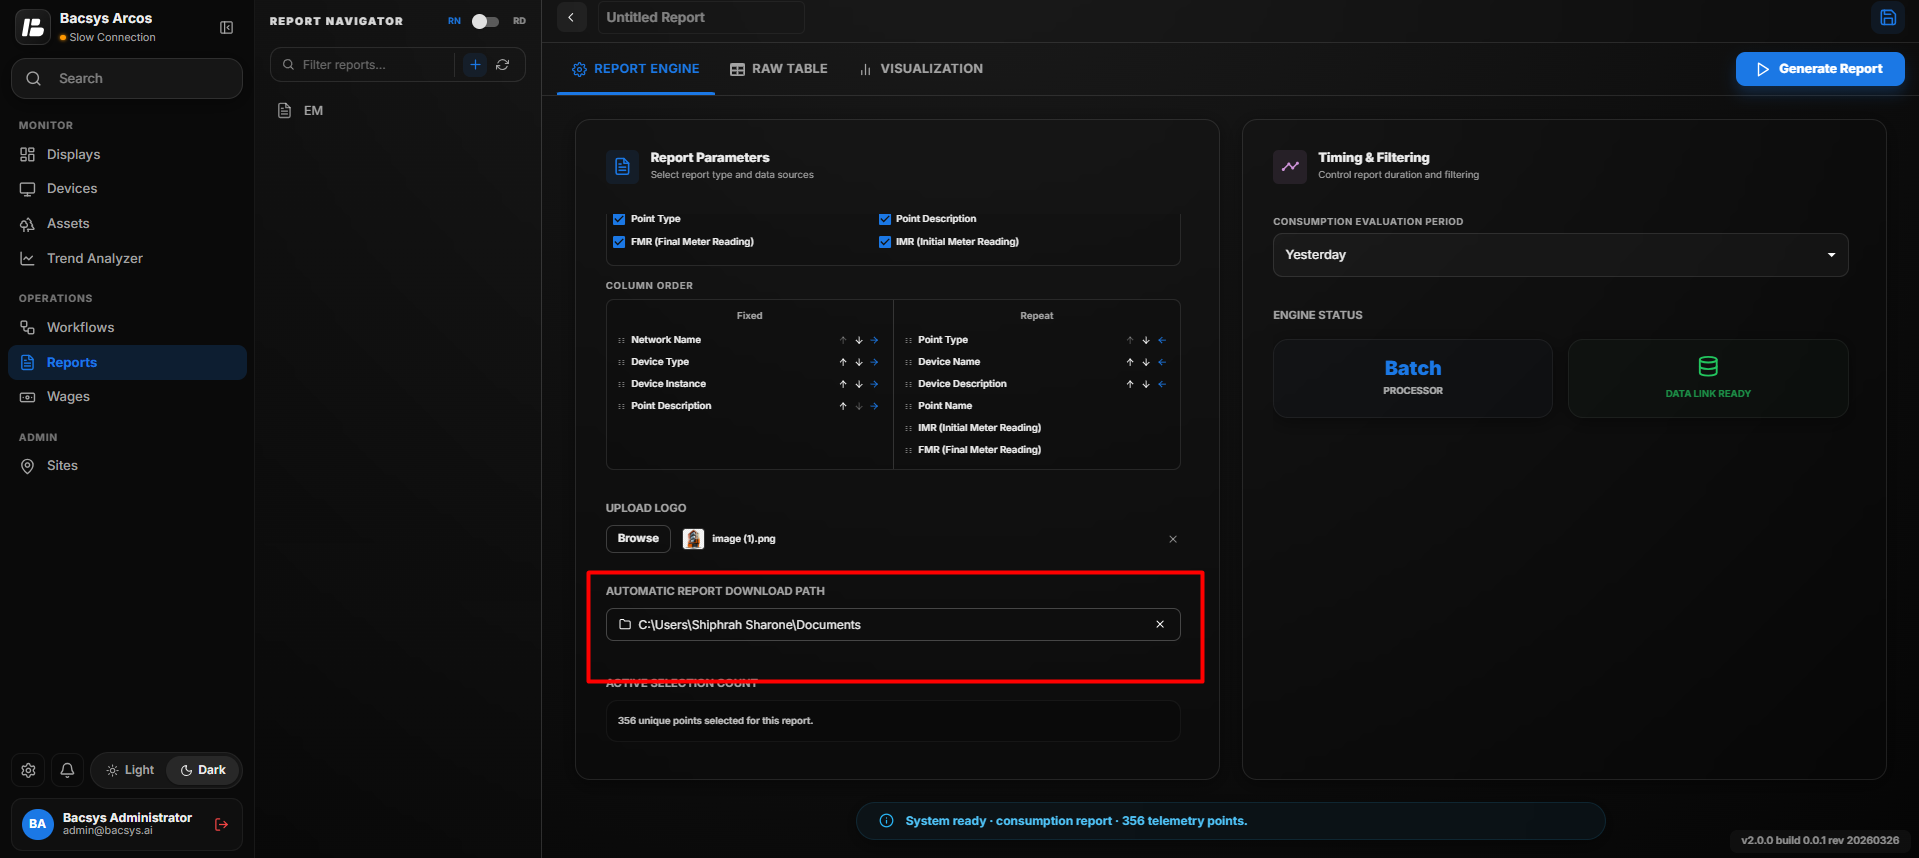
Specify the folder where generated reports will be saved automatically.
- Click Browse.
- Select the required download folder.
- Save the configuration.
Consumption Evaluation Period
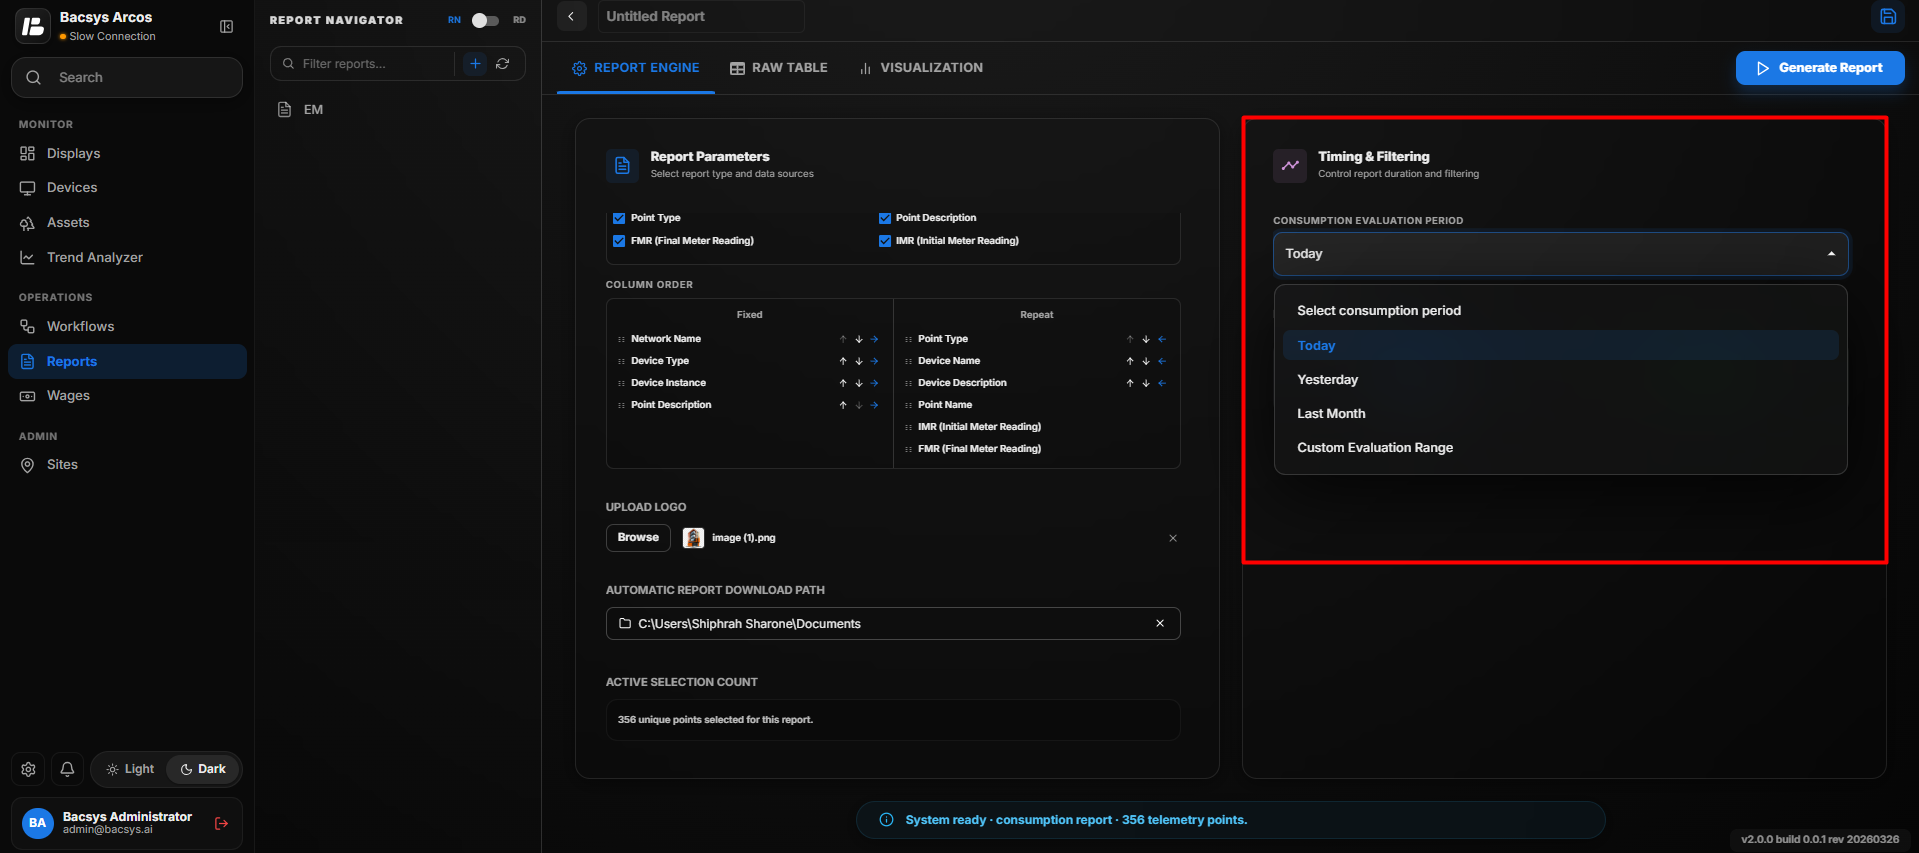
The Consumption Evaluation Period determines the time range used for calculating energy consumption.
Users can select one of the available evaluation periods according to their reporting requirements, including:
- Today
- Yesterday
- Last Month
- Month to Date
- Custom Evaluation Period
When Last Month is selected, additional options become available:
-
Daily Resolution – Displays daily consumption values for the selected month.
-
Monthly Aggregation – Displays the total monthly consumption.
-
Custom Evaluation Period – Allows users to specify a custom Start Date and End Date.
After selecting the required evaluation period, click Generate Report to generate the report.
Raw Table
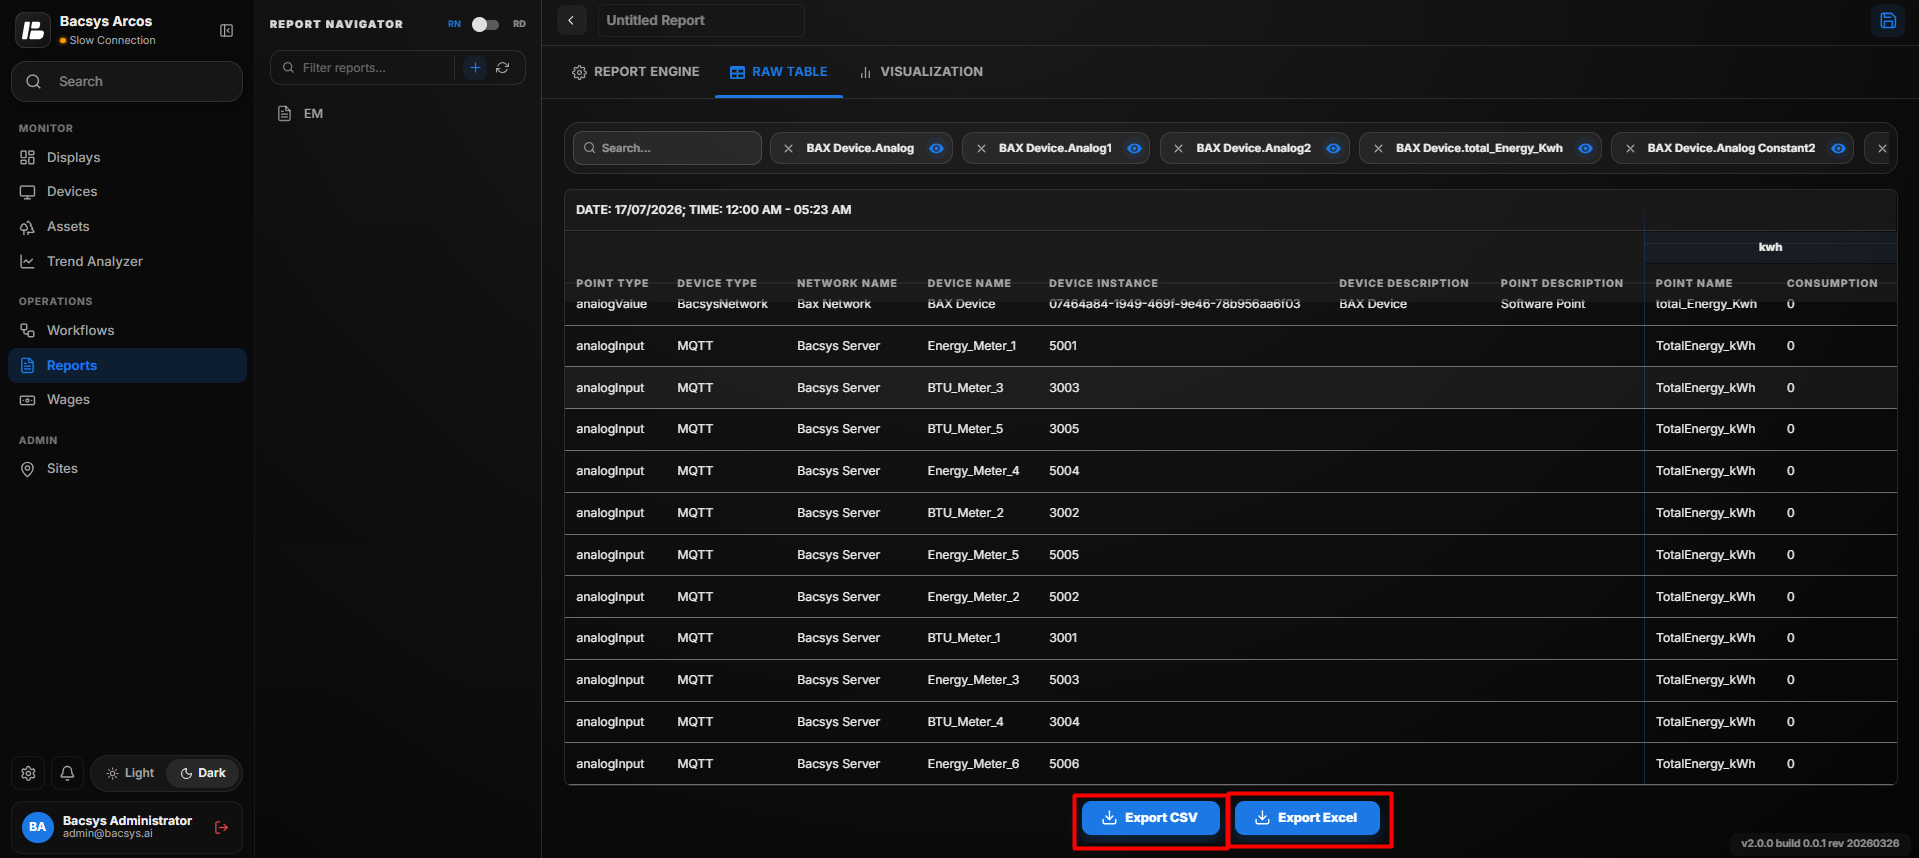
Consumption Report - Raw Table
The Raw Table displays the generated consumption data in a tabular format.
Features
- Search for specific records.
- Show or hide individual columns.
- Export the report in CSV format.
- Export the report in Excel format.
Visualization
Consumption Report - Visualization
The Visualization section provides graphical representations of the generated consumption data.
Available chart types include:
- Area Chart
- Bar Chart
- Line Chart
Users can switch between the available chart types to analyze energy consumption trends more effectively.