

Trend Analyzer
The Trend Analyzer module is used to analyze historical trend data collected from selected data points. It allows users to generate reports, visualize trends, compare values over a selected time period, and export the analysis results.
The Trend Analyzer provides the following features:
- Analyze historical trend data.
- Display trend information in tabular and graphical formats.
- View statistical summaries of selected data points.
- Generate different chart visualizations.
- Export analyzed data using predefined templates.
Accessing the Trend Analyzer
To access the Trend Analyzer module:
- Click the Trend Analyzer icon from the main menu.
- Click the > icon to expand the Trend Analyzer Navigator.
- Click the < icon to collapse the Trend Analyzer Navigator.
- The navigator displays all previously saved Trend Analyses.
Creating a New Trend Analysis
A new Trend Analysis is created automatically when the Trend Analyzer module is opened. You can edit the existing analysis or create a new one.
To create a new Trend Analysis:
- Click the + icon beside the Trend Analyzer Navigator.
- A new Trend Analysis is created.
- Click the Untitled Report Template field.
- Enter a name for the Trend Analysis.
Example:
Building Energy Analysis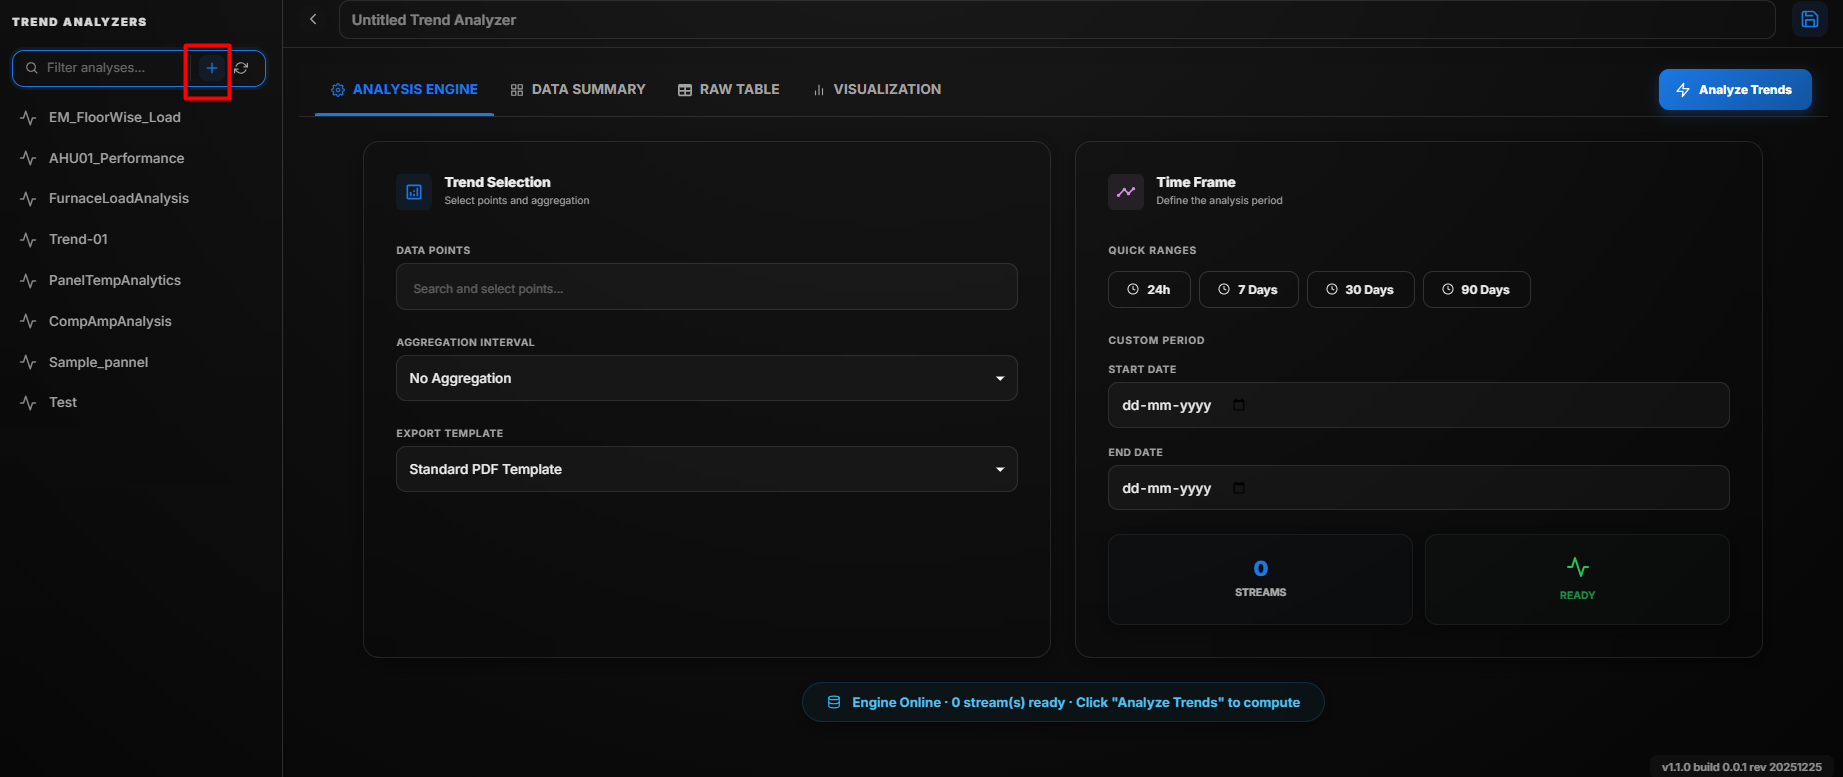
Create New Trend Analyzer
Configure
The Configure tab is used to define the data source, analysis period, and report settings before generating the trend analysis.
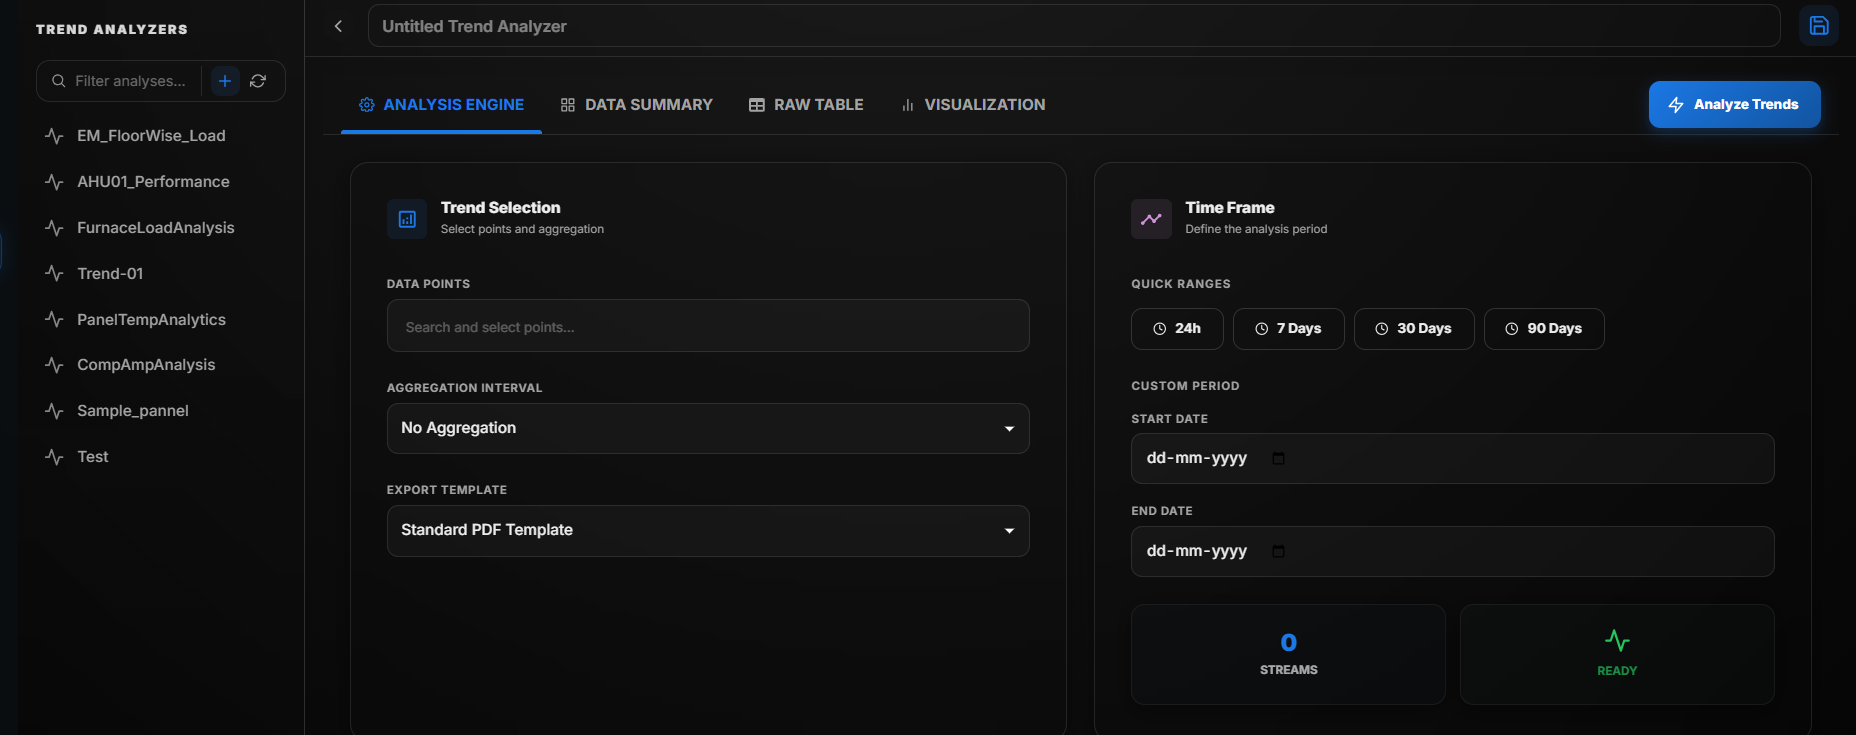
Trend Analyzer - Configure Tab
Configure the Trend Analysis as follows:
- Select one or more Data Points that need to be analyzed.
- Select the required Aggregation Interval to group the trend data.
- Choose an Export Template for exporting the generated report.
- Select a predefined Quick Range such as Today, Yesterday, Last 7 Days, Last 30 Days, This Month, or Last Month.
- Alternatively, specify a Custom Period by selecting the required Start Date, End Date, and time.
- Click Analyze Trend to generate the analysis.
Once the analysis is complete, the following sections are displayed:
- Data Summary
- Raw Table
- Visualization
| Field | Description |
|---|---|
| Data Points | Select one or more trend points for analysis. |
| Aggregation Interval | Specifies how the collected data is grouped before analysis. |
| Export Template | Selects the template used when exporting the analysis report. |
| Quick Range | Selects a predefined date range for analysis. |
| Custom Period | Allows users to specify a custom start and end date. |
| Analyze Trend | Generates the trend analysis using the selected configuration. |
Data Summary
The Data Summary section provides statistical information for the selected trend point within the selected time period.
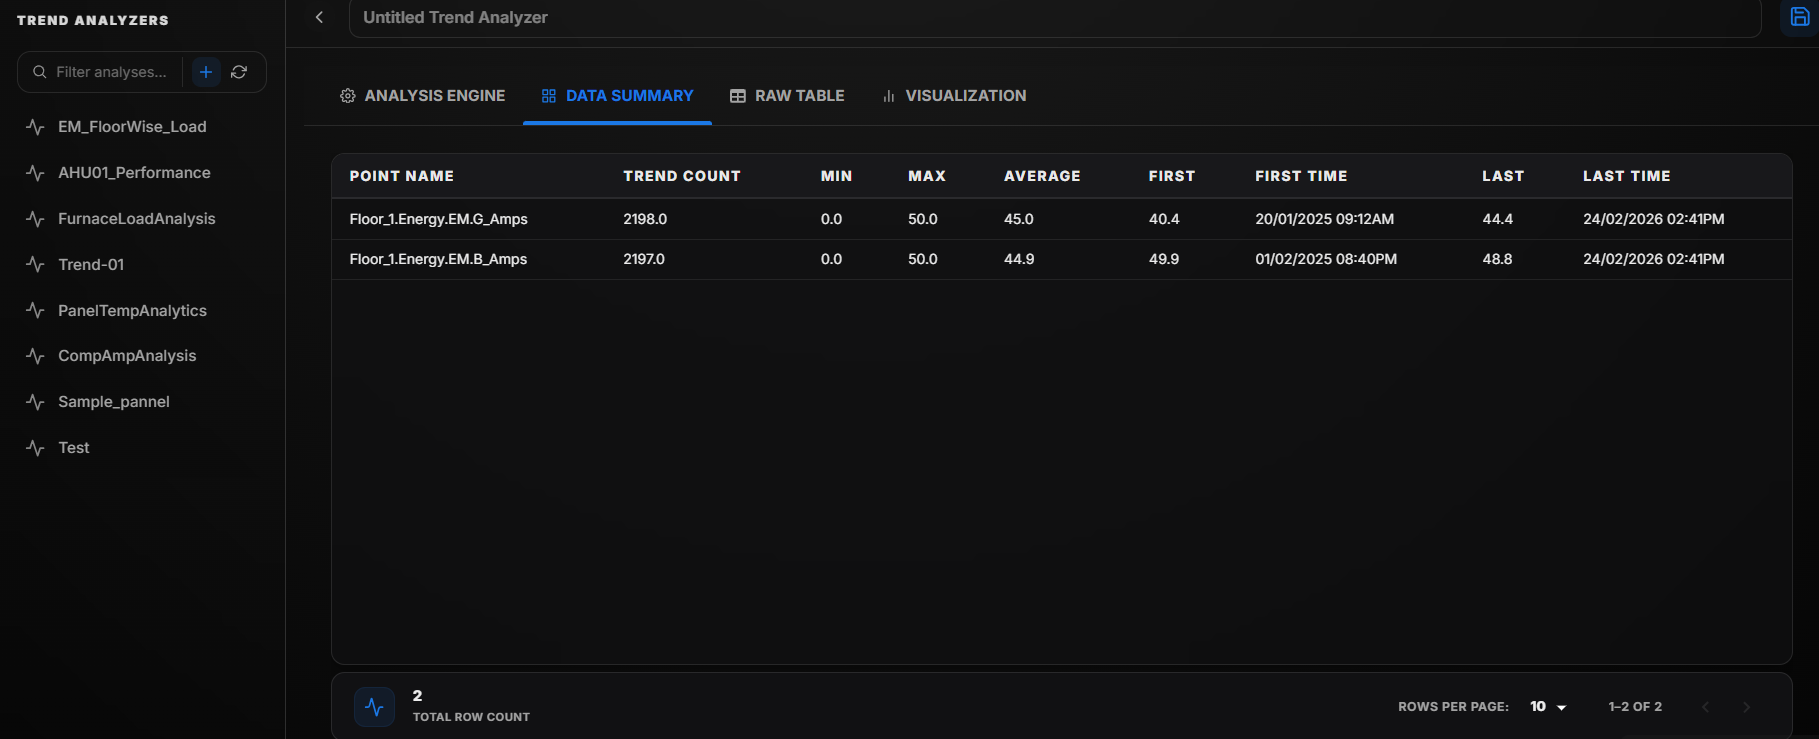
Data Summary
The Data Summary displays the following information:
| Field | Description |
|---|---|
| Point Name | Displays the selected trend point. |
| Trend Count | Displays the total number of trend records available within the selected period. |
| Minimum | Displays the lowest recorded value. |
| Maximum | Displays the highest recorded value. |
| Average | Displays the average value of all recorded samples. |
| First Value | Displays the first recorded value. |
| First Time | Displays the timestamp of the first recorded value. |
| Last Value | Displays the most recent recorded value. |
| Last Time | Displays the timestamp of the most recent recorded value. |
Raw Table
The Raw Table displays every recorded trend entry without aggregation.
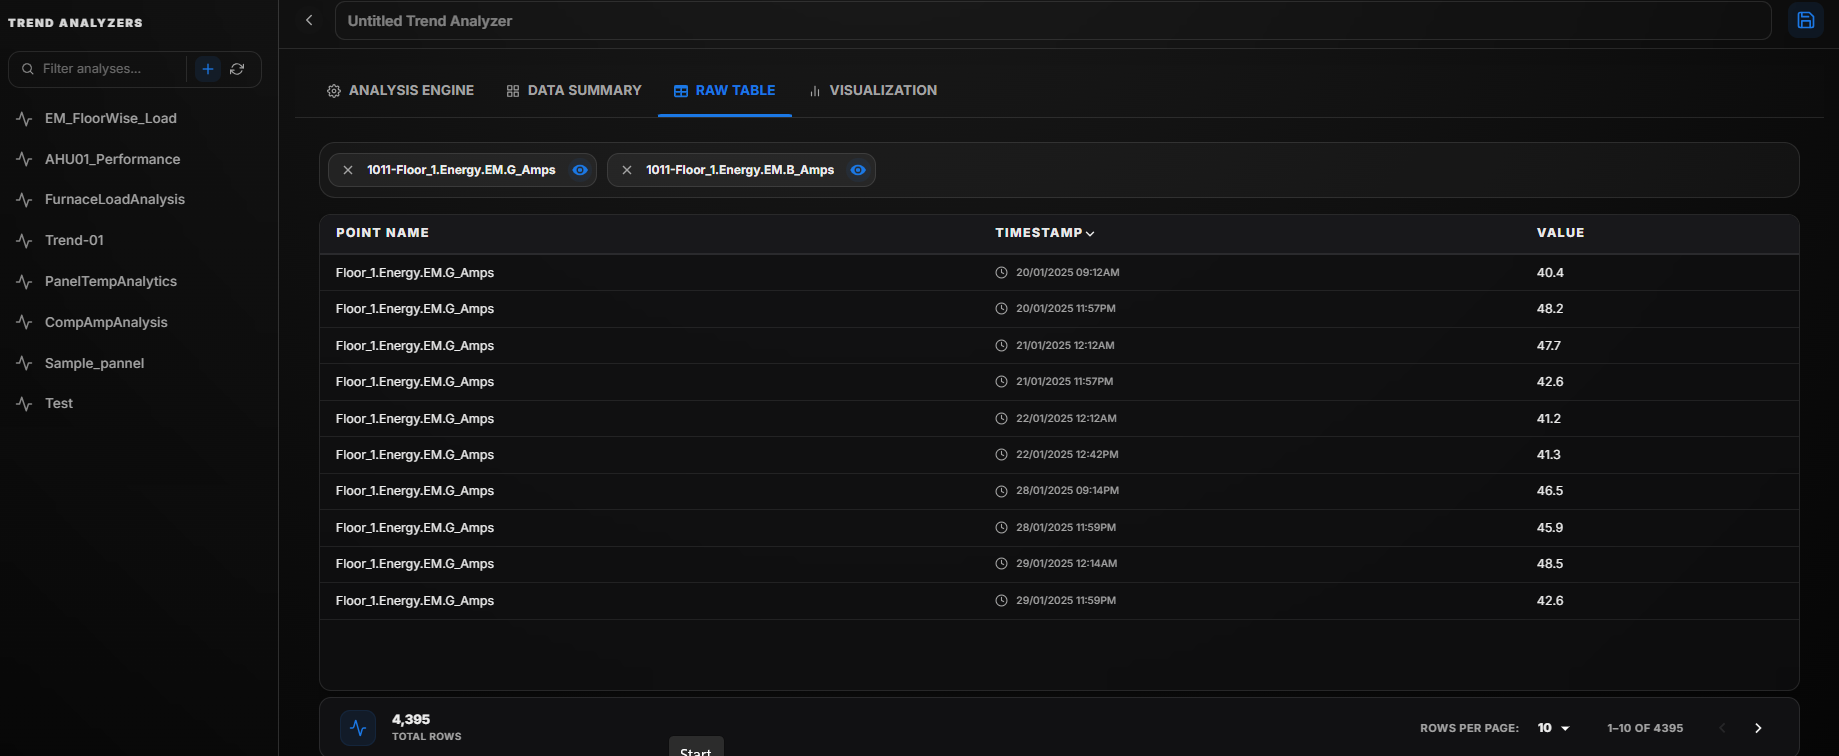
Raw Table
The table contains the following information.
| Field | Description |
|---|---|
| Point Name | Displays the selected trend point. |
| Timestamp | Displays the exact date and time of the recorded value. |
| Value | Displays the recorded trend value. |
Visualization
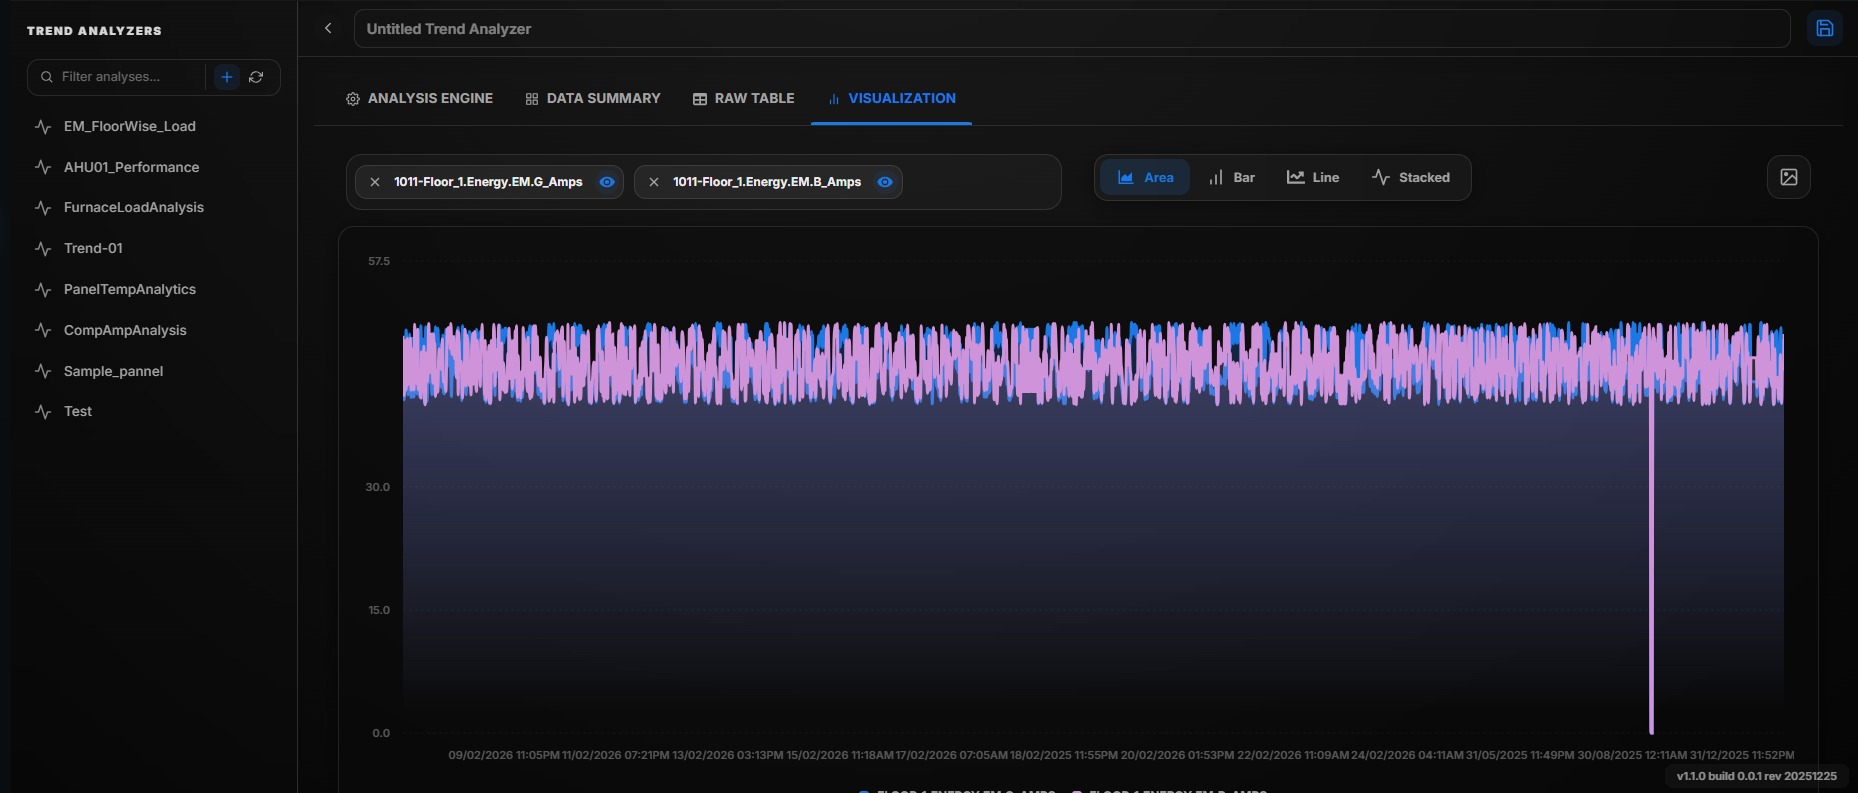
The Visualization section displays graphical representations of the analyzed data.
Users can switch between different chart types.
Area Graph
 Visualization
Steps
- Click Area Graph.
- The trend data is displayed as an area chart.
The area below the trend line is shaded to highlight value changes over time.
Bar Graph
Bar Graph
Steps
- Click Bar Graph.
- The trend data is displayed using bars.
This graph is useful for comparing recorded values.
Line Graph
Steps
- Click Line Graph.
- The trend data is displayed as a continuous line.
This graph is useful for observing changes over time.
Stacked Graph
Steps
- Click Stacked Graph.
- Multiple trend series are displayed in a stacked format.
This graph is useful for comparing cumulative values.
Picture View
Steps
- Click the Picture icon.
- The selected chart is displayed in image format.
The image can be used for reports or presentations.
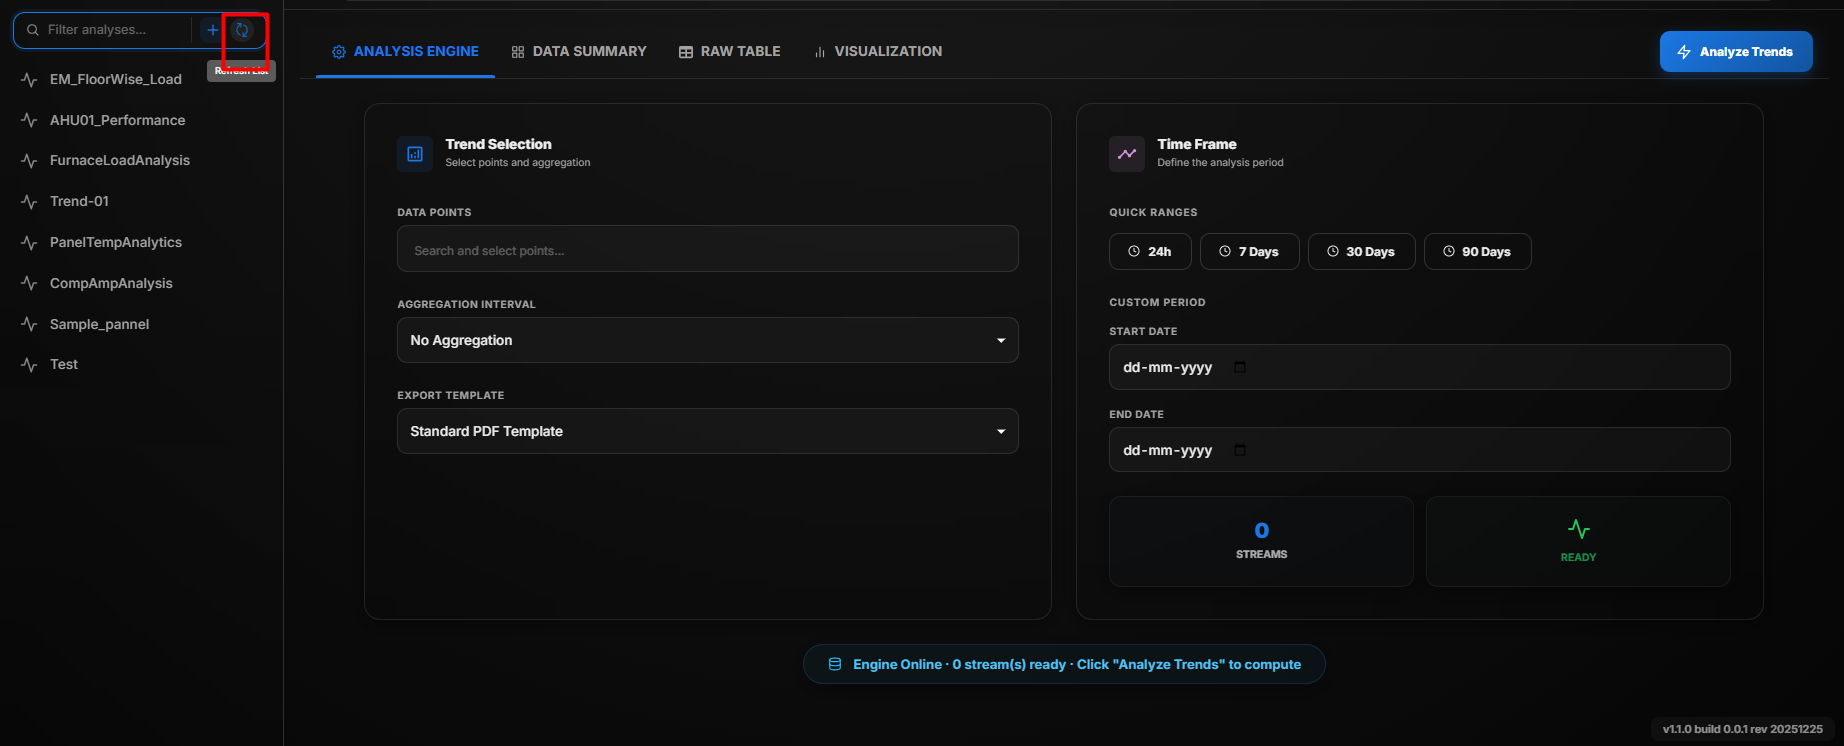
Refresh
The Refresh option reloads the latest trend data and updates the analysis.
Refresh
To refresh the Trend Analysis:
- Click the Refresh button.
- The latest trend records are retrieved from the system.
- The Data Summary, Raw Table, and Visualization sections are updated automatically.
Renaming a Trend
To rename a trend:
- Select the required trend from the Trend Analyzer Navigator.
- Click the Trends Name field.
- Enter the new name.
- Press Enter or click outside the field to save the changes.
The trend is renamed successfully.
Complete Workflow
Generate a Trend Analysis by following the workflow below:
- Open the Trend Analyzer module.
- Create a new Trend Analysis or select an existing one.
- Enter a name for the Trend Analysis.
- To rename an existing Trend Analysis, select it from the Trend Analyzer Navigator, click the Trend Analysis Name field, enter the new name, and save the changes.
- Select the required Data Points.
- Select the Aggregation Interval.
- Choose an Export Template.
- Select a Quick Range or configure a Custom Period.
- Click Analyze Trend.
- Review the generated Data Summary.
- View the Raw Table for detailed trend records.
- Analyze the data using the available visualization options.
- Click the Picture icon to view the chart in image format.
- Click Refresh to reload the latest trend data whenever required.