

Display
The Display module allows users to create customized dashboards for monitoring devices, sensors, actuators, and other objects connected to the platform.
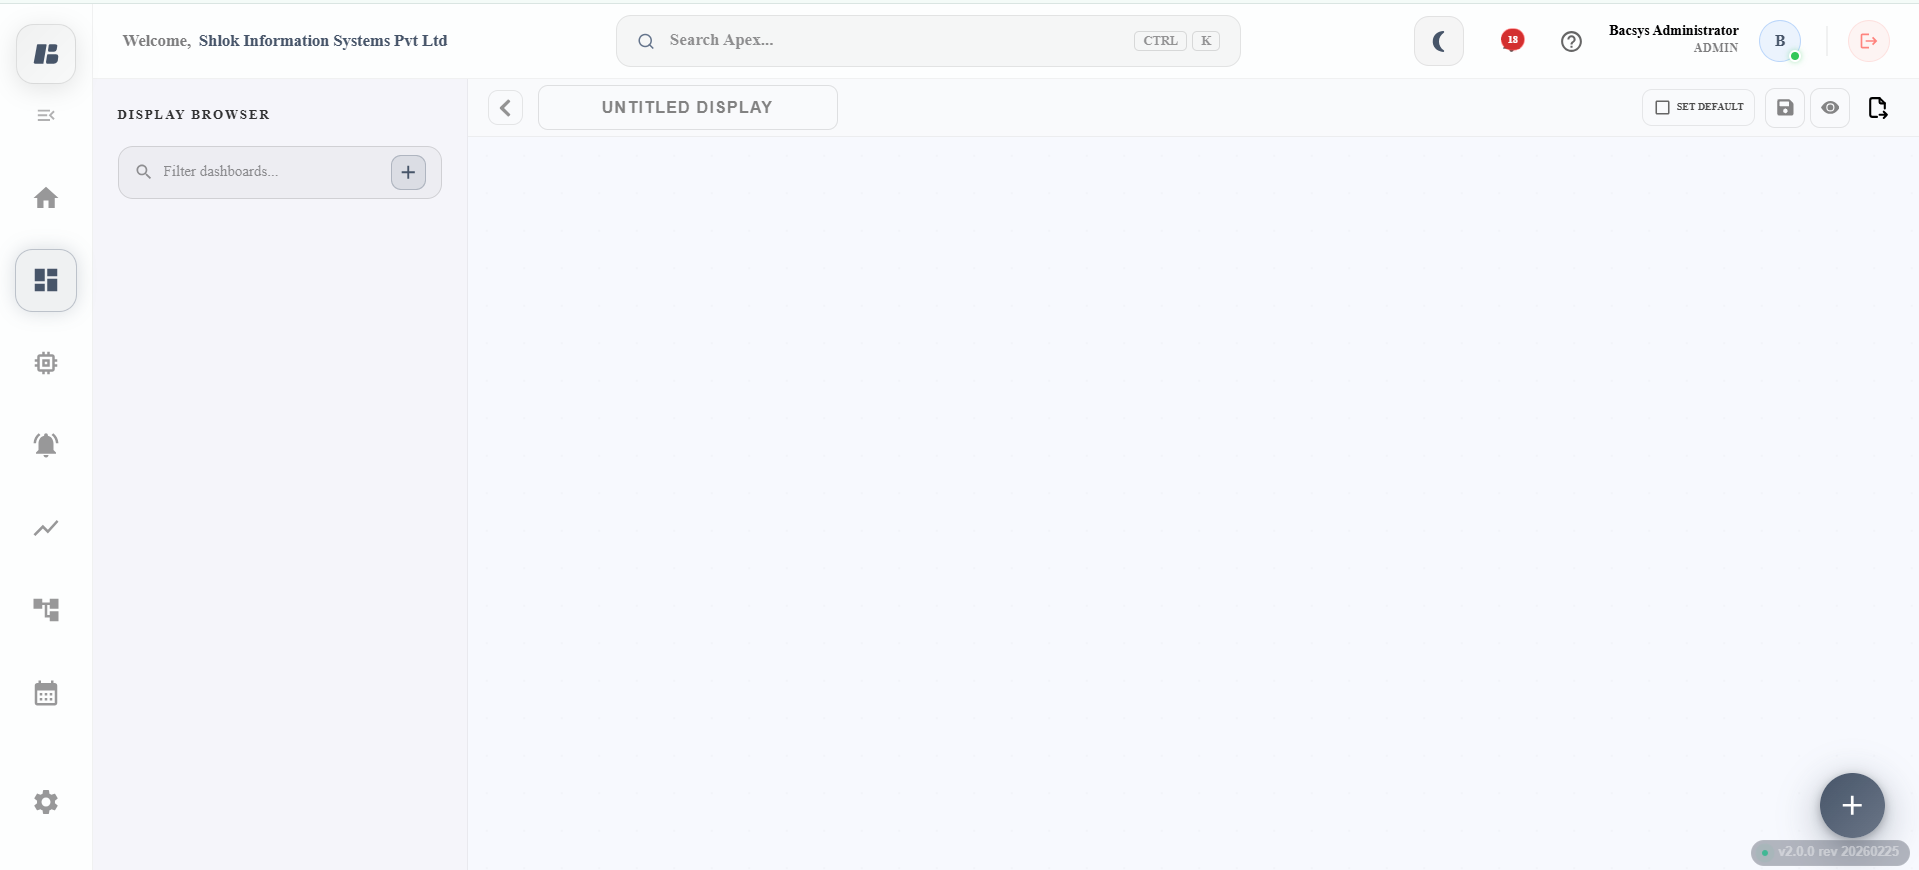
Display Module
To access the Display module:
- Click the Display icon from the main menu.
- Click the Menu icon to show or hide the Display Browser.
- Alternatively, click (>) to expand or (<) to collapse the Display Browser.
- The Display Browser lists all the displays created in the platform.
Creating a Display
Follow the steps below to create a new display.
-
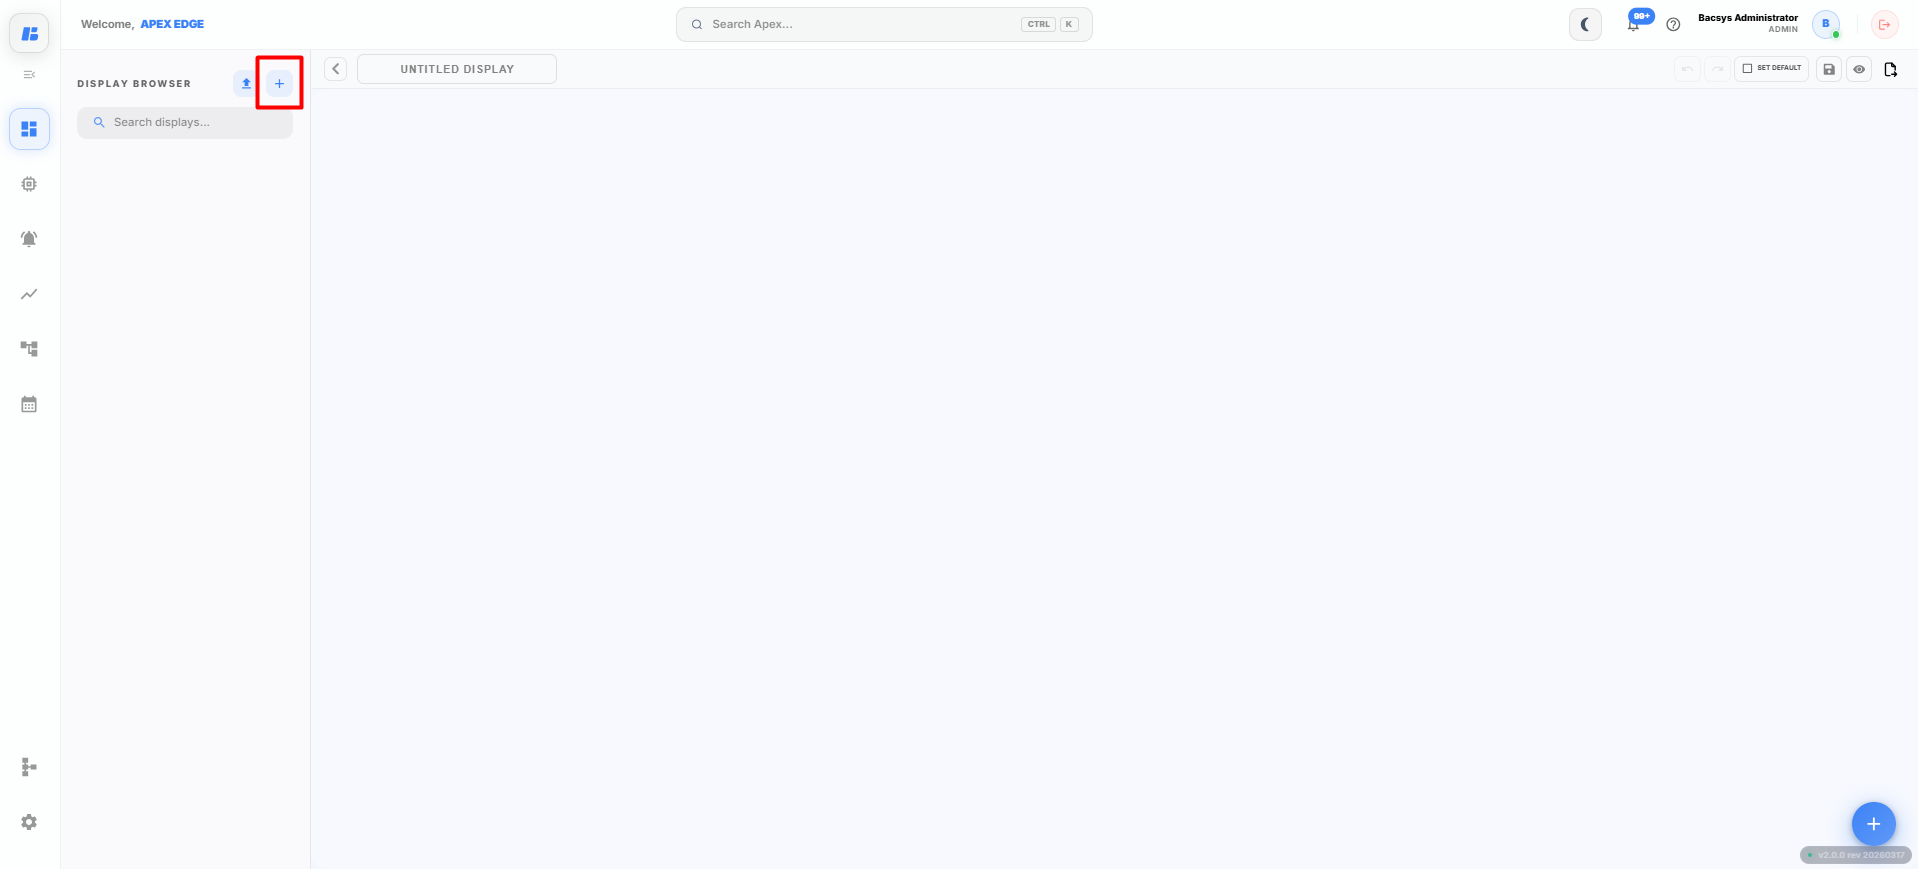
Click the + (Add) icon.
The New Display dialog box appears.
-
Enter the required Display Name.
For example:
- Utility Display
- Energy Dashboard
- HVAC Monitoring
-
Click Save.
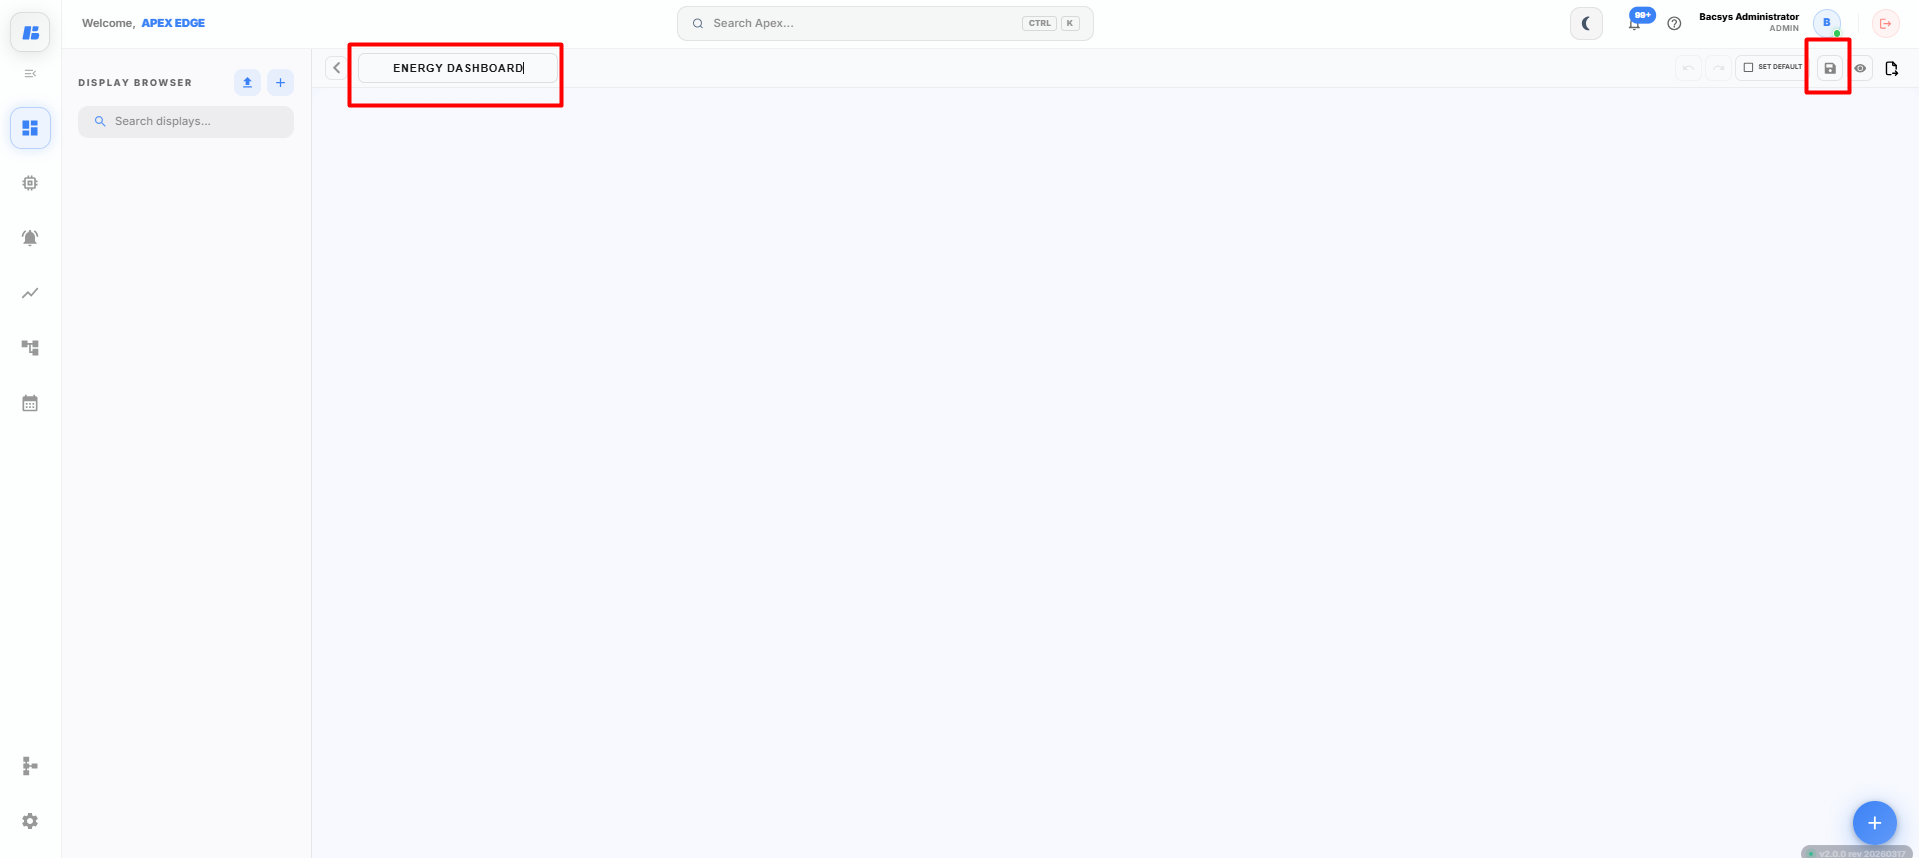
The new display is created and appears in the Display Browser.
-
Select the newly created display.
A blank canvas is displayed where widgets can be added and arranged.
Display Widgets
To add widgets to the display:
-
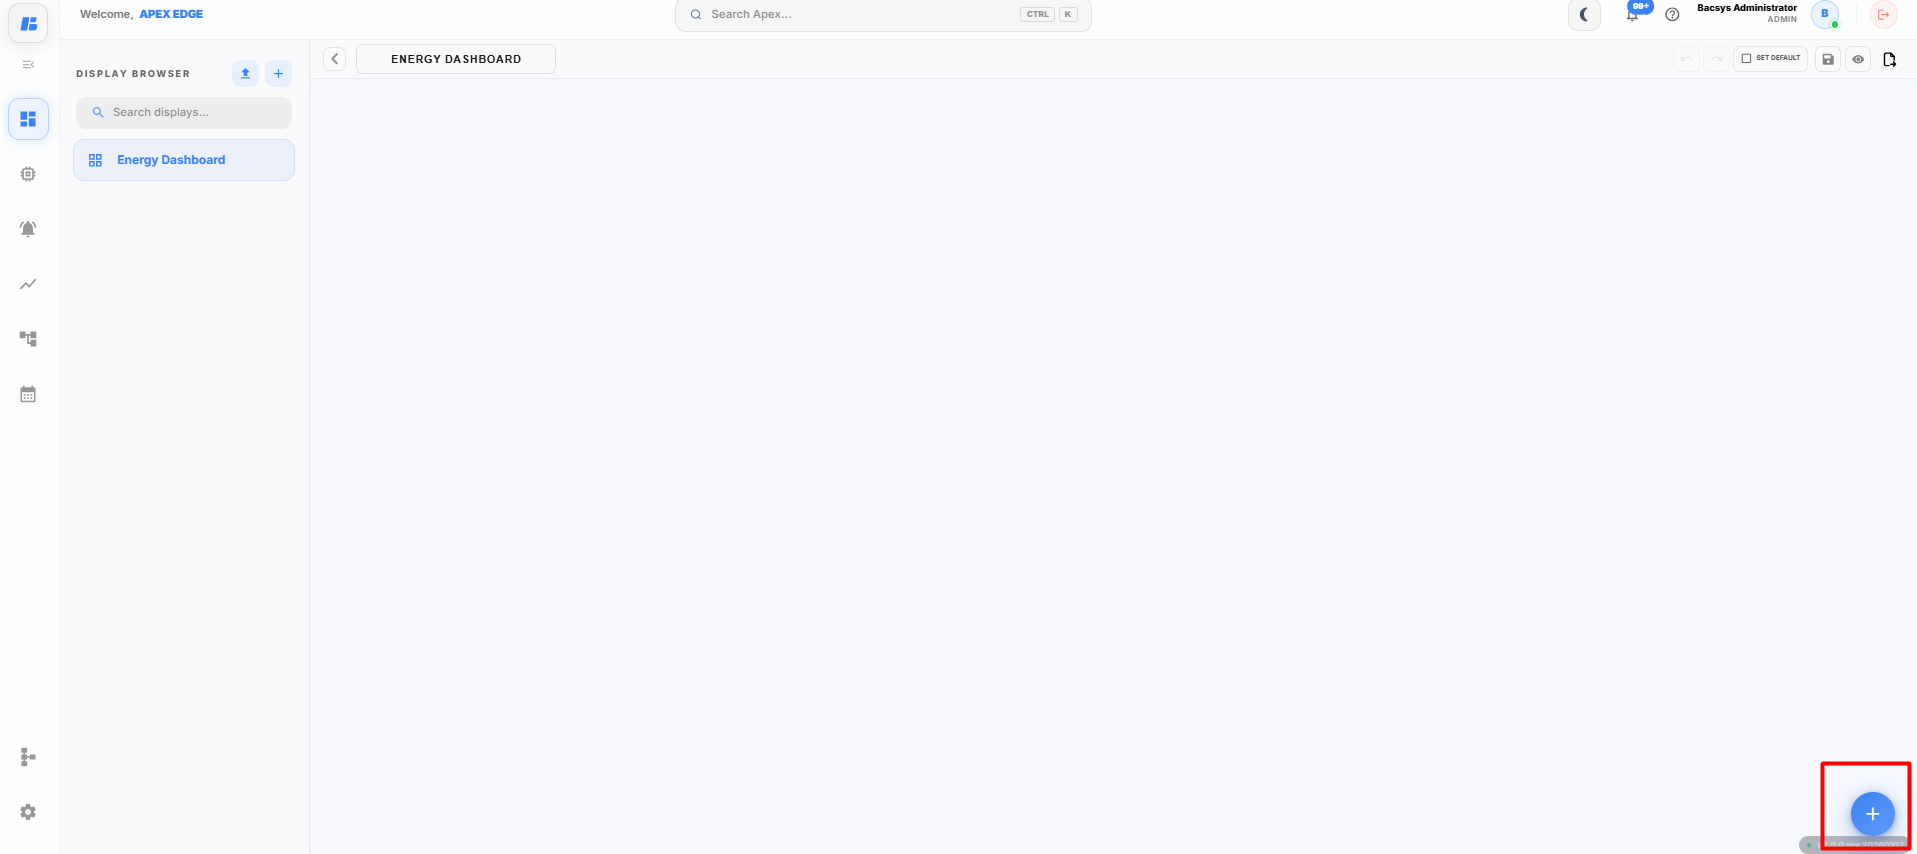
Click the + icon on the display canvas.
The Widget Library opens.
-
Drag and drop the required widget onto the display canvas.
Each widget can be configured individually after it is added to the canvas.
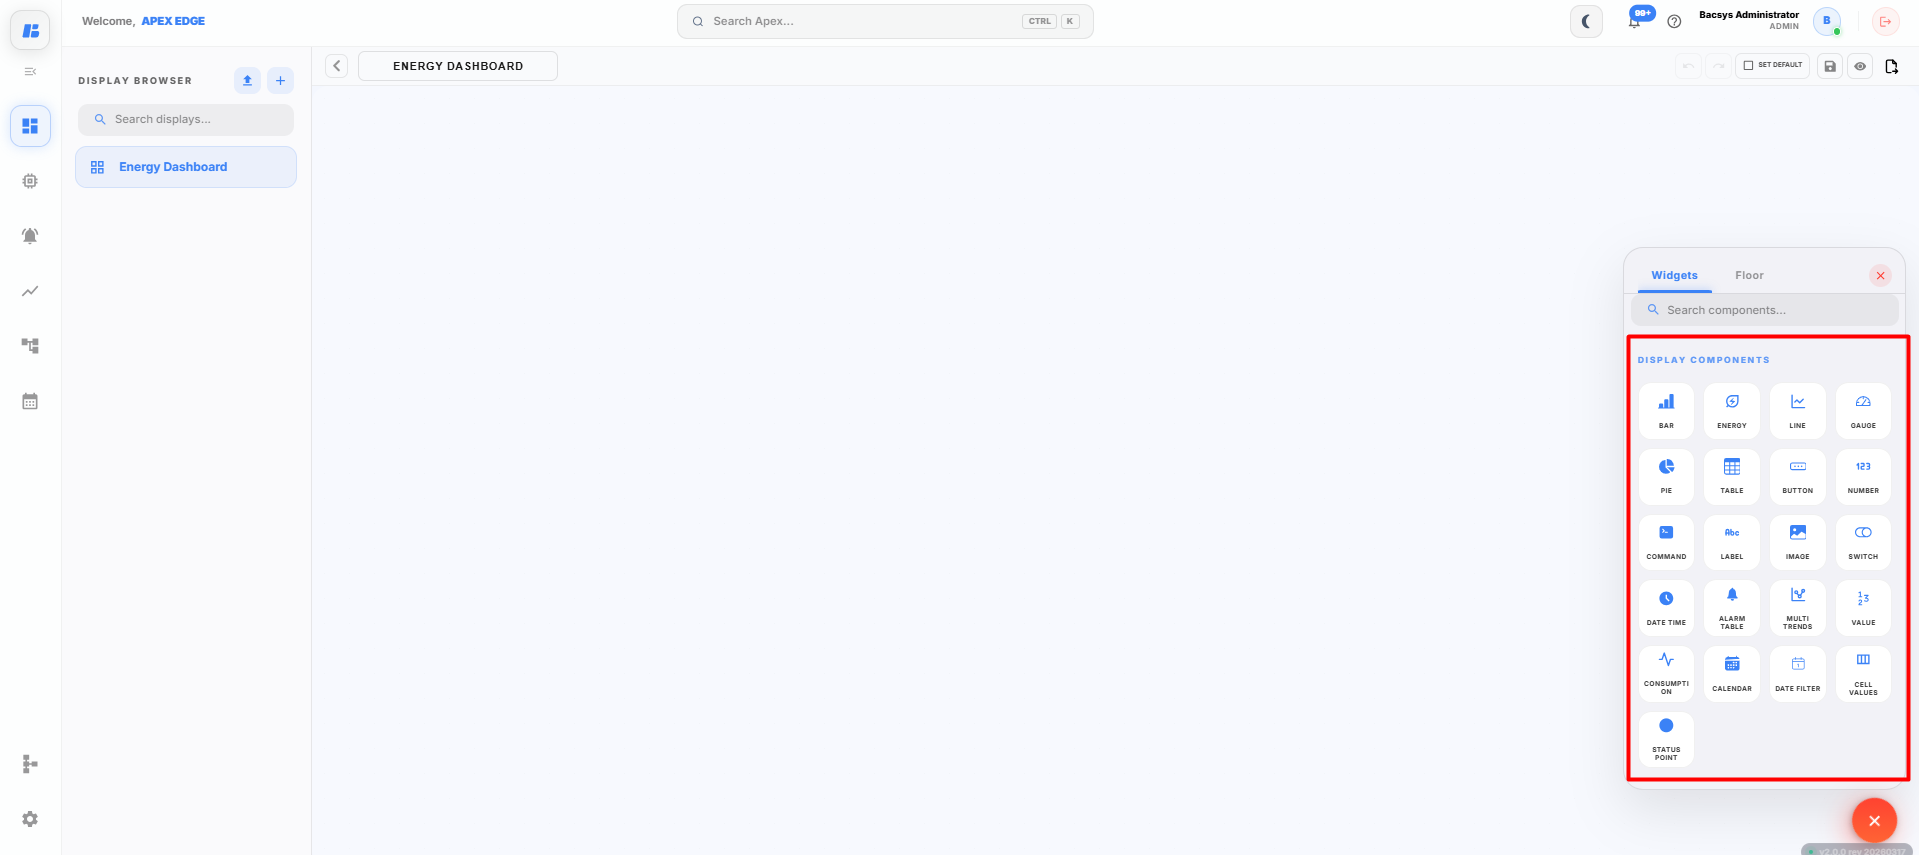
The following widgets are available:
Feature Description Bar Graph Allows the user to create a bar graph based on real-time values of Points/Objects or Trend Values of Trend Points. A maximum of 5 Points/Objects can be monitored. Energy Consumption Allows the user to create an energy consumption chart based on real-time values of energy reading Points/Objects. The user can filter and view readings based on the current day, previous day, current week, and Month-to-Date (MTD). Line Graph Allows the user to create a line graph based on real-time values of Points/Objects or Trend Values of Trend Points. A maximum of 5 Points/Objects can be monitored. Gauge Allows the user to create a gauge based on real-time values of Points. The user can configure the minimum and maximum values manually or enable "Auto" for automatic configuration. Pie Chart Allows the user to create a pie chart based on real-time values of Points/Objects or Trend Values of Trend Points. A maximum of 5 Points/Objects can be monitored. Table Allows the user to create a table displaying Device Name, Point Name, Point Value, and Point Units based on real-time values of Points/Objects, including the last poll date and time. Button Allows the user to create a button that enables navigation between displays by assigning specific displays to the button. Number Allows the user to display a numeric value based on real-time values of Points. The user can configure the display units of the numeric object. Command Allows the user to execute control commands for selected Points/Objects in real time. Commands can be configured to trigger specific actions or write values to devices. Label Allows the user to create a meaningful customized label for an object or point. Image Allows the user to upload an image for the dashboard related to equipment or devices. It is recommended to upload small-sized images for edge platform optimization. Switch Allows the user to view the on/off status of Points/Objects in real time. Date & Time Allows the user to view the current date and time in real time. Alarm Tables Displays active and historical alarms in a structured table format, allowing users to monitor alarm status, severity, time, and acknowledgment details. Multitrends Enables the user to monitor multiple trend points simultaneously within a single view for comparative analysis. Values Displays real-time values of selected Points/Objects in a clear and organized format for quick monitoring. Consumption Shows calculated consumption data over selected time periods for analysis and reporting purposes. Calendar Allows users to select specific dates or date ranges for filtering and viewing historical data. Data Filters Provides filtering options to refine displayed data based on time range, device, point, or other configurable parameters. Cell Values Displays individual cell-level values within a table or grid structure, enabling detailed monitoring of specific data points. Status Point Shows the real-time operational status of a specific Point/Object, indicating conditions such as normal, fault, active, or inactive.
The following sections explain how to configure each widget individually.
Bar Graph Widget
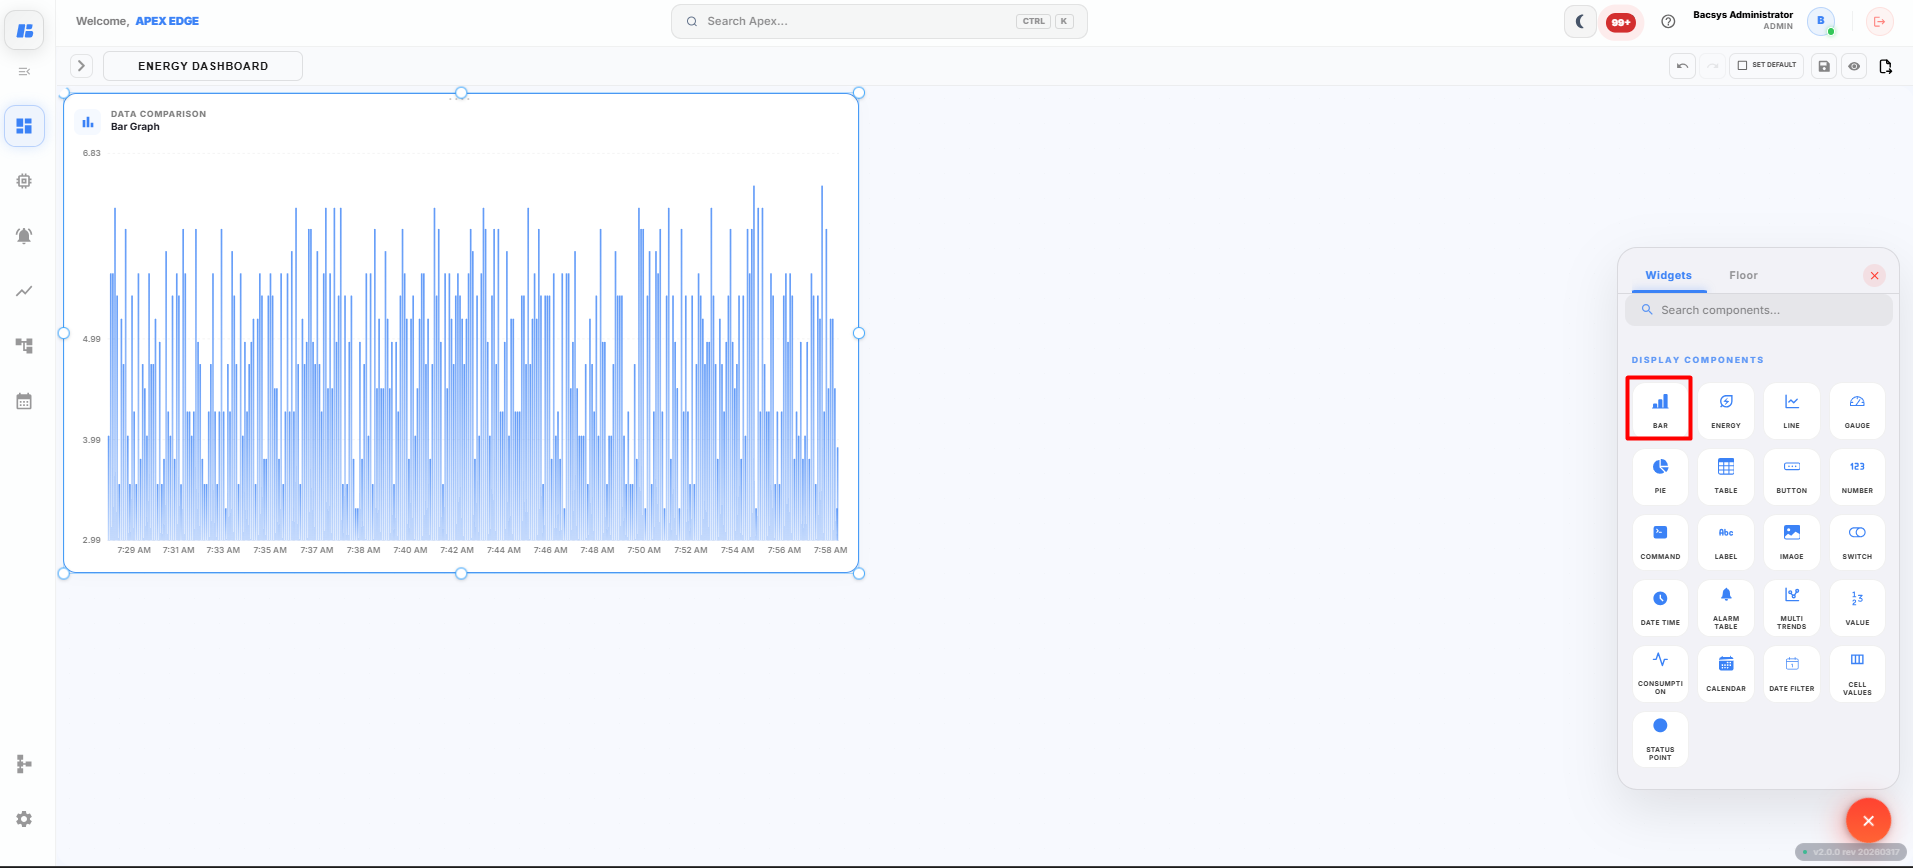
The Bar Graph widget displays the values of selected points in a bar chart, allowing users to compare real-time or historical data.
Adding a Bar Graph Widget
-
Click the + icon on the display canvas.
-
Drag and drop the Bar Graph widget onto the canvas.
The Widget Settings panel appears.
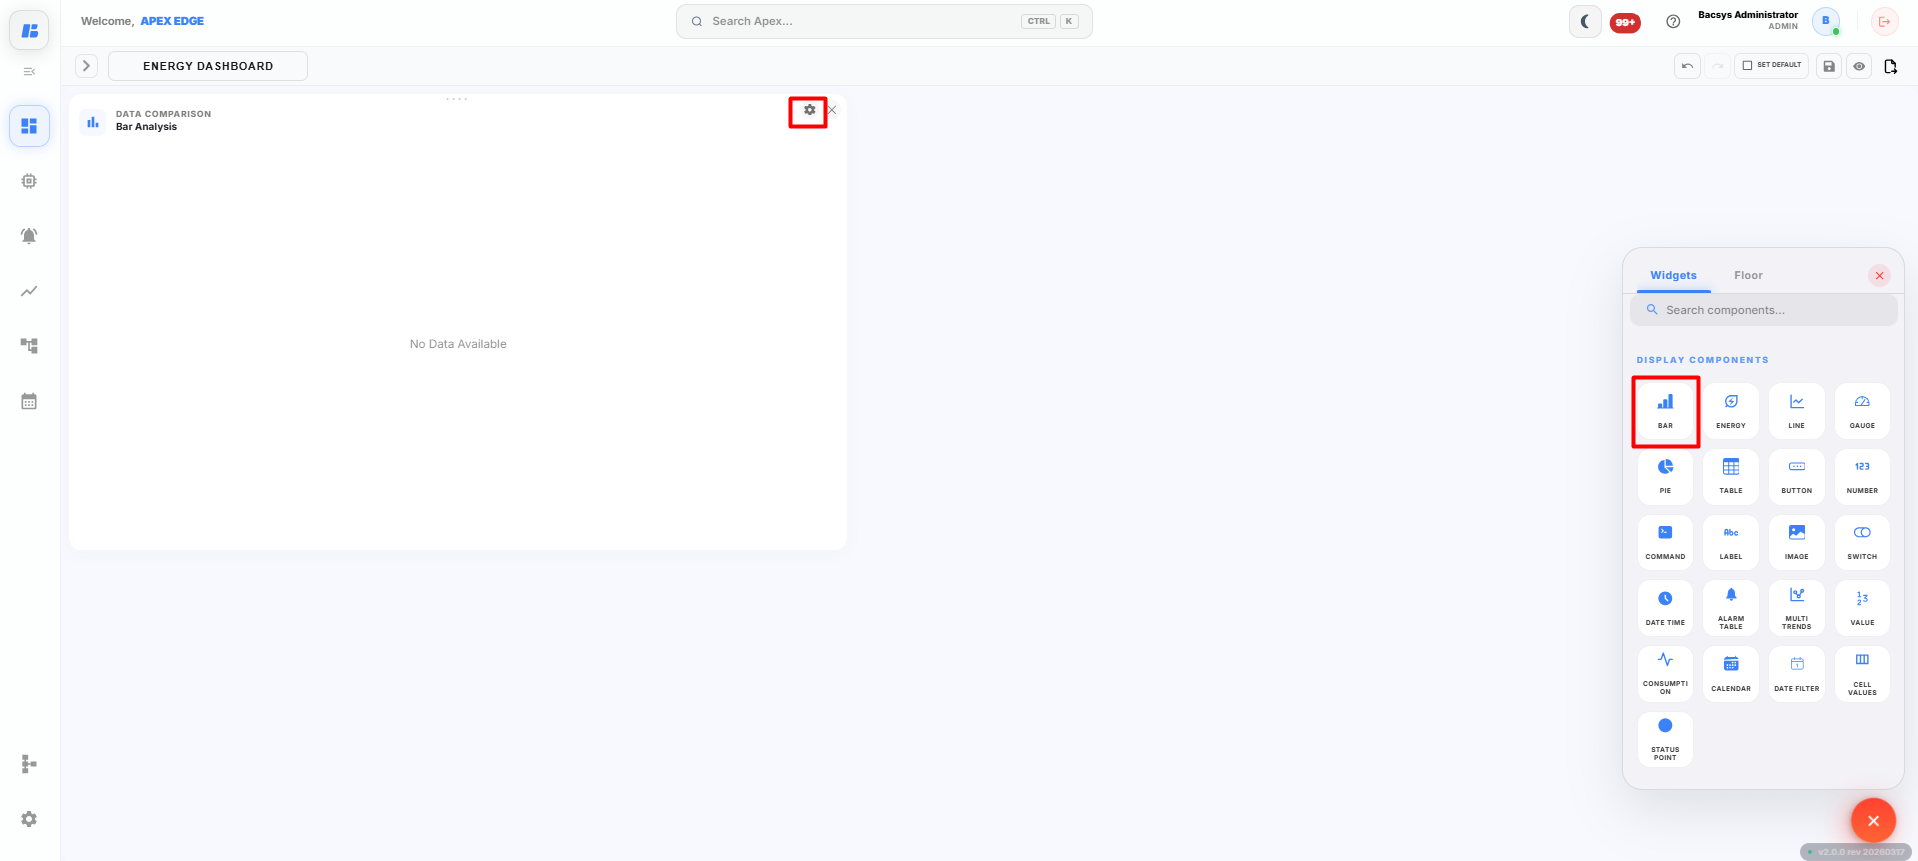
-
Configure the widget using the following settings.
Field Description Title Enter a title for the Bar Graph widget. Select Type Select the type of data to display. The available options are Instantaneous Value and Trend Value.
Instantaneous Value
Select Instantaneous Value to display the current live values of the selected points.
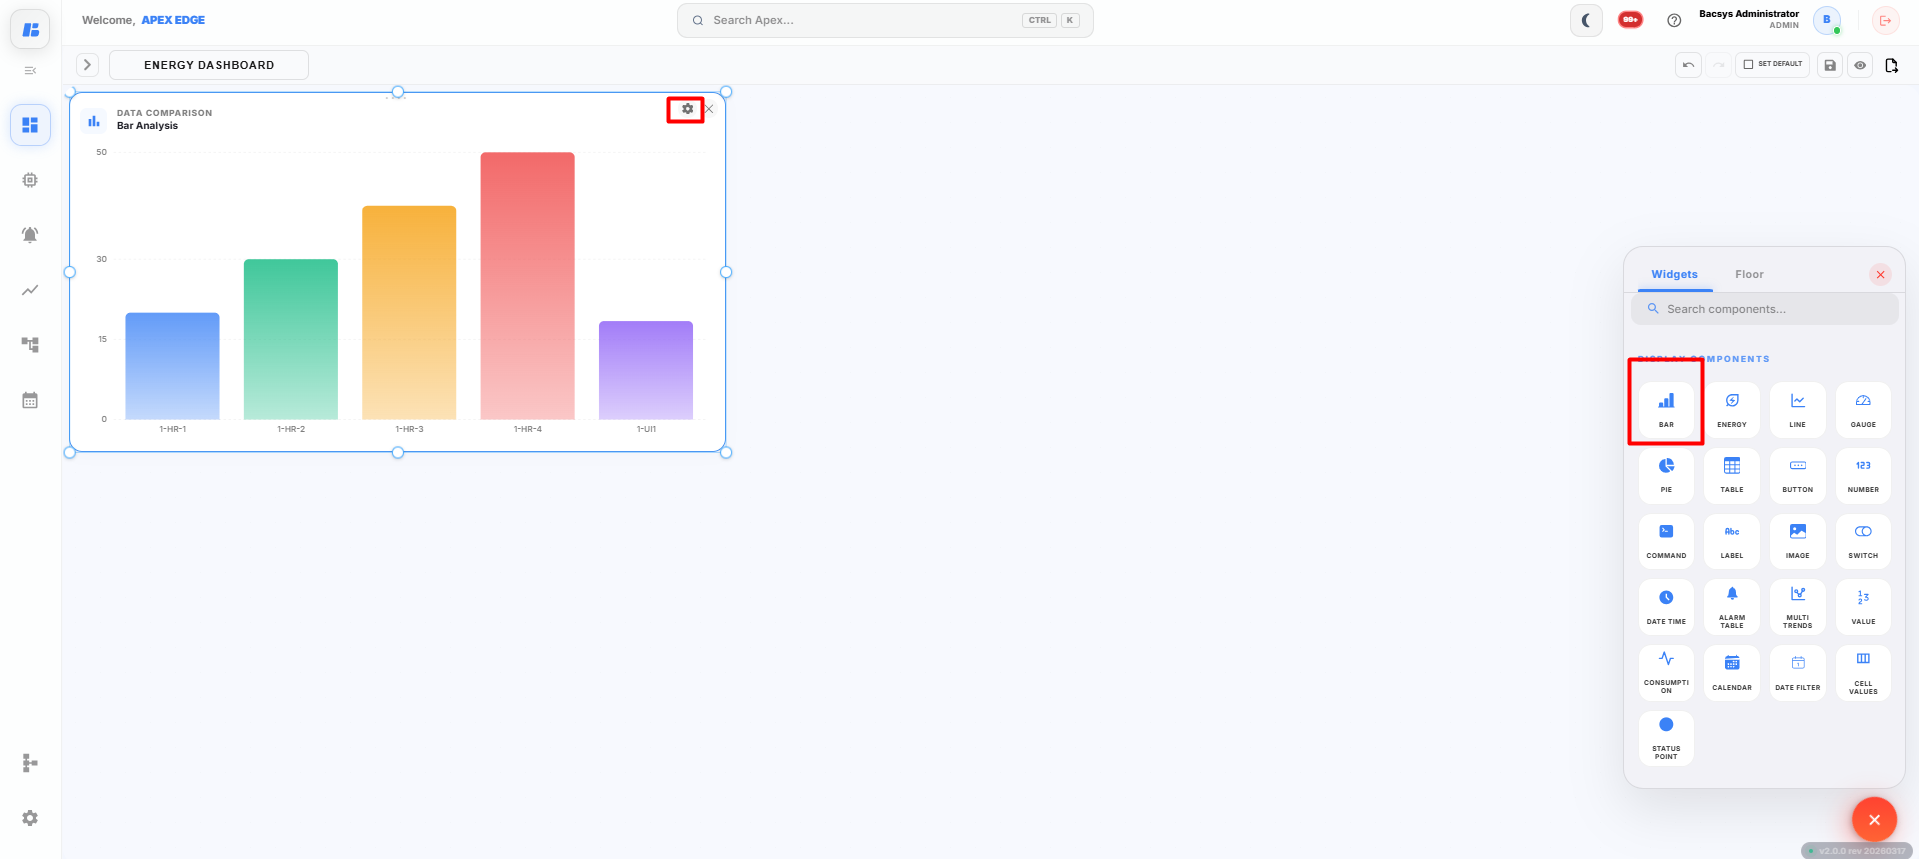
Configure the following settings.
| Field | Description |
|---|---|
| Select Points | Select up to 5 points to display in the Bar Graph widget. |
| Poll Frequency | Specify how frequently the widget refreshes the displayed point values. |
-
Click Select Points.
-
Select up to 5 points that you want to monitor.
-
Configure the required Poll Frequency.
-
Click Save Configuration.
The configured Bar Graph widget is displayed on the canvas and begins showing the live values of the selected points.
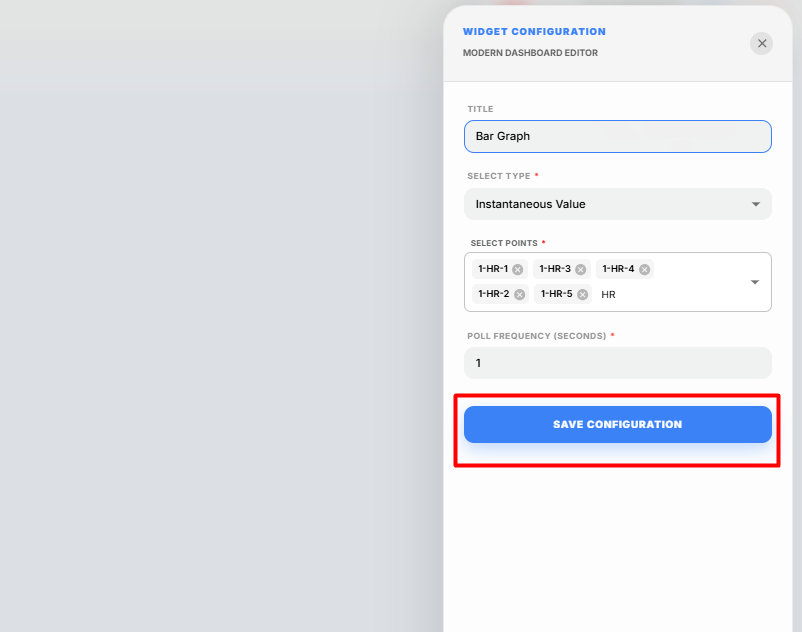
Trend Value
Select Trend Value to display the historical trend data of a selected point.
Note: Before selecting Trend Value, ensure that Trend Logging is enabled for the required point. Navigate to Devices → Select the Point → Config → Trends, enable Data Logging, configure the required trend settings, and click Save Trend Configuration. Historical trend data is available only after trend logging has been enabled.
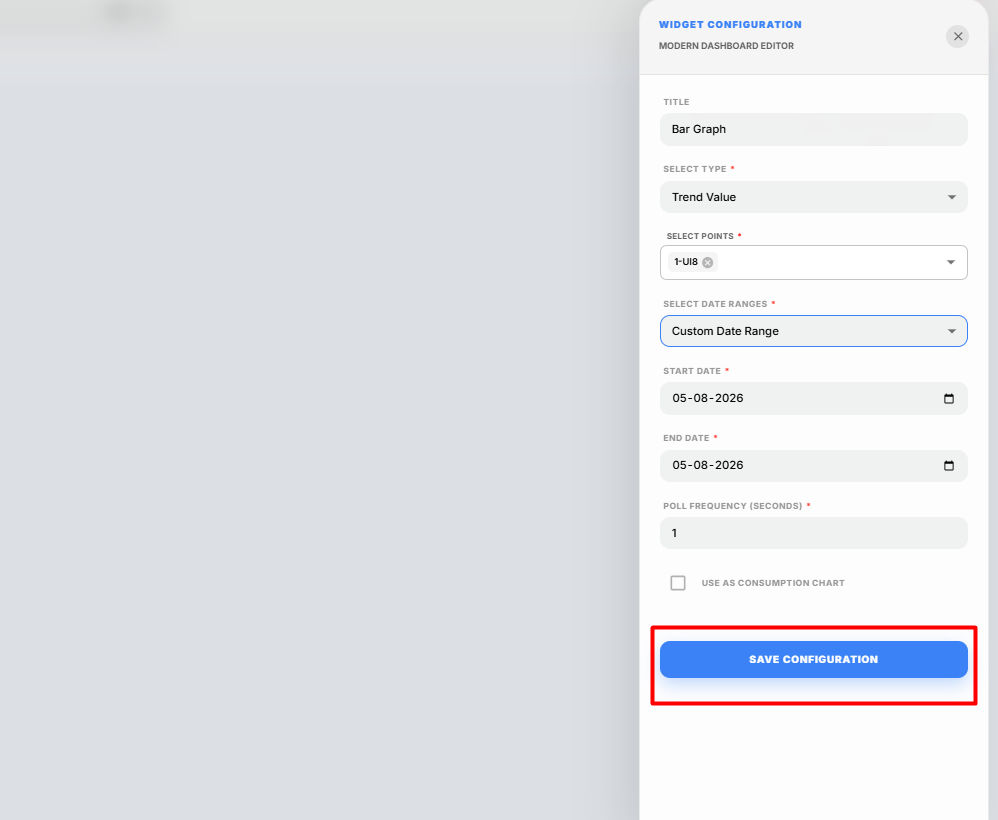
Configure the following settings.
| Field | Description |
|---|---|
| Select Point | Select the required trend-enabled point. Only one point can be selected. |
| Date Range | Select the required trend period. Available options are Last 1 Day, Last 2 Days, and Custom Range. |
| Start Date | Specify the start date when Custom Range is selected. |
| End Date | Specify the end date when Custom Range is selected. |
| Poll Frequency | Specify how frequently the widget refreshes the displayed trend data. |
| Consumption | Enable this option to display the consumption values for the selected point over the configured date range. |
-
Click Select Point.
-
Select the required trend-enabled point.
-
Select the required Date Range.
The available options are:
- Last 1 Day
- Last 2 Days
- Custom Range
If Custom Range is selected, specify the Start Date and End Date.
-
Configure the required Poll Frequency.
-
Enable the Consumption checkbox if you want to display the consumption data for the selected point over the specified date range.
-
Click Save Configuration.
The configured Bar Graph widget displays the historical trend data for the selected point based on the selected date range and configuration.
Saving the Display
After configuring the Bar Graph widget:
-
Click Save on the display toolbar.
The display is saved successfully, and the Bar Graph widget is available on the display canvas for monitoring real-time or historical data.
Energy Consumption Widget
The Energy Consumption widget displays the energy consumption of the selected point over different time periods, allowing users to monitor and analyze energy usage.
Adding an Energy Consumption Widget
-
Click the + icon on the display canvas.
-
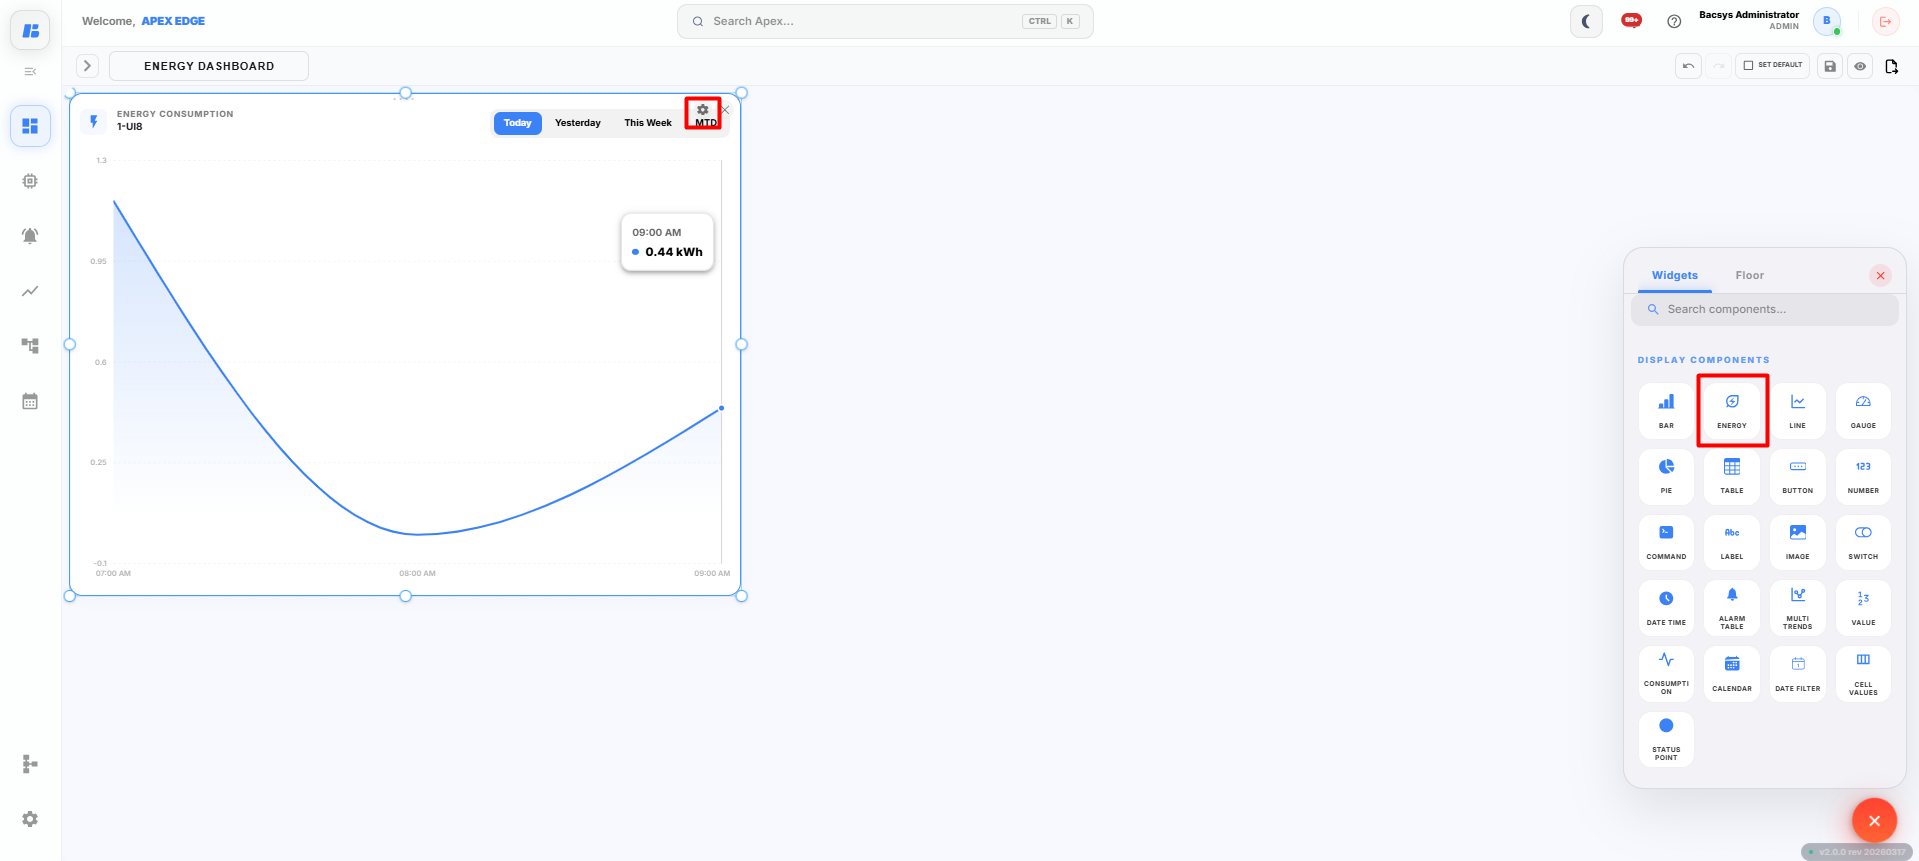
Drag and drop the Energy Consumption widget onto the canvas.
The Widget Settings panel appears.
-
Configure the widget using the following settings.
Field Description Title Enter a title for the Energy Consumption widget. Select Point Select the energy point that you want to monitor. Poll Frequency Specify how frequently the widget refreshes the displayed energy consumption data. -
Click Select Point and choose the required energy point.
Note: Ensure that the selected point provides energy consumption data. Otherwise, the widget may not display the expected values.
-
Configure the required Poll Frequency.
-
Click Save Configuration.
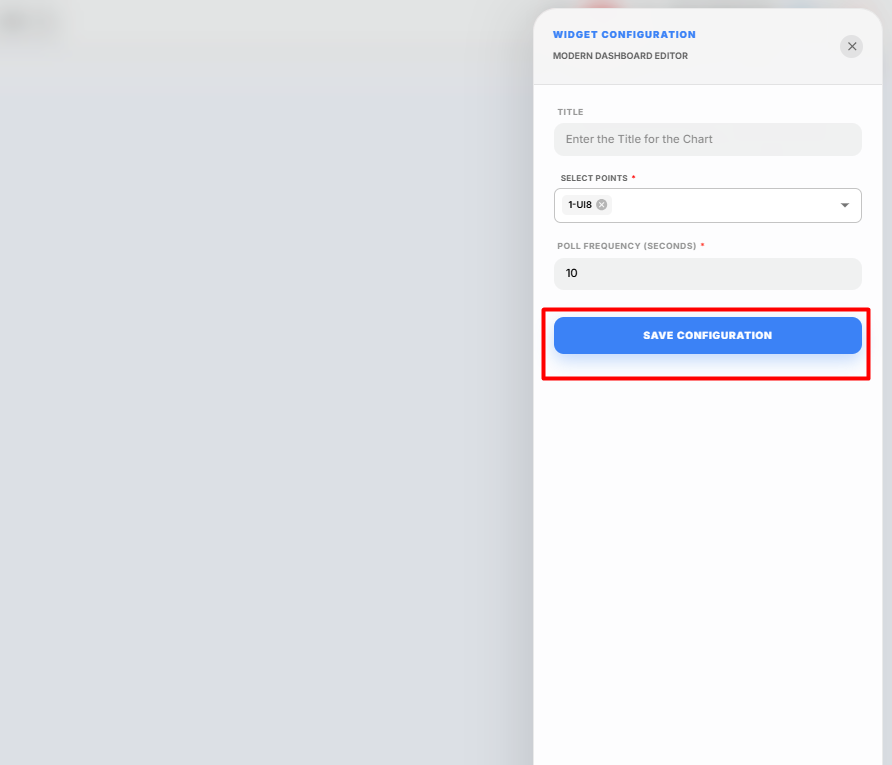
The configured Energy Consumption widget is displayed on the canvas and begins displaying the energy consumption data for the selected point.
Viewing Energy Consumption
After the widget has been configured, you can view the energy consumption for different predefined time periods.
The following options are available:
| Option | Description |
|---|---|
| Today | Displays the energy consumption recorded for the current day. |
| Yesterday | Displays the energy consumption recorded for the previous day. |
| This Week | Displays the accumulated energy consumption for the current week. |
| MTD (Month-to-Date) | Displays the total energy consumption from the beginning of the current month up to the current date. |
Click the required time range to display the corresponding energy consumption data for the selected point.
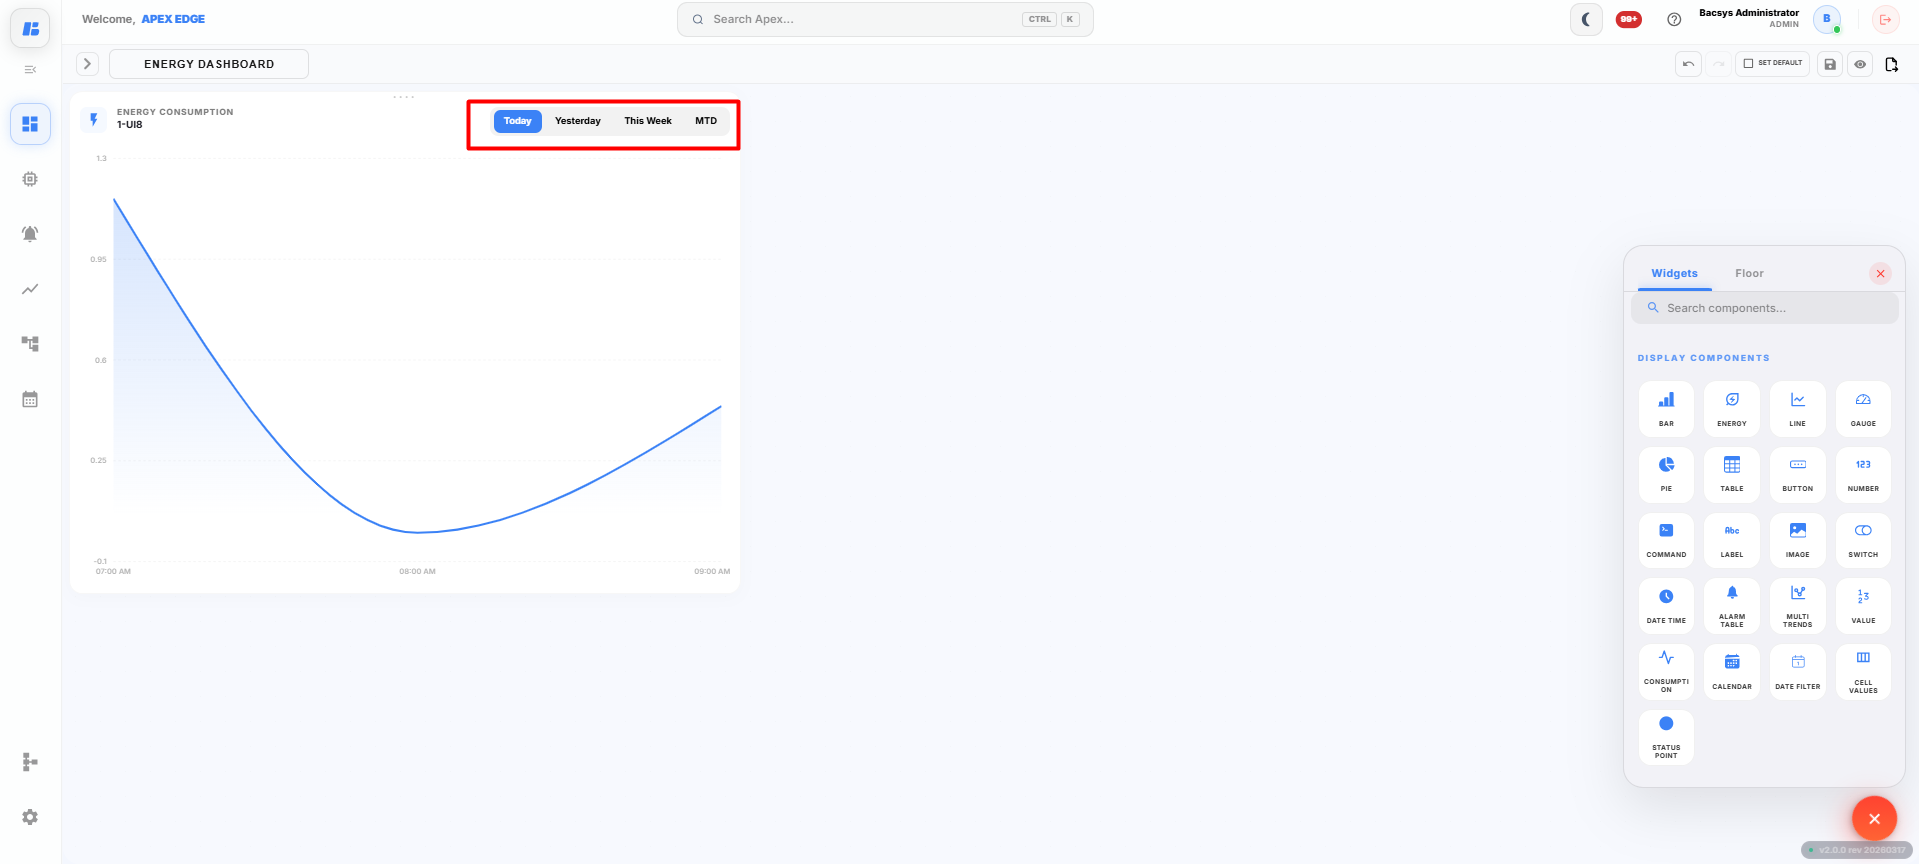
The widget automatically refreshes the displayed values based on the configured Poll Frequency, allowing users to continuously monitor energy consumption over different periods.
Saving the Display
After configuring the Energy Consumption widget:
-
Click Save on the display toolbar.
The display is saved successfully, and the Energy Consumption widget is available on the display canvas for monitoring energy usage.
Line Graph Widget
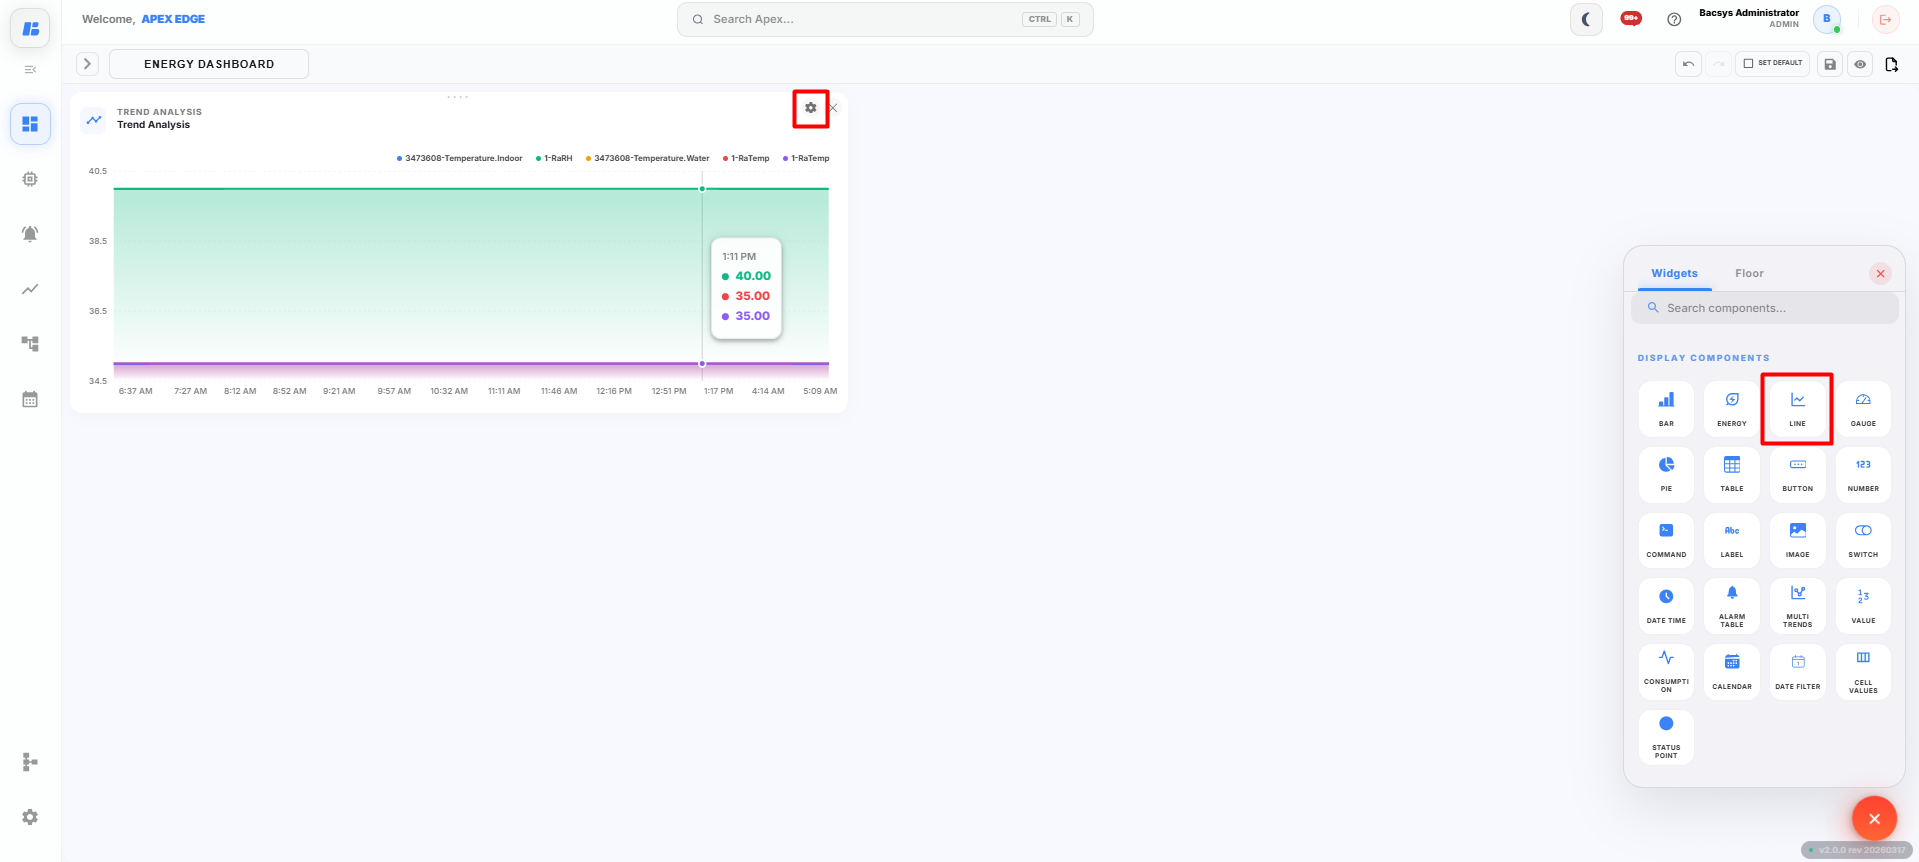
The Line Graph widget displays the values of selected points in a line chart, allowing users to monitor real-time or historical trends over a selected period.
Adding a Line Graph Widget
-
Click the + icon on the display canvas.
-
Drag and drop the Line Graph widget onto the canvas.
The Widget Settings panel appears.
-
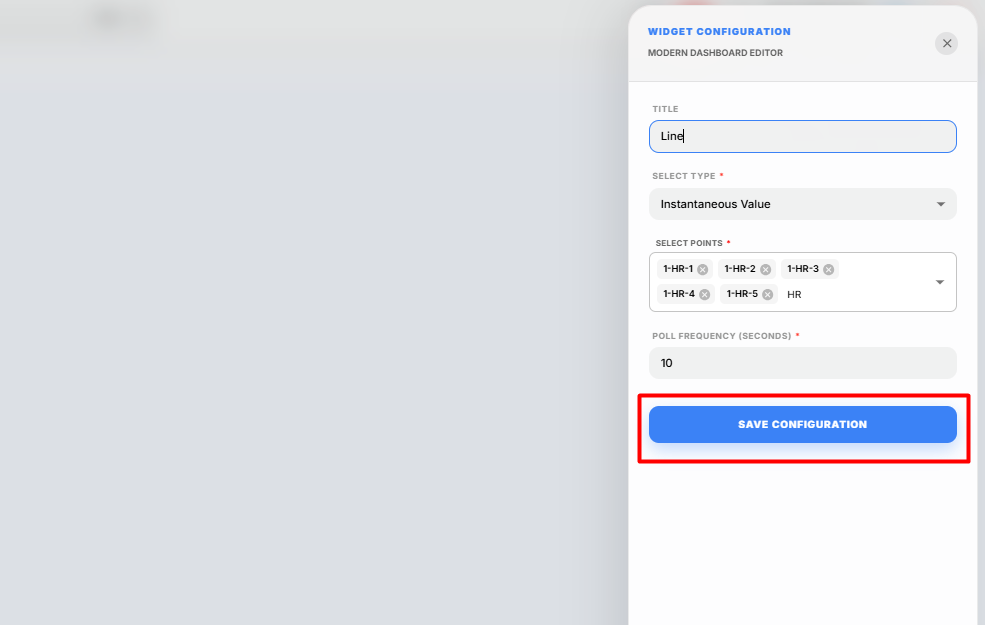
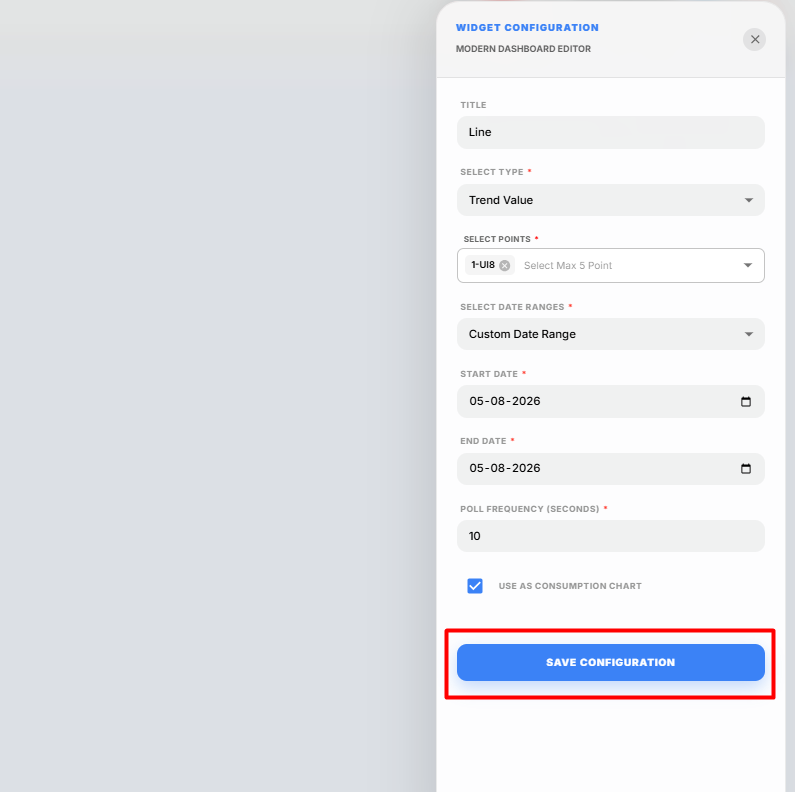
Configure the widget using the following settings.
Field Description Title Enter a title for the Line Graph widget. Select Type Select the type of data to display. The available options are Instantaneous Value and Trend Value.
Instantaneous Value
Select Instantaneous Value to display the current live values of the selected points.
Configure the following settings.
| Field | Description |
|---|---|
| Select Points | Select up to 5 points to display in the Line Graph widget. |
| Poll Frequency | Specify how frequently the widget refreshes the displayed point values. |
-
Click Select Points.
-
Select up to 5 points that you want to monitor.
-
Configure the required Poll Frequency.
-
Click Save Configuration.
The configured Line Graph widget is displayed on the canvas and begins showing the live values of the selected points.
Trend Value
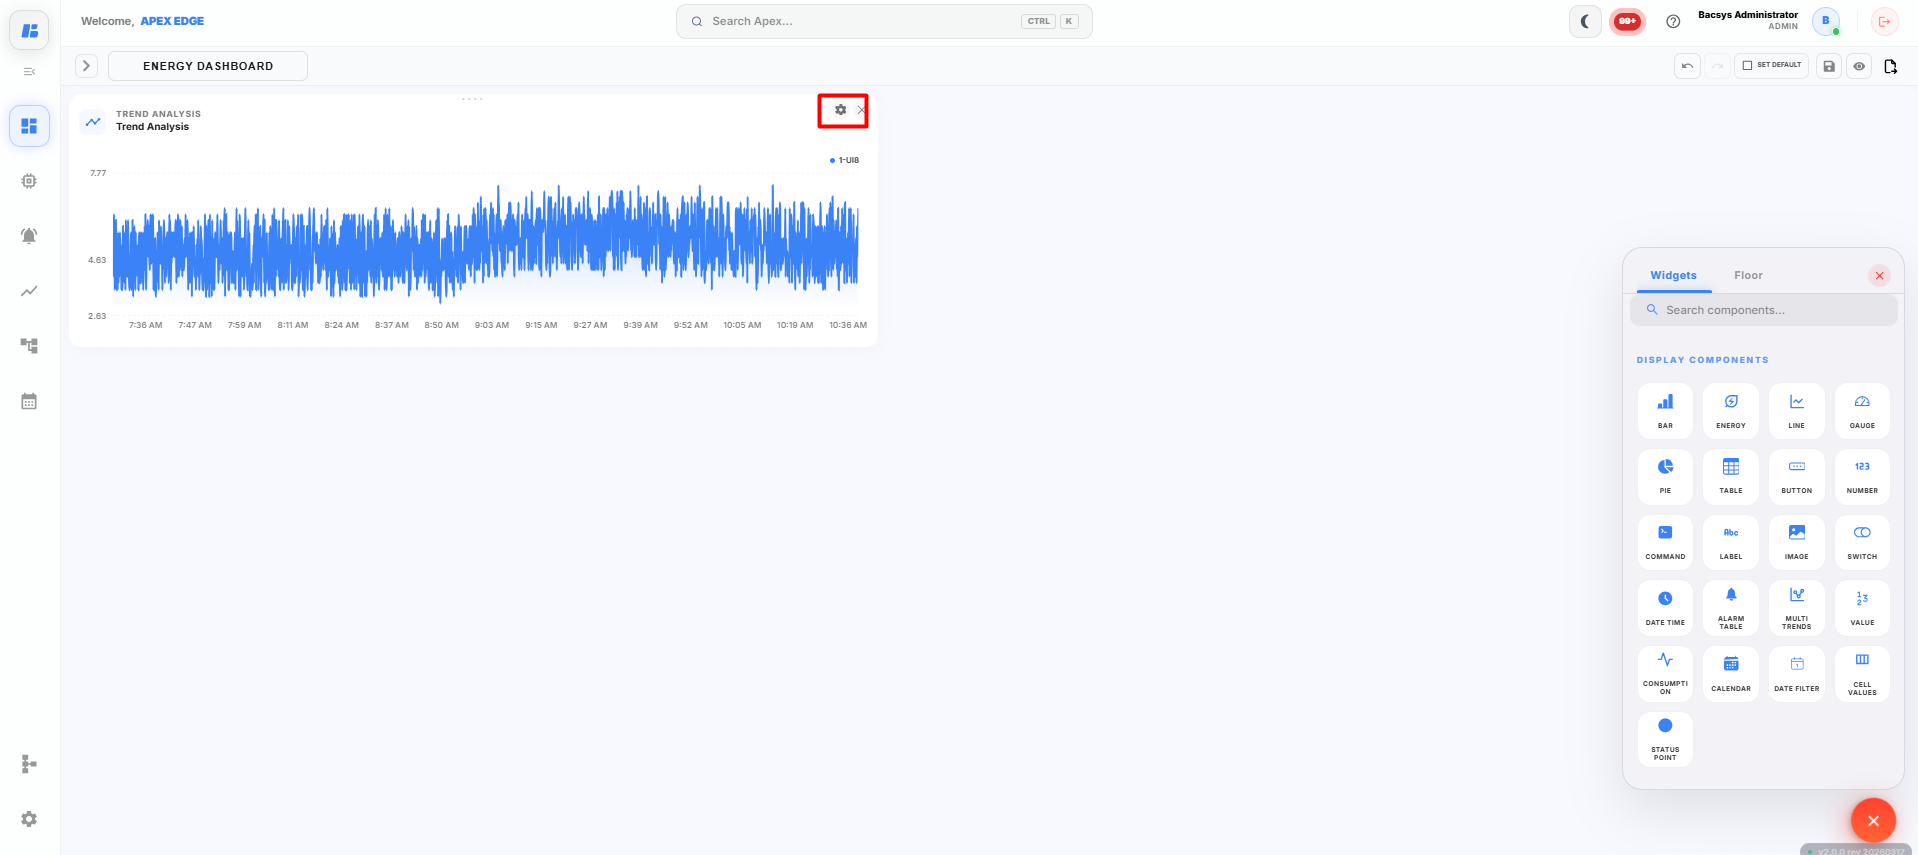
Select Trend Value to display the historical trend data of a selected point.
Note: Before selecting Trend Value, ensure that Trend Logging is enabled for the required point. Navigate to Devices → Select the Point → Config → Trends, enable Data Logging, configure the required trend settings, and click Save Trend Configuration. Historical trend data is available only after trend logging has been enabled.
Configure the following settings.
| Field | Description |
|---|---|
| Select Point | Select the required trend-enabled point. Only one point can be selected. |
| Date Range | Select the required trend period. Available options are Last 1 Day, Last 2 Days, and Custom Range. |
| Start Date | Specify the start date when Custom Range is selected. |
| End Date | Specify the end date when Custom Range is selected. |
| Poll Frequency | Specify how frequently the widget refreshes the displayed trend data. |
| Consumption | Enable this option to display the consumption values for the selected point over the configured date range. |
-
Click Select Point.
-
Select the required trend-enabled point.
-
Select the required Date Range.
The available options are:
- Last 1 Day
- Last 2 Days
- Custom Range
If Custom Range is selected, specify the Start Date and End Date.
-
Configure the required Poll Frequency.
-
Enable the Consumption checkbox if you want to display the consumption data for the selected point over the selected date range.
-
Click Save Configuration.
The configured Line Graph widget displays the historical trend data for the selected point based on the selected date range and configuration.
Saving the Display
After configuring the Line Graph widget:
-
Click Save on the display toolbar.
The display is saved successfully, and the Line Graph widget is available on the display canvas for monitoring real-time or historical trend data.
Gauge Widget
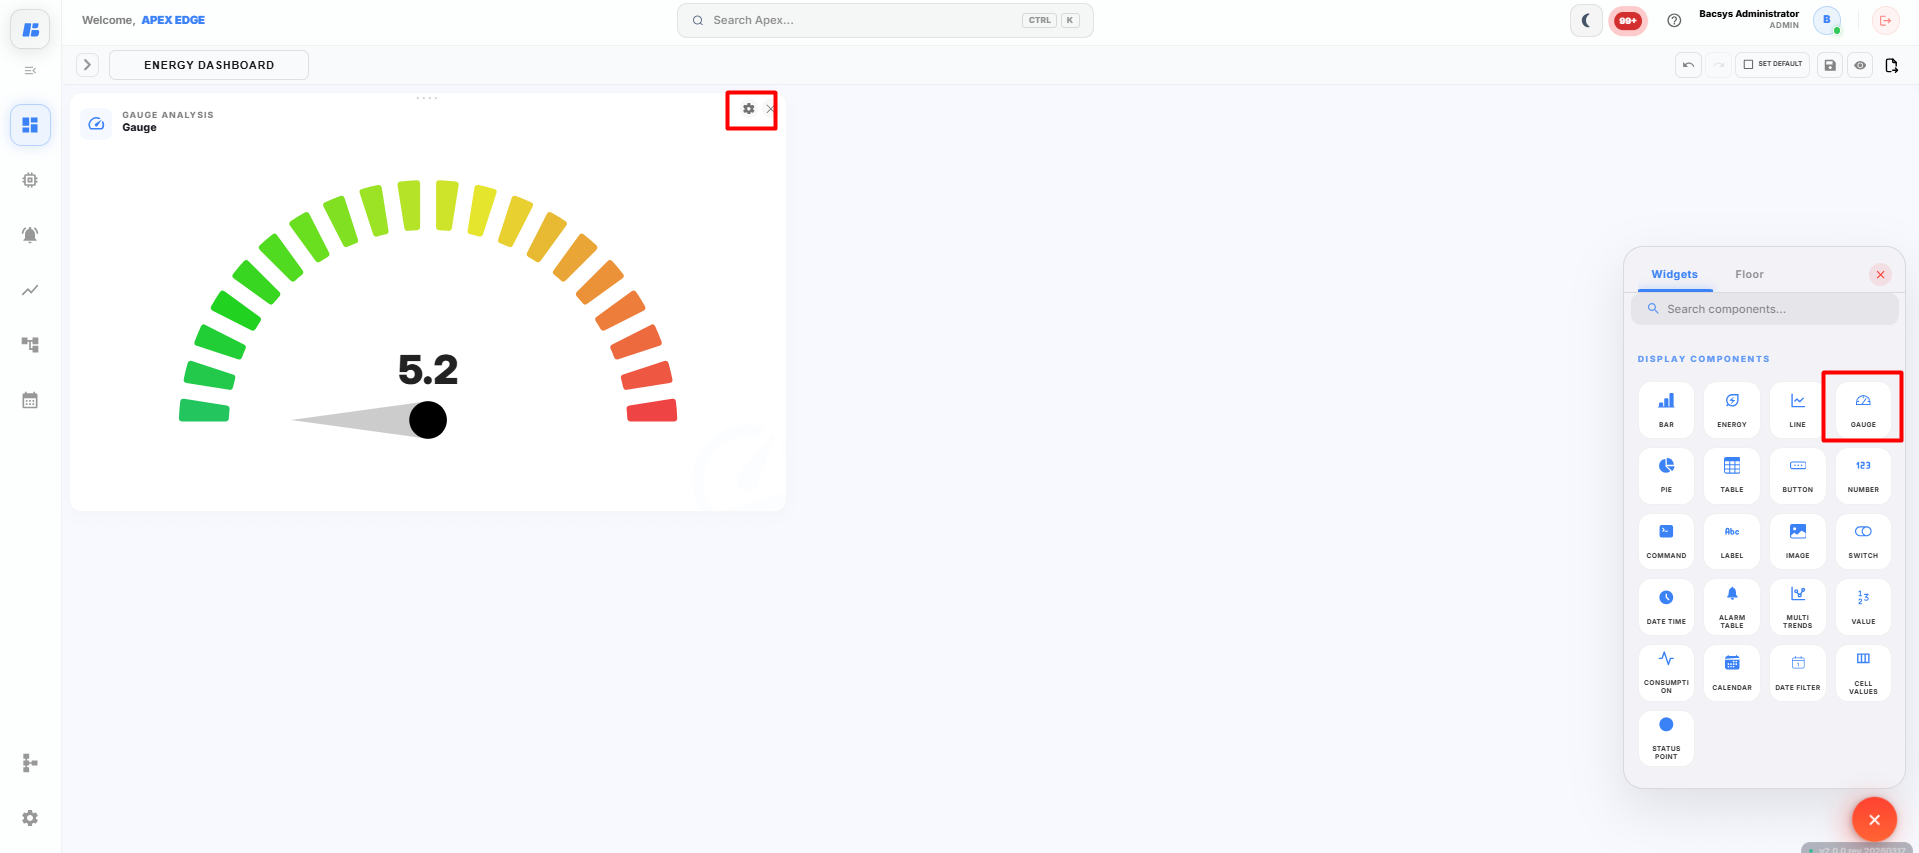
The Gauge widget displays the real-time value of a selected point using a gauge indicator. It helps users monitor the current value and visualize whether it falls within low, medium, or high ranges.
Adding a Gauge Widget
-
Click the + icon on the display canvas.
-
Drag and drop the Gauge widget onto the canvas.
The Widget Settings panel appears.
-
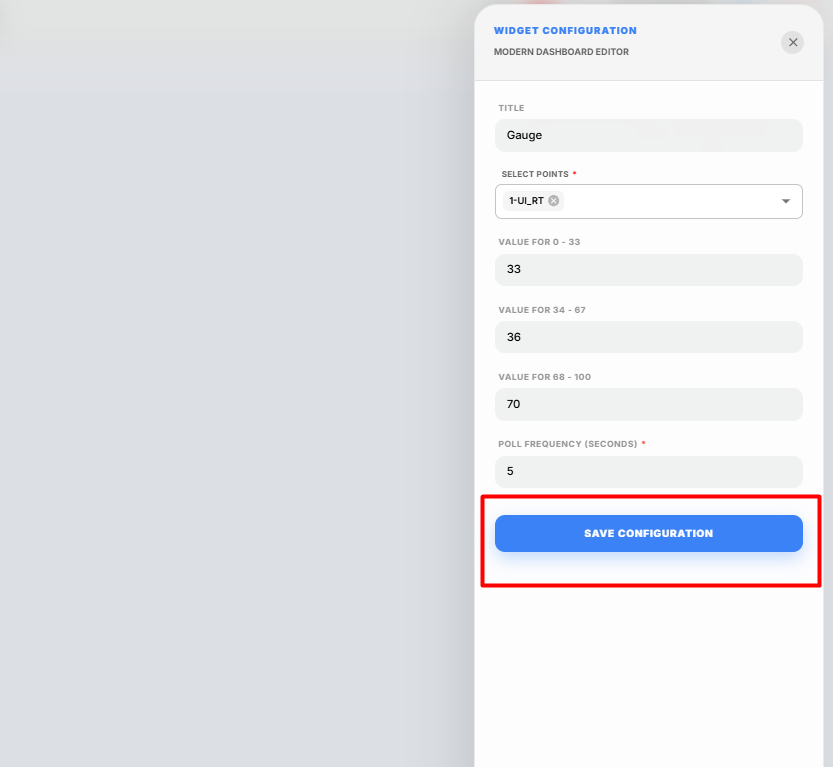
Configure the widget using the following settings.
Field Description Title Enter a title for the Gauge widget. Select Points Select the point whose value will be displayed on the gauge. Only one point can be selected. Value for 0 - 33 Enter the threshold value for the low range of the gauge. Value for 34 - 67 Enter the threshold value for the medium range of the gauge. Value for 68 - 100 Enter the threshold value for the high range of the gauge. Poll Frequency (Seconds) Specify how frequently the widget refreshes the displayed point value. -
Click Select Points and choose the required point.
-
Configure the threshold values for the gauge.
- Value for 0 - 33 defines the lower operating range.
- Value for 34 - 67 defines the medium operating range.
- Value for 68 - 100 defines the higher operating range.
These values determine how the gauge displays the current point value within the configured ranges.
-
Configure the required Poll Frequency.
-
Click Save Configuration.
The configured Gauge widget is displayed on the canvas and begins showing the live value of the selected point.
Saving the Display
After configuring the Gauge widget:
-
Click Save on the display toolbar.
The display is saved successfully, and the Gauge widget is available on the display canvas for monitoring the selected point in real time.
Pie Chart Widget
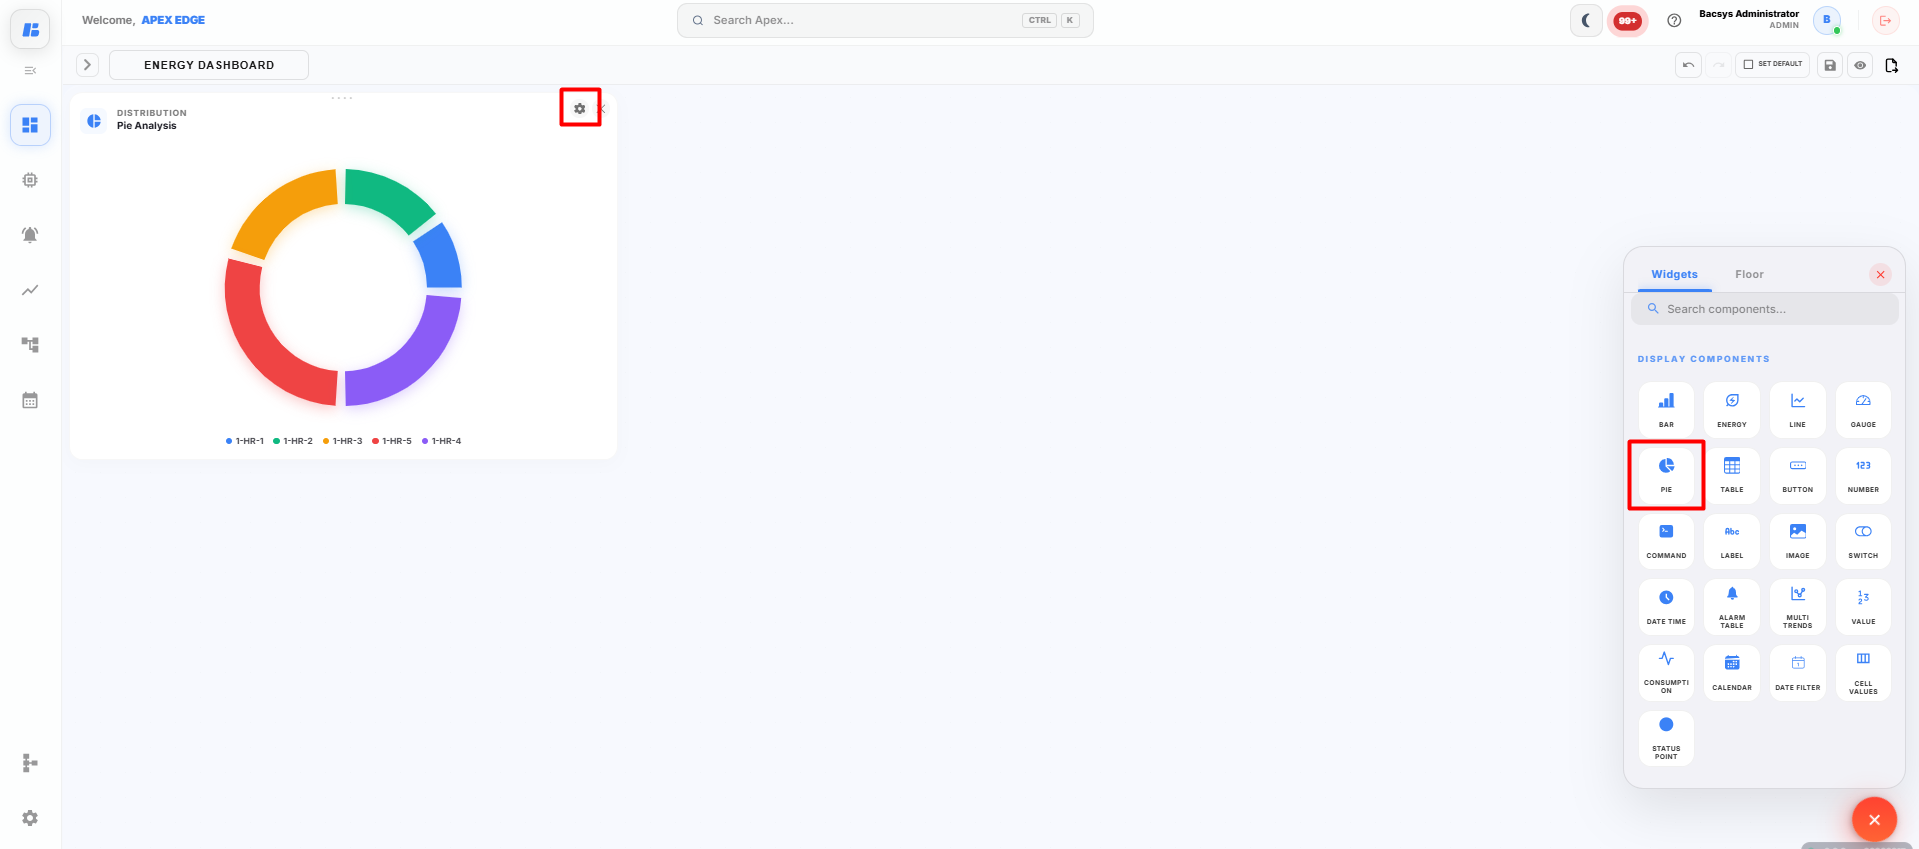
The Pie Chart widget displays the values of selected points as portions of a pie chart, allowing users to compare the contribution of multiple points in a single view.
Adding a Pie Chart Widget
-
Click the + icon on the display canvas.
-
Drag and drop the Pie Chart widget onto the canvas.
The Widget Settings panel appears.
-
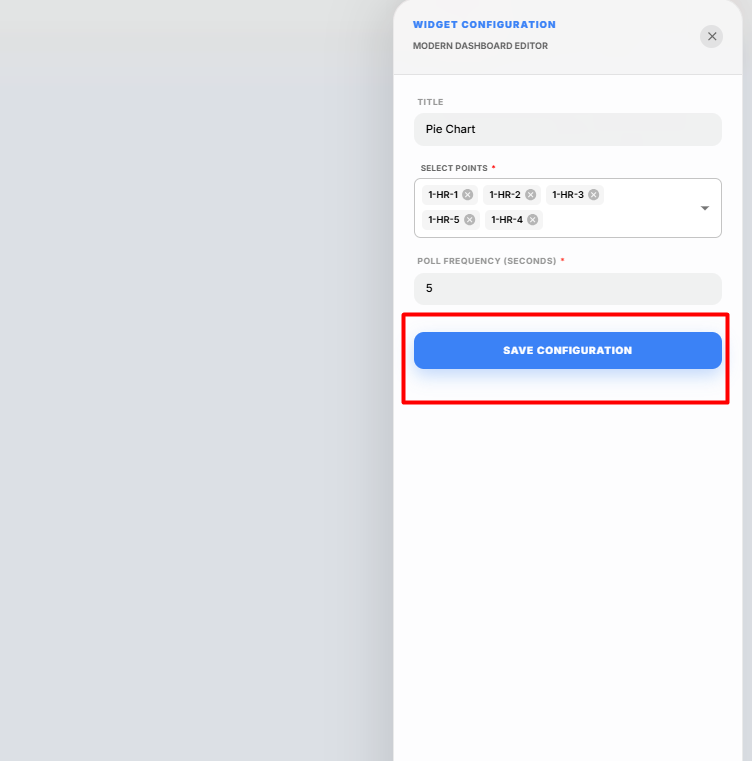
Configure the widget using the following settings.
Field Description Title Enter a title for the Pie Chart widget. Select Points Select up to 5 points to display in the Pie Chart. Poll Frequency (Seconds) Specify how frequently the widget refreshes the displayed point values. -
Click Select Points and choose up to 5 points that you want to display in the Pie Chart.
-
Configure the required Poll Frequency.
-
Click Save Configuration.
The configured Pie Chart widget is displayed on the canvas and begins showing the live values of the selected points as individual sections of the pie chart.
Saving the Display
After configuring the Pie Chart widget:
-
Click Save on the display toolbar.
The display is saved successfully, and the Pie Chart widget is available on the display canvas for monitoring and comparing the selected point values.
Table Widget
The Table widget displays the real-time values of selected points in a tabular format. It allows users to monitor multiple points simultaneously along with their associated information.
Adding a Table Widget
-
Click the + icon on the display canvas.
-
Drag and drop the Table widget onto the canvas.
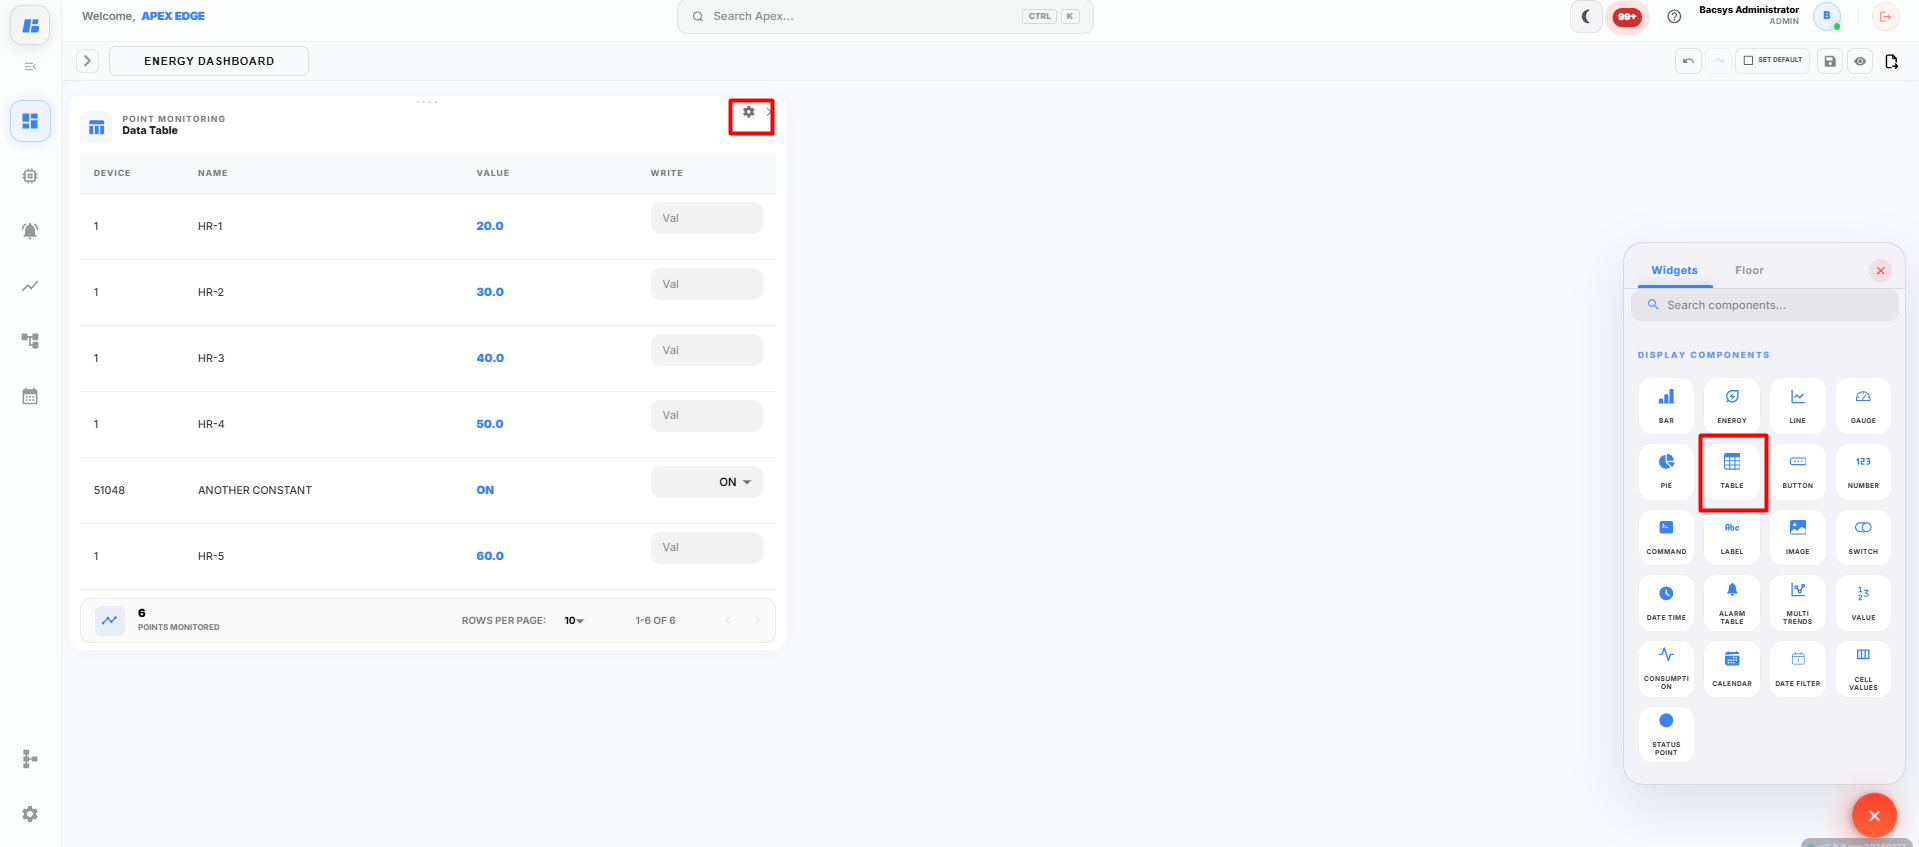
The Widget Settings panel appears.
-
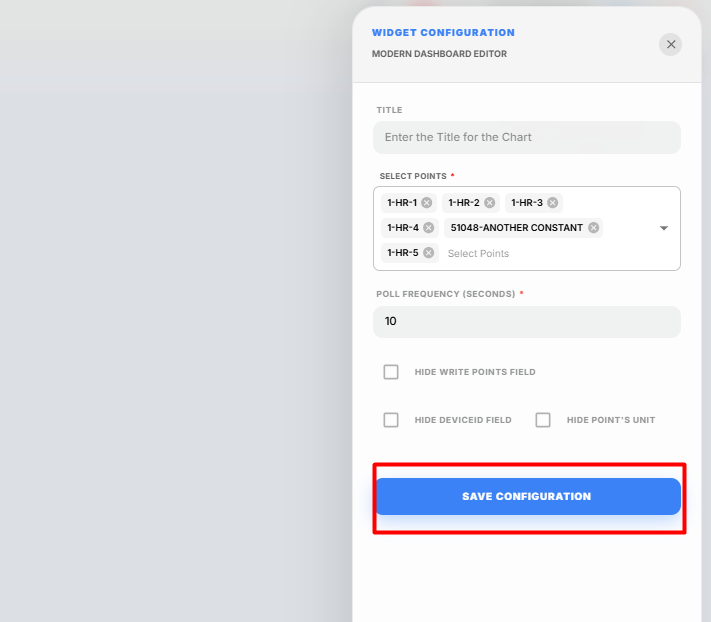
Configure the widget using the following settings.
Field Description Title Enter a title for the Table widget. Select Points Select the points to display in the table. Multiple points can be selected. Poll Frequency (Seconds) Specify how frequently the widget refreshes the displayed point values. Hide Write Points Field Hides the write point column from the table. Hide Device ID Field Hides the Device ID column from the table. Hide Point's Unit Hides the Point Unit column from the table. -
Click Select Points and choose the required points that you want to display in the table.
-
Configure the required Poll Frequency.
-
Select any of the following options if required:
- Hide Write Points Field – Hides the write points column from the table.
- Hide Device ID Field – Hides the Device ID column from the table.
- Hide Point's Unit – Hides the Point Unit column from the table.
These options allow you to customize the information displayed in the Table widget.
-
Click Save Configuration.
The configured Table widget is displayed on the canvas and begins showing the live values of the selected points.
Saving the Display
After configuring the Table widget:
-
Click Save on the display toolbar.
The display is saved successfully, and the Table widget is available on the display canvas for monitoring multiple point values in a tabular format.
Button Widget
The Button widget allows users to create a navigation button that opens another display within the platform. It provides an easy way to switch between different dashboards or display pages.
Adding a Button Widget
-
Click the + icon on the display canvas.
-
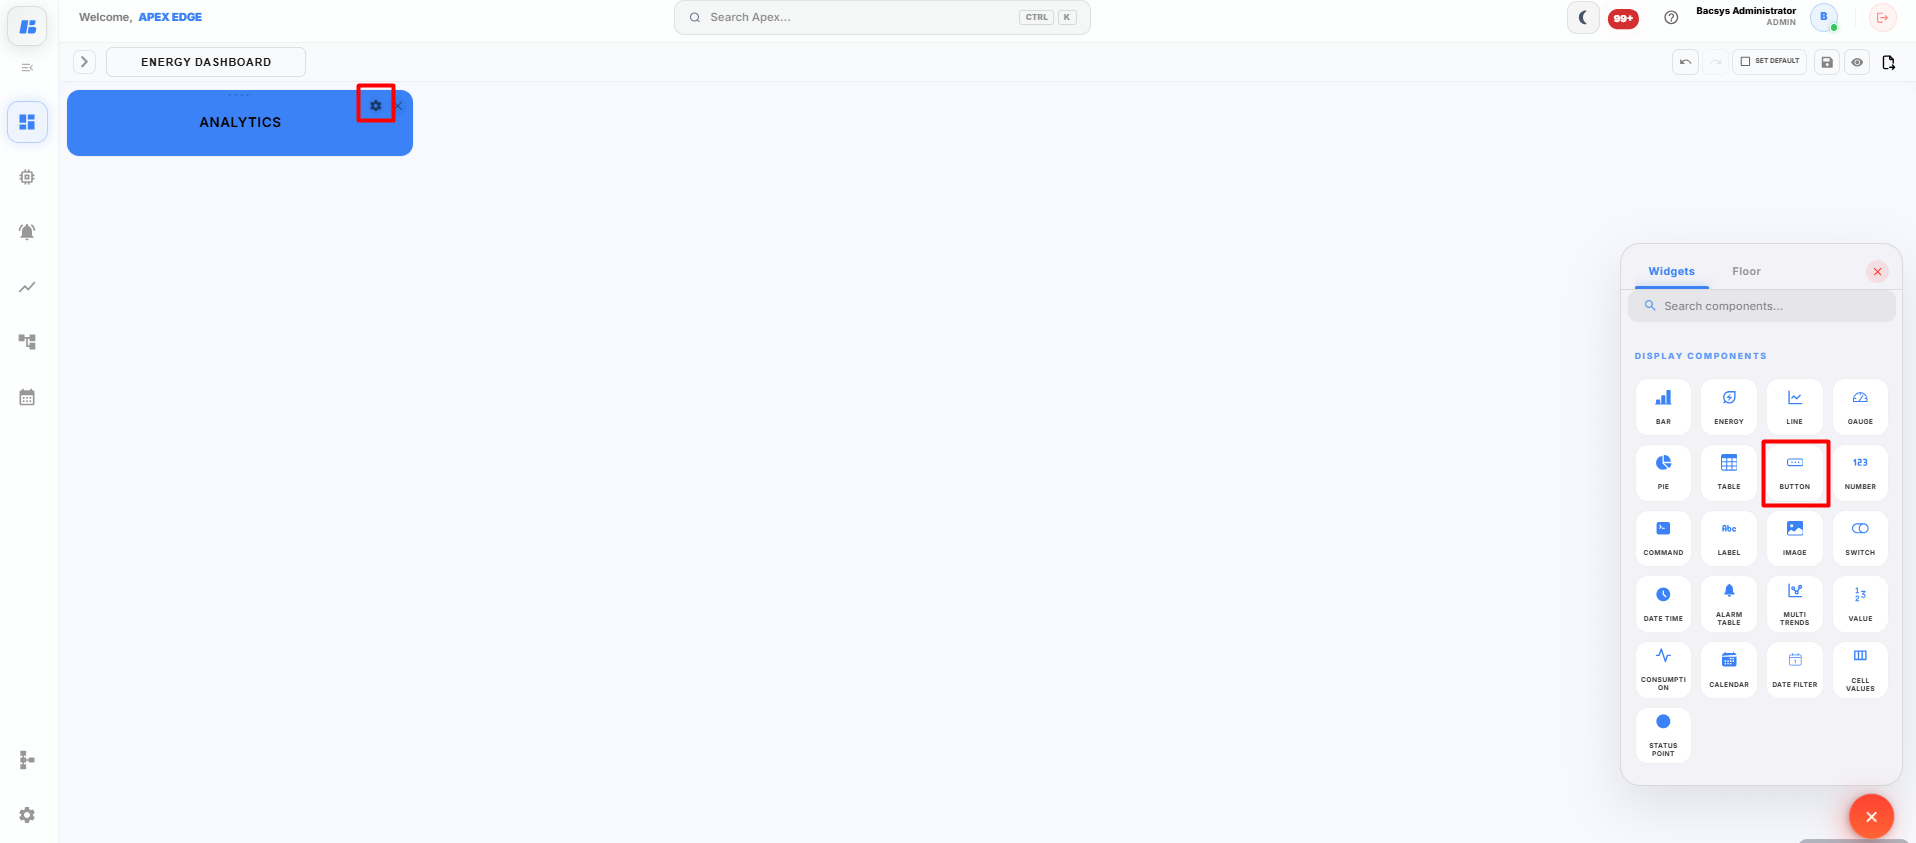
Drag and drop the Button widget onto the canvas.
The Widget Settings panel appears.
-
Configure the widget using the following settings.
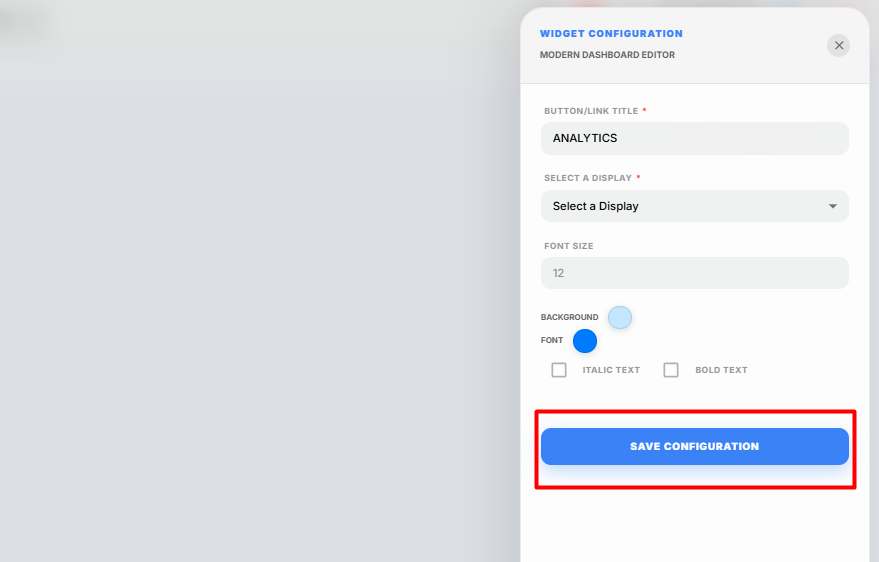
Field Description Button/Link Title Enter the text that will be displayed on the button. Select a Display Select the display that should open when the button is clicked. Font Size Specify the font size for the button text. Background Select the background color of the button. Font Select the font color for the button text. Italic Text Enable this option to display the button text in italic style. Bold Text Enable this option to display the button text in bold style. -
Enter the required Button/Link Title.
-
Select the destination display from the Select a Display dropdown.
Note: At least one display must already exist before it can be selected for navigation.
-
Specify the required Font Size.
-
Choose the preferred Background and Font colors.
-
Enable Italic Text or Bold Text if required.
-
Click Save Configuration.
The Button widget is added to the display canvas.
Using the Button Widget
After the display is saved, click the configured Button on the dashboard to navigate directly to the selected display.
Saving the Display
After configuring the Button widget:
-
Click Save on the display toolbar.
The display is saved successfully, and the Button widget is available for navigating between displays.
Number Widget
The Number widget displays the real-time value of a selected point in a simple numeric format, making it easy to monitor important measurements at a glance.
Adding a Number Widget
-
Click the + icon on the display canvas.
-
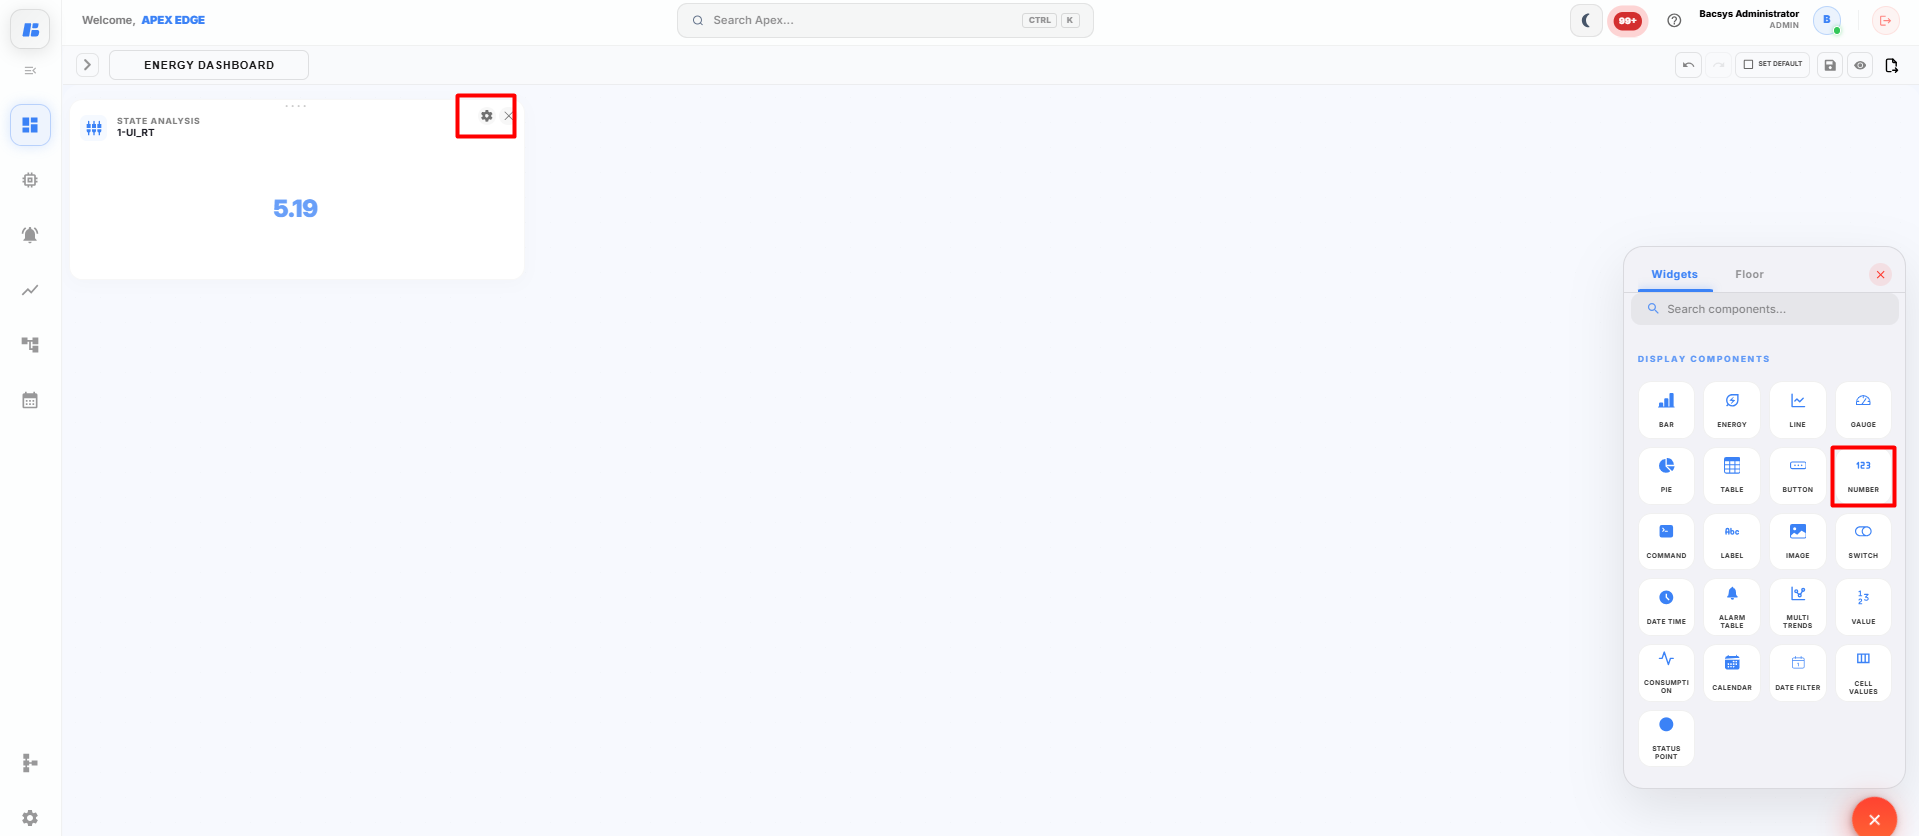
Drag and drop the Number widget onto the canvas.
The Widget Settings panel appears.
-
Configure the widget using the following settings.
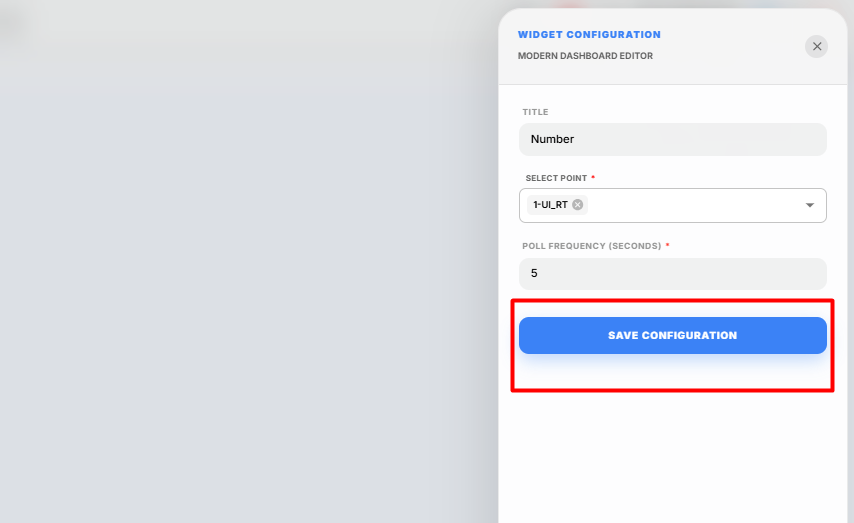
Field Description Title Enter a title for the Number widget. Select Point Select the point whose live value you want to display. Poll Frequency (Seconds) Specify how frequently the widget refreshes the displayed value. -
Enter the required Title.
-
Click Select Point and choose the point that you want to monitor.
Note: Only one point can be selected for the Number widget.
-
Configure the required Poll Frequency.
-
Click Save Configuration.
The Number widget is added to the display canvas and begins displaying the live value of the selected point.
Viewing the Number Widget
After the widget is configured:
- The selected point value is displayed in real time.
- The displayed value is automatically refreshed based on the configured Poll Frequency.
- Any change in the point value is reflected automatically in the widget.
Saving the Display
After configuring the Number widget:
-
Click Save on the display toolbar.
The display is saved successfully, and the Number widget is available on the display canvas for real-time monitoring.
Command Widget
The Command widget allows users to send commands or write values to a selected writable point directly from the display dashboard. It provides a simple interface for controlling devices in real time.
Adding a Command Widget
-
Click the + icon on the display canvas.
-
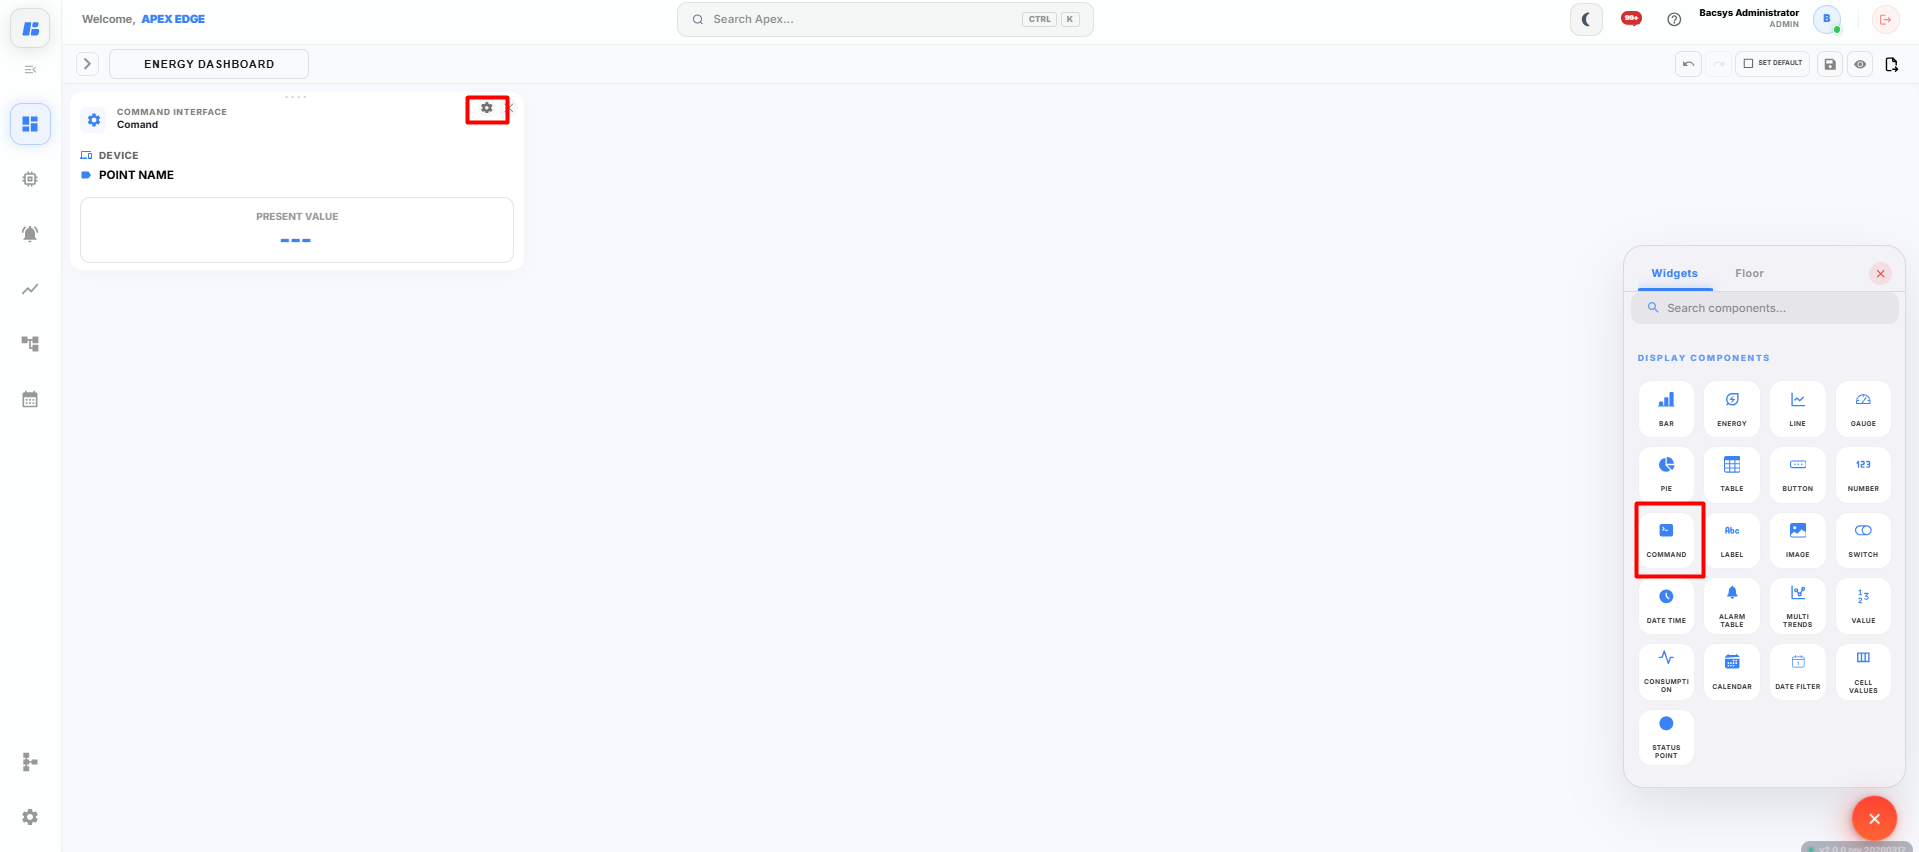
Drag and drop the Command widget onto the canvas.
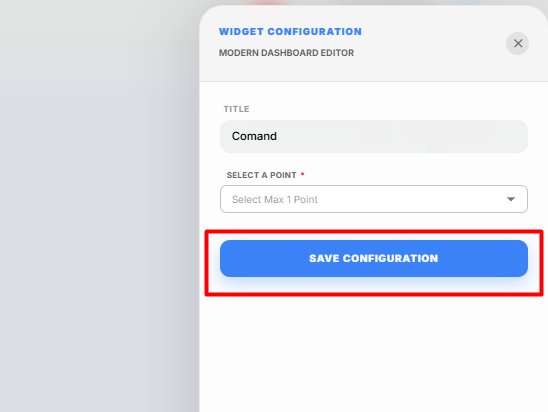
The Widget Settings panel appears.
-
Configure the widget using the following settings.
Field Description Title Enter a title for the Command widget. Select a Point Select the writable point that will receive the command. -
Enter the required Title.
-
Click Select a Point and choose the point that you want to control.
Note: The selected point must support Write or Read/Write operations. Read-only points cannot be controlled using the Command widget.
-
Click Save Configuration.
The Command widget is added to the display canvas.
Using the Command Widget
After the widget is configured:
- Open the display containing the Command widget.
- Enter or select the required command/value.
- Execute the command.
- The value is written to the selected point, and the device updates accordingly if the operation is successful.
Saving the Display
After configuring the Command widget:
-
Click Save on the display toolbar.
The display is saved successfully, and the Command widget is available for controlling the selected writable point from the dashboard.
Label Widget
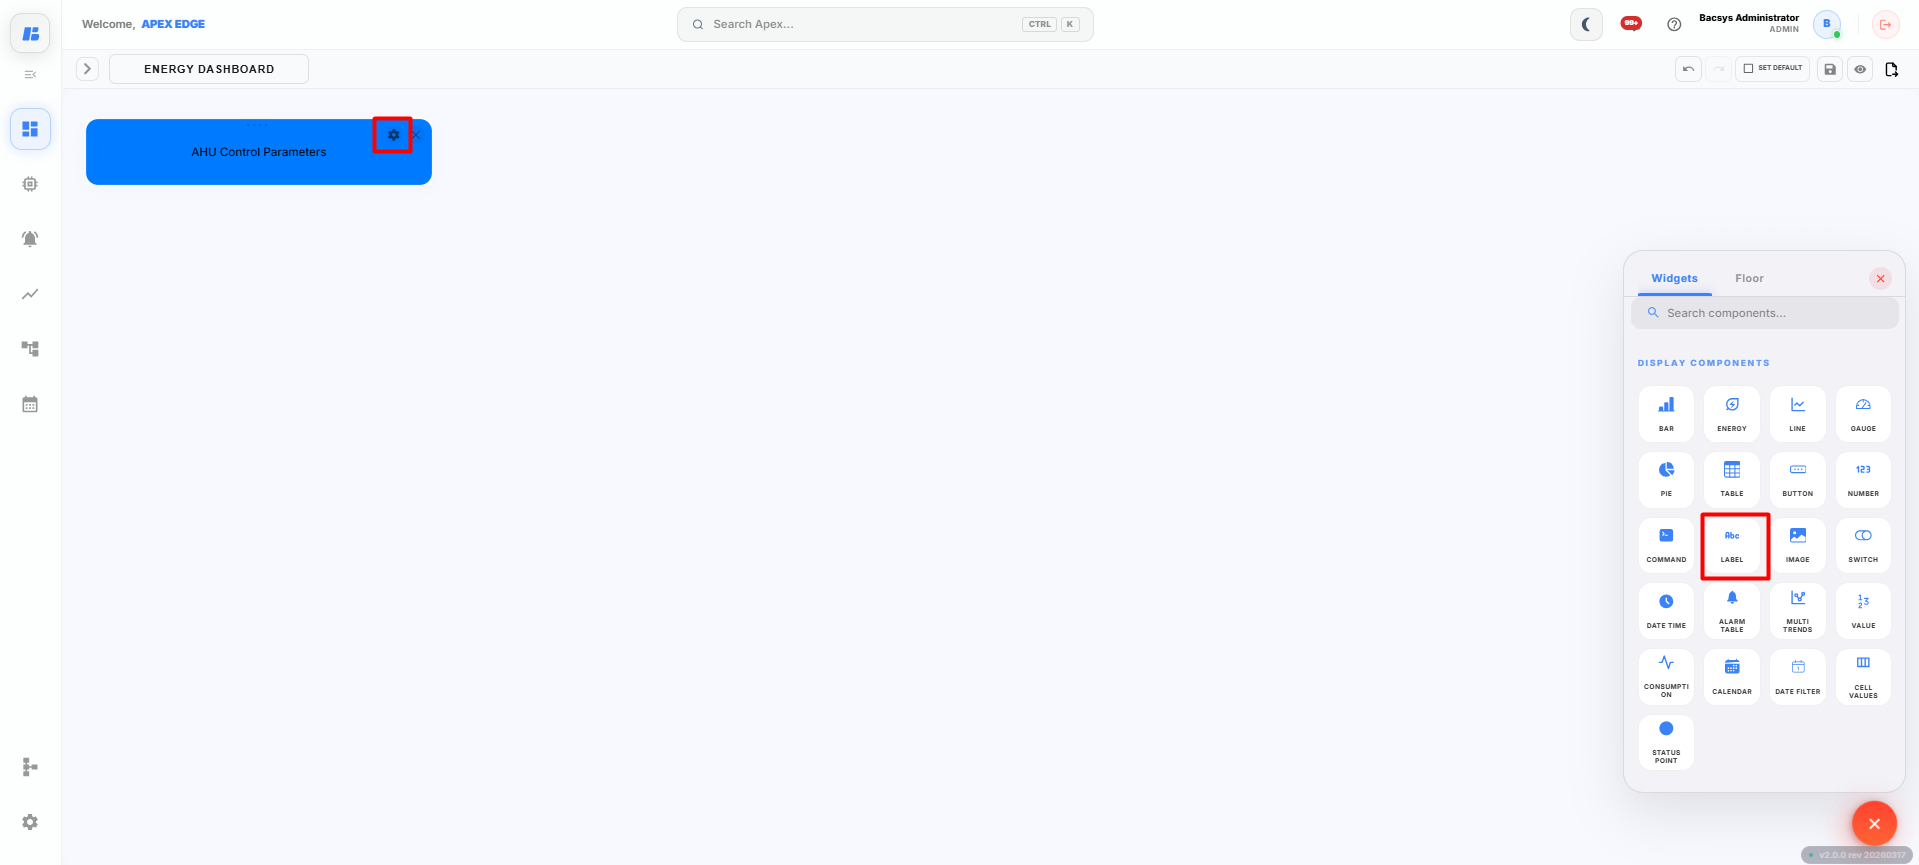
The Label widget allows users to add static text to the display canvas. It can be used to display section headings, equipment names, descriptions, or any custom text to improve the readability and organization of the dashboard.
Adding a Label Widget
-
Click the + icon on the display canvas.
-
Drag and drop the Label widget onto the canvas.
The Widget Settings panel appears.
-
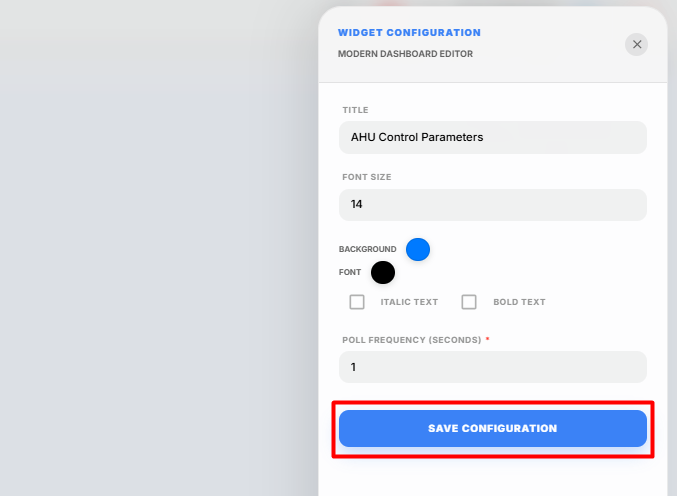
Configure the widget using the following settings.
Field Description Title Enter the text that you want to display as the label. Font Size Specify the size of the label text. Background Select the background color of the label. Font Select the text color of the label. Italic Text Enable this option to display the label text in italic style. Bold Text Enable this option to display the label text in bold style. Poll Frequency (Seconds) Specify how frequently the widget refreshes. -
Enter the required Title.
The entered title is displayed as the label on the dashboard.
-
Specify the required Font Size.
-
Select the preferred Background and Font colors.
-
Enable Italic Text or Bold Text if required.
-
Configure the required Poll Frequency.
-
Click Save Configuration.
The Label widget is added to the display canvas.
Using the Label Widget
The Label widget is commonly used to:
- Display dashboard titles.
- Identify equipment or devices.
- Create section headings.
- Improve the organization and readability of the display.
Saving the Display
After configuring the Label widget:
-
Click Save on the display toolbar.
The display is saved successfully, and the Label widget appears on the dashboard with the configured text and formatting.
Image Widget
The Image widget allows users to upload and display images on the dashboard. It can be used to add equipment images, floor plans, company logos, process diagrams, or any other visual element to enhance the display.
Adding an Image Widget
-
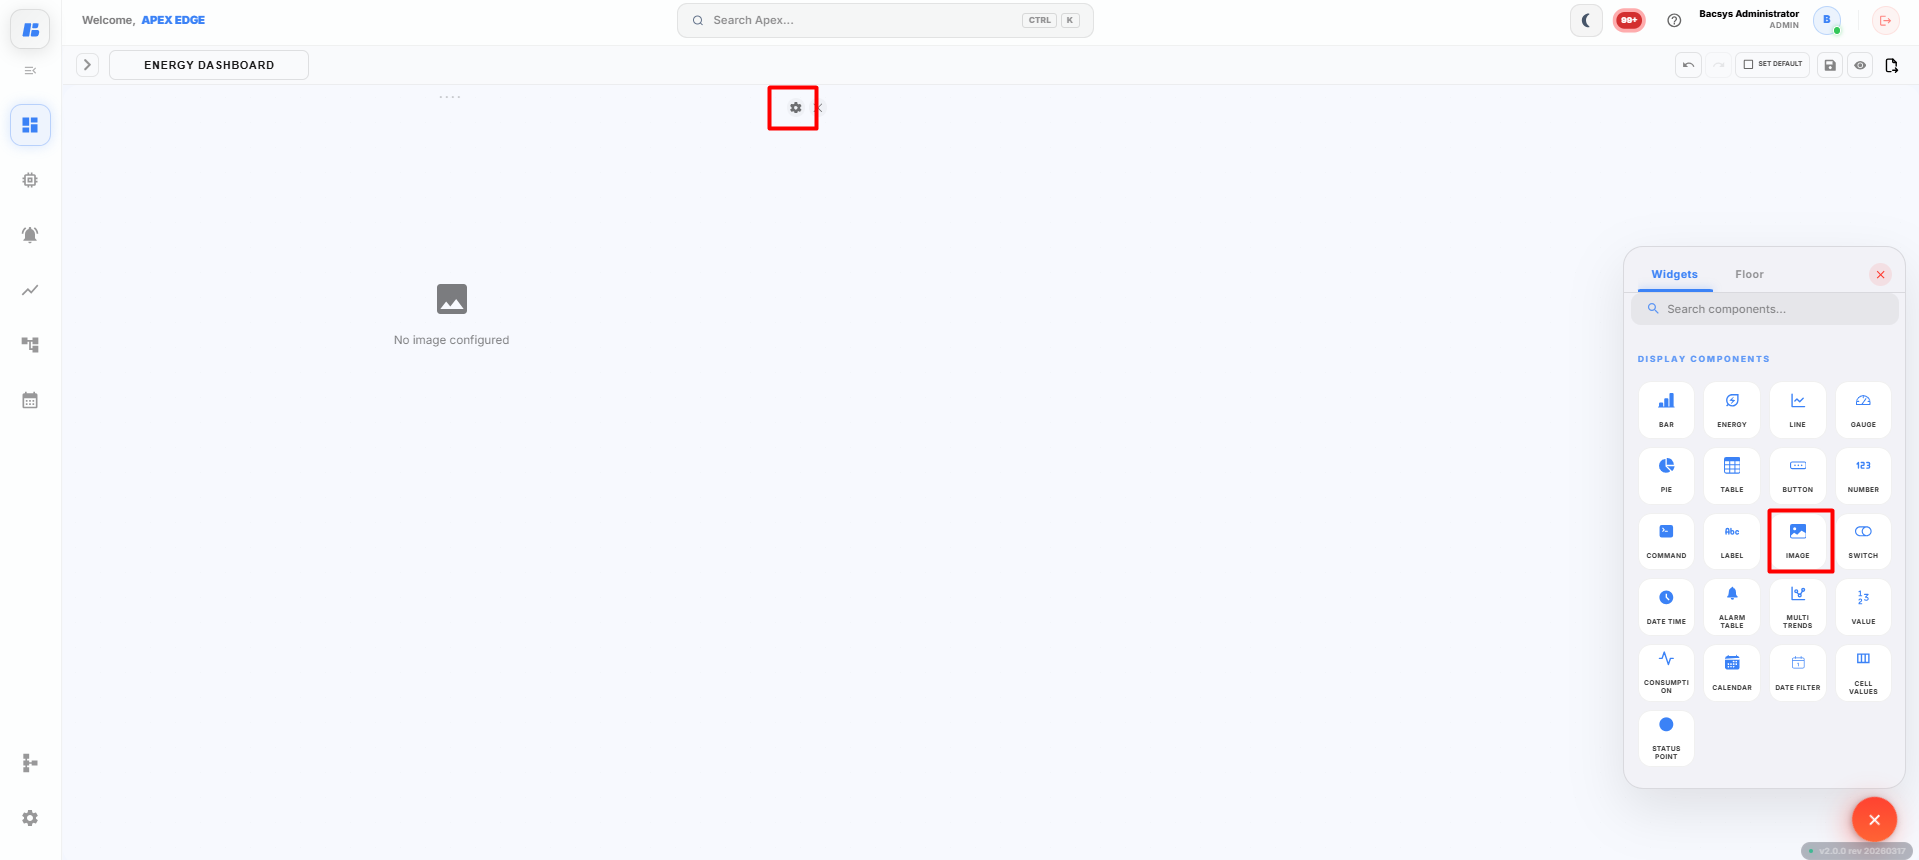
Click the + icon on the display canvas.
-
Drag and drop the Image widget onto the canvas.
The Widget Settings panel appears.
-
Upload the required image.
You can upload an image using either of the following methods:
- Drag and drop the image into the upload area.
- Click the upload area and browse to select an image from your local system.
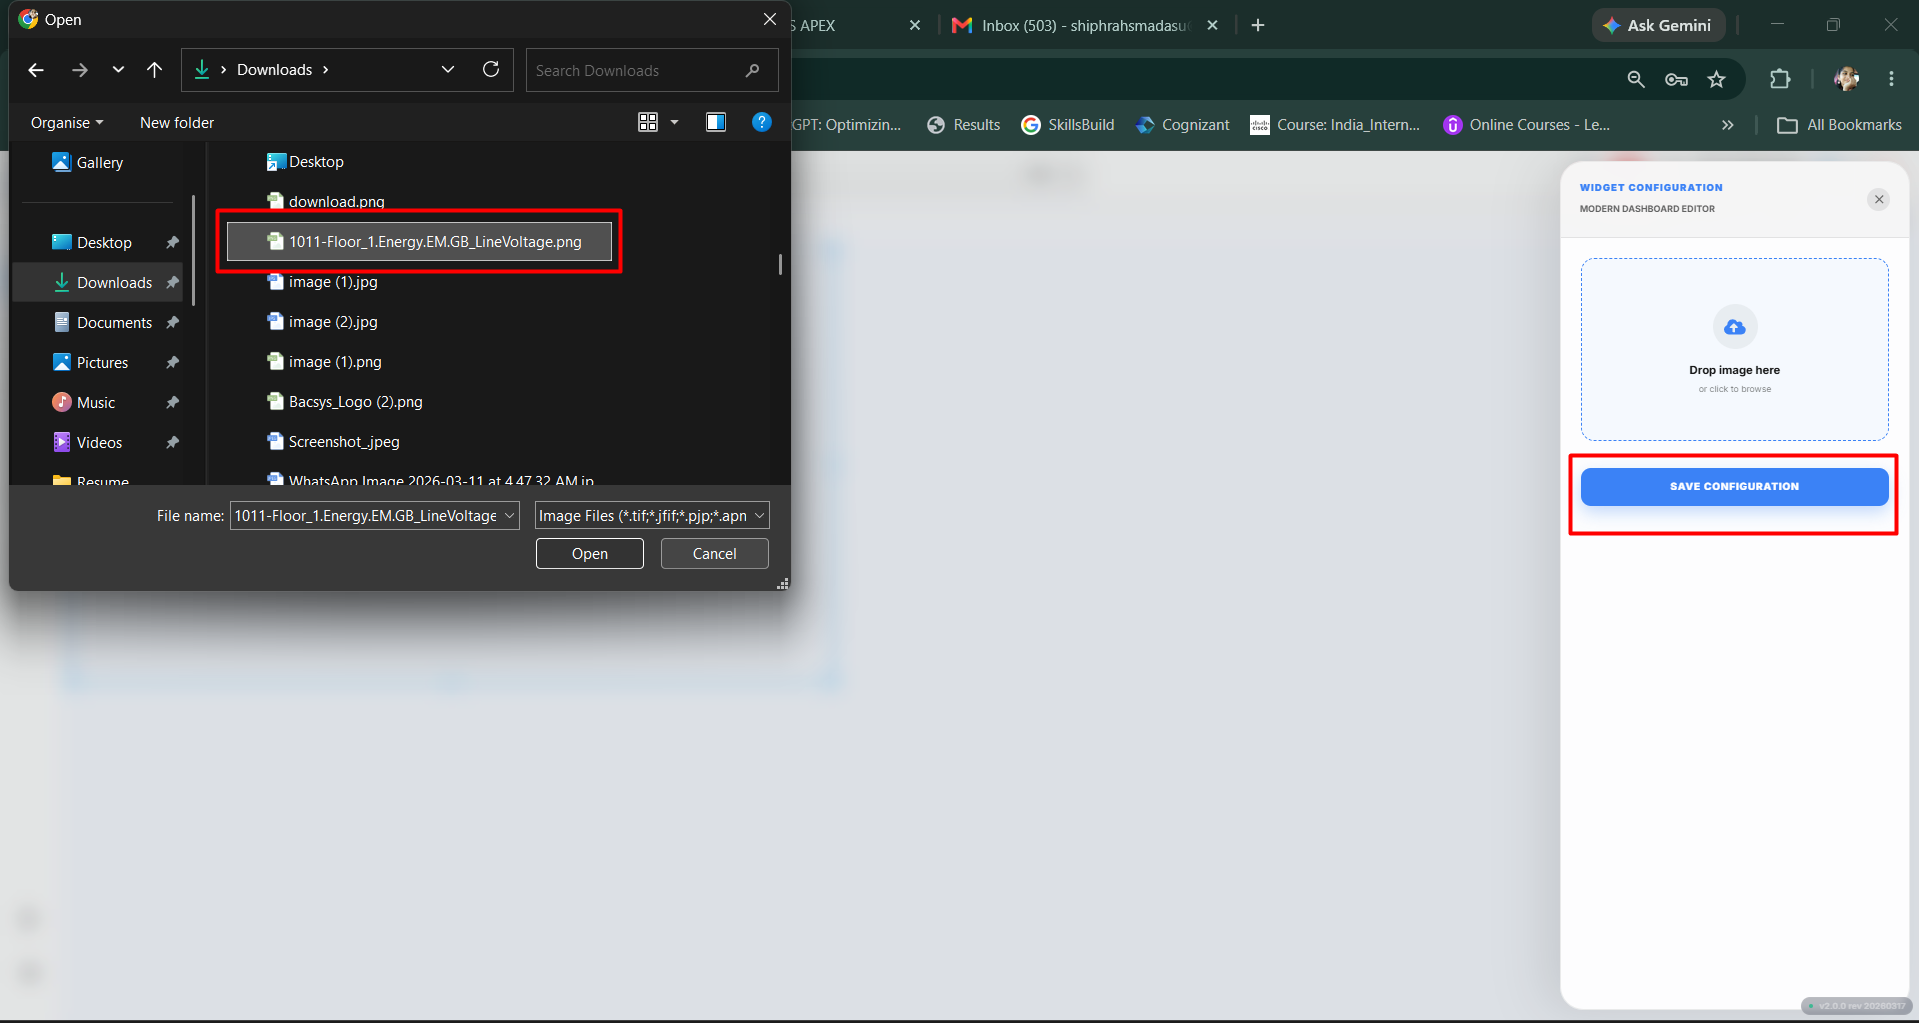
Note: It is recommended to upload optimized image files to improve dashboard loading performance.
-
After selecting the image, click Save Configuration.
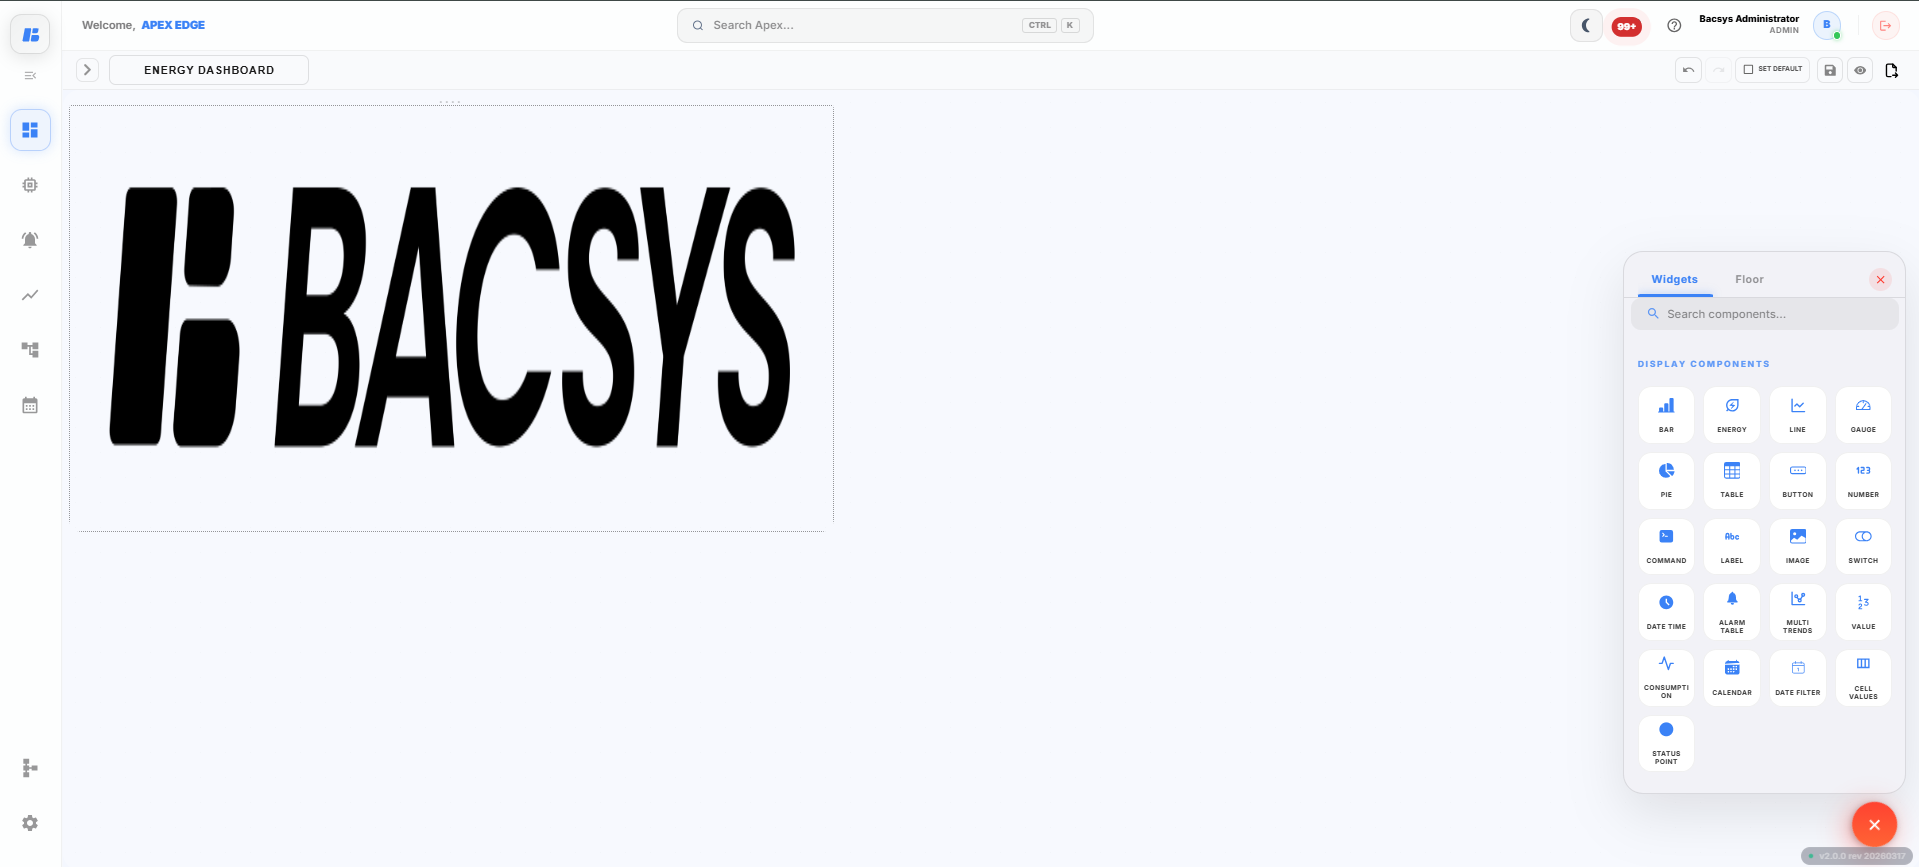
The selected image is uploaded and added to the display canvas.
Using the Image Widget
The Image widget can be used to display:
- Equipment images
- Floor plans
- Building layouts
- Process flow diagrams
- Company logos
- Custom dashboard graphics
The uploaded image is displayed directly on the dashboard and can be positioned anywhere on the display canvas.
Saving the Display
After configuring the Image widget:
-
Click Save on the display toolbar.
The display is saved successfully, and the uploaded image appears on the dashboard.
Switch Widget
The Switch widget displays and controls the status of a selected digital point. It allows users to monitor the current state of the point and change its status directly from the display, provided the point supports write operations.
Adding a Switch Widget
-
Click the + icon on the display canvas.
-
Drag and drop the Switch widget onto the canvas.
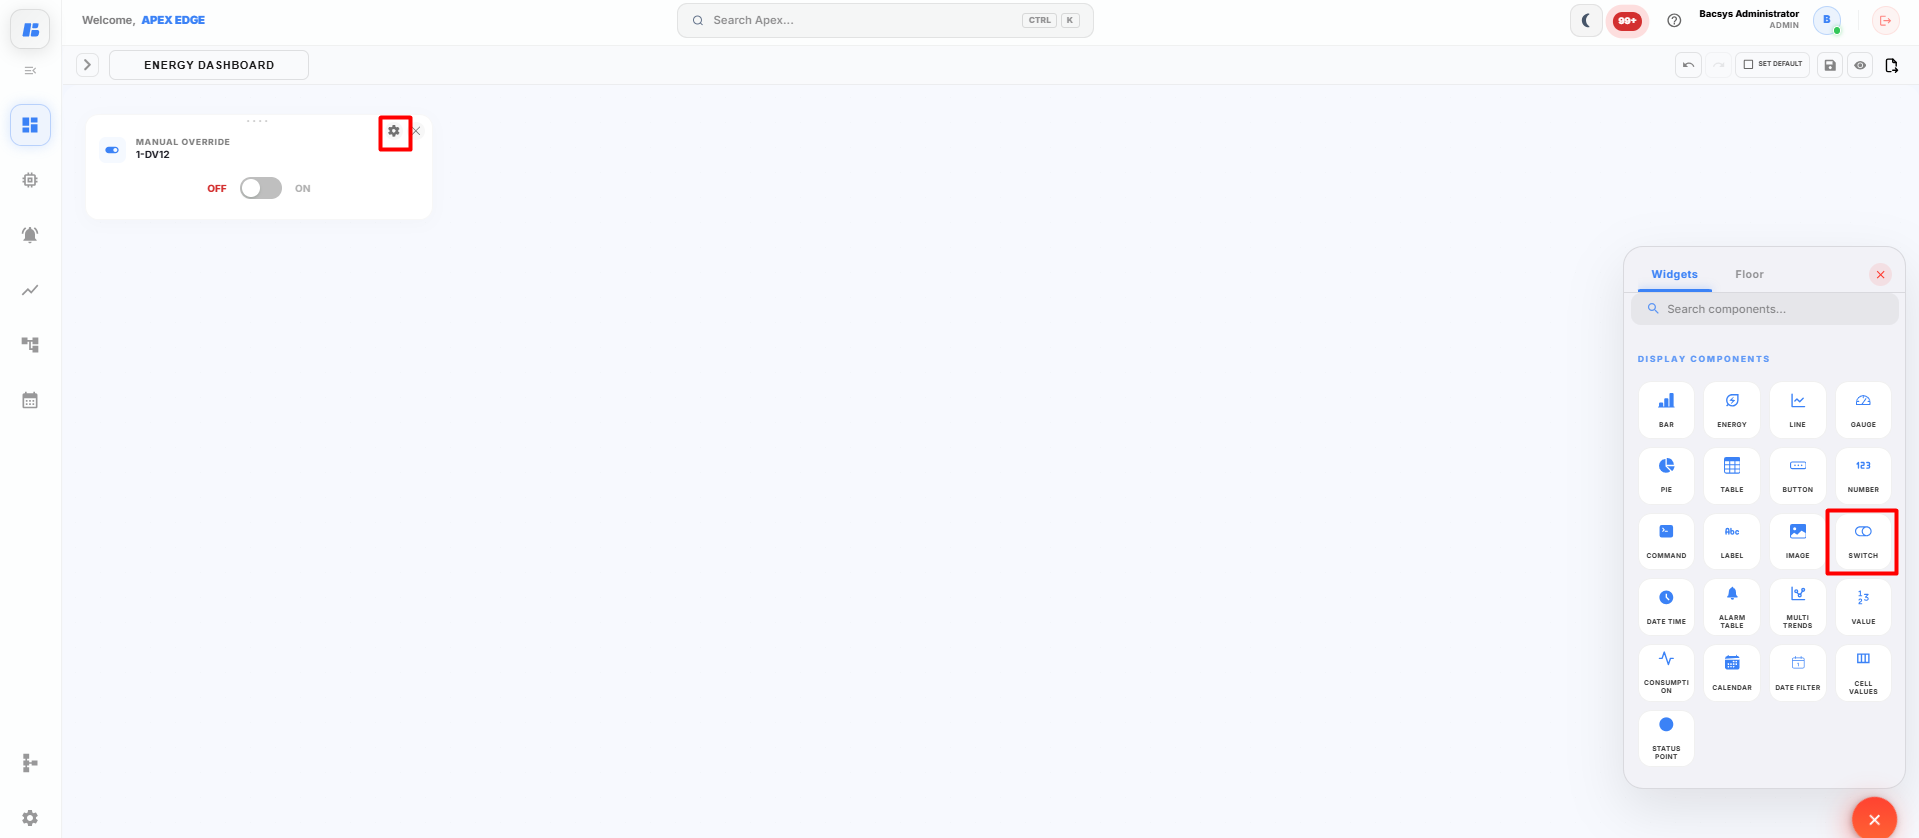
The Widget Settings panel appears.
-
Configure the widget using the following settings.
Field Description Title Enter a title for the Switch widget. Select Point Select the digital point to control or monitor. Font Size Specify the size of the title text. Background Select the background color of the widget. Font Select the font color for the title. Italic Text Enable this option to display the title in italic style. Bold Text Enable this option to display the title in bold style. Poll Frequency (Seconds) Specify how frequently the widget refreshes the point status. -
Enter the required Title.
-
Click Select Point and choose the required digital point.
Note: The selected point should support Write or Read/Write operations to allow switching between ON and OFF states. If a read-only point is selected, the widget will display only the current status.
-
Configure the required Font Size.
-
Select the preferred Background and Font colors.
-
Enable Italic Text or Bold Text if required.
-
Configure the required Poll Frequency.
-
Click Save Configuration.
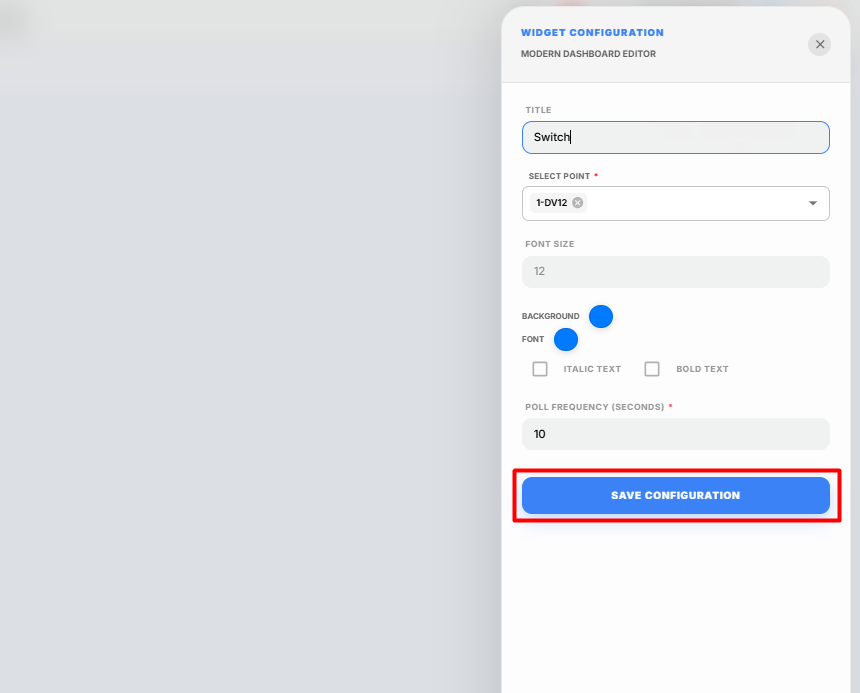
The Switch widget is added to the display canvas.
Using the Switch Widget
After the widget is configured:
- The current status of the selected point is displayed.
- Toggle the switch to change the point state between ON and OFF, if the point supports write operations.
ON
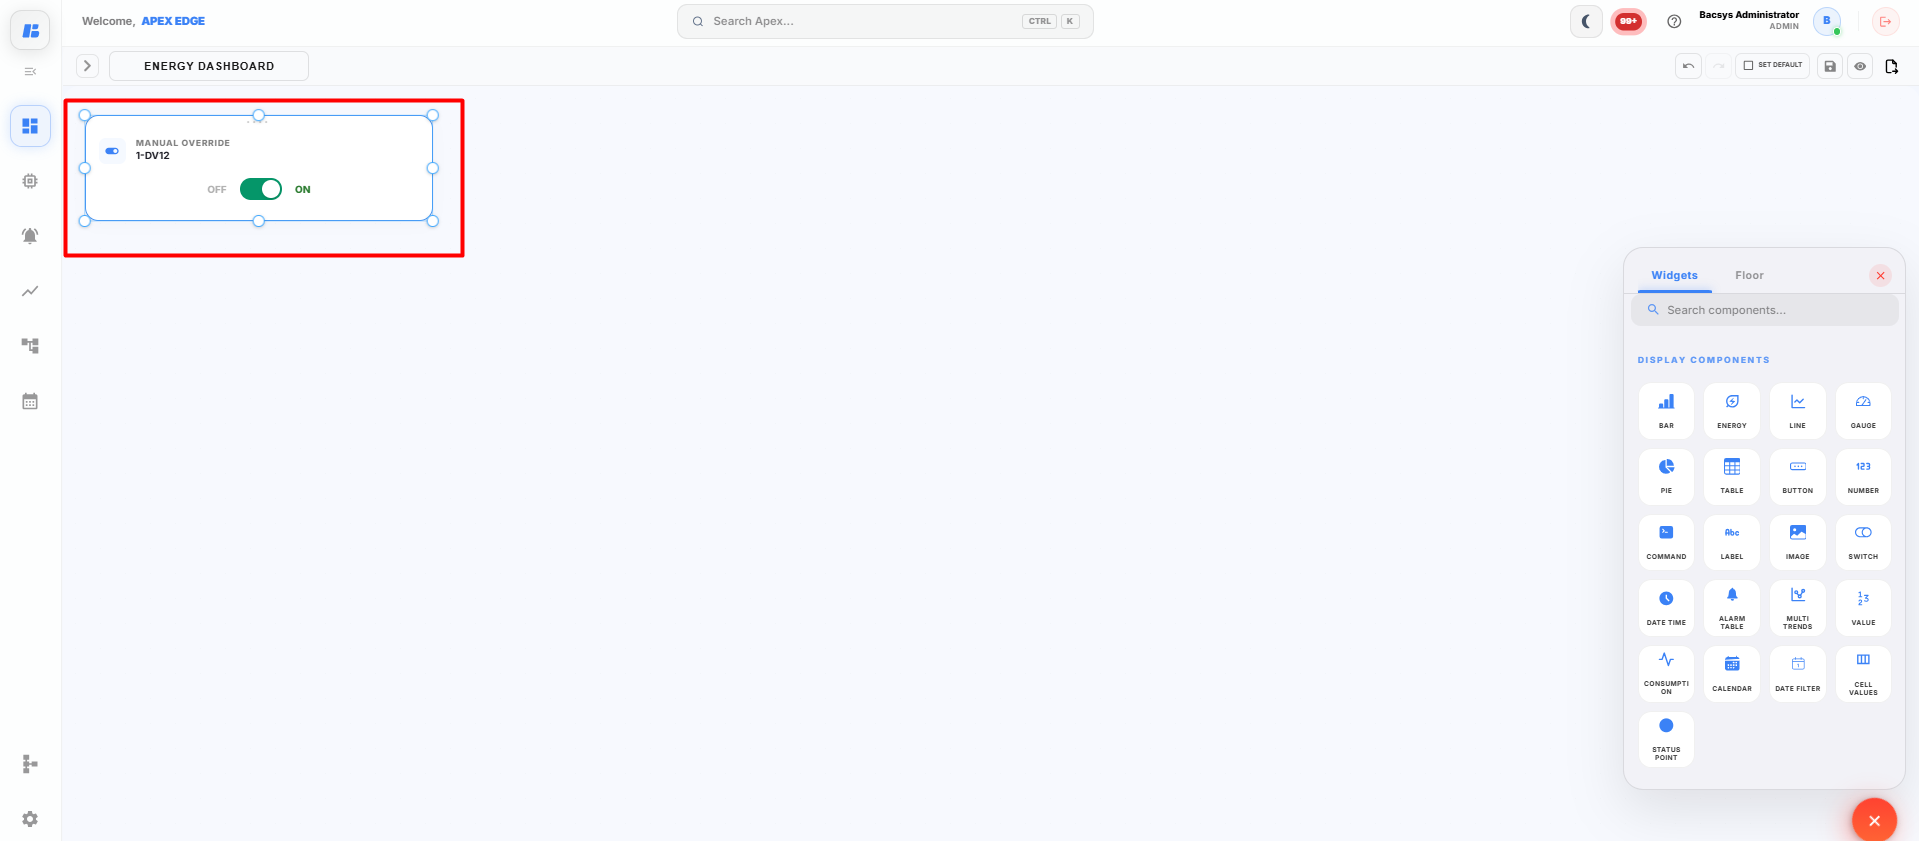
- The displayed status is automatically refreshed based on the configured Poll Frequency.
Saving the Display
After configuring the Switch widget:
-
Click Save on the display toolbar.
The display is saved successfully, and the Switch widget is available on the dashboard for monitoring and controlling the selected point.
Date & Time Widget
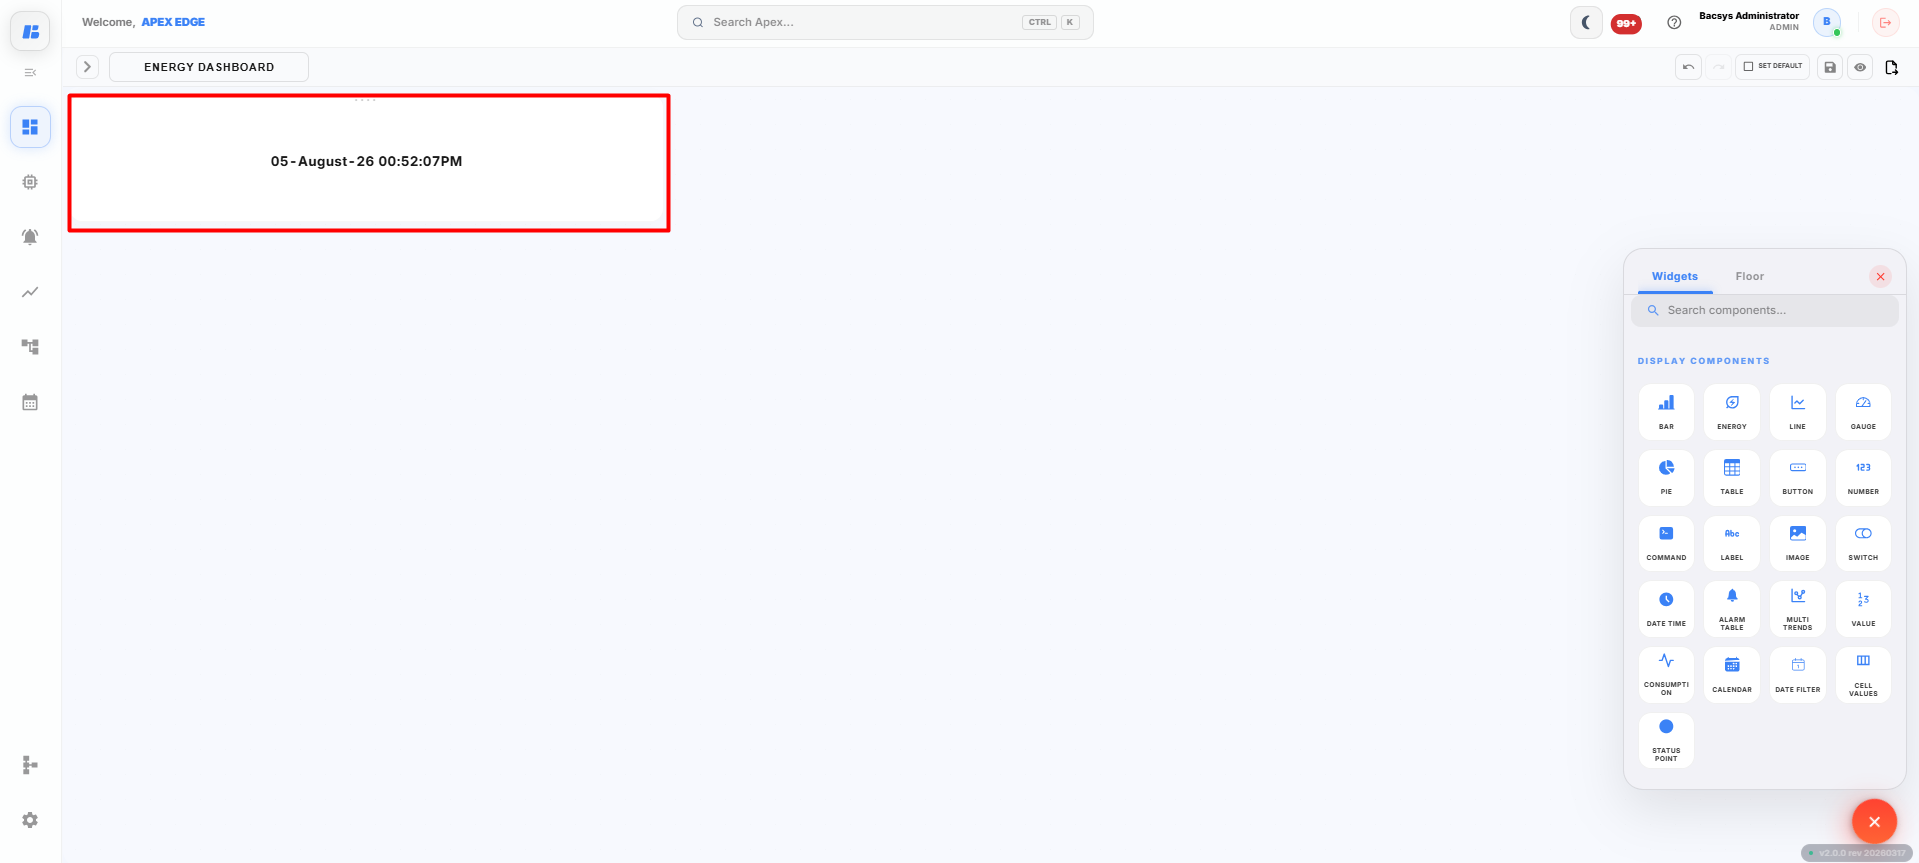
The Date & Time widget displays the current system date and time on the dashboard. It automatically updates to show the latest date and time without requiring any point configuration.
Adding a Date & Time Widget
-
Click the + icon on the display canvas.
-
Drag and drop the Date & Time widget onto the canvas.
The widget is added immediately to the display.
No additional configuration is required.
Viewing the Date & Time Widget
After the widget is added to the display, it automatically shows:
- Current Date
- Current Time
The displayed date and time are updated automatically while the dashboard is running.
Saving the Display
After placing the Date & Time widget on the canvas:
-
Click Save on the display toolbar.
The display is saved successfully, and the Date & Time widget continues to display the current date and time on the dashboard.
Alarm Table Widget
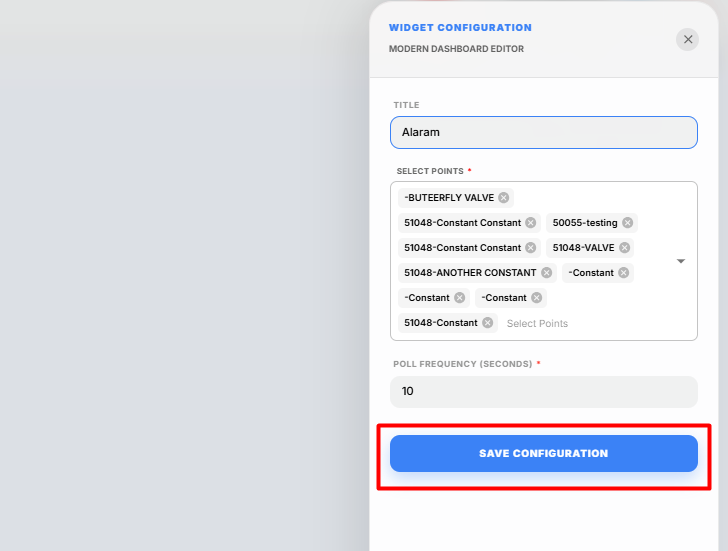
The Alarm Table widget displays the alarm status of selected points in a tabular format. It allows users to monitor active alarms for multiple points directly from the display dashboard.
Adding an Alarm Table Widget
-
Click the + icon on the display canvas.
-
Drag and drop the Alarm Table widget onto the canvas.
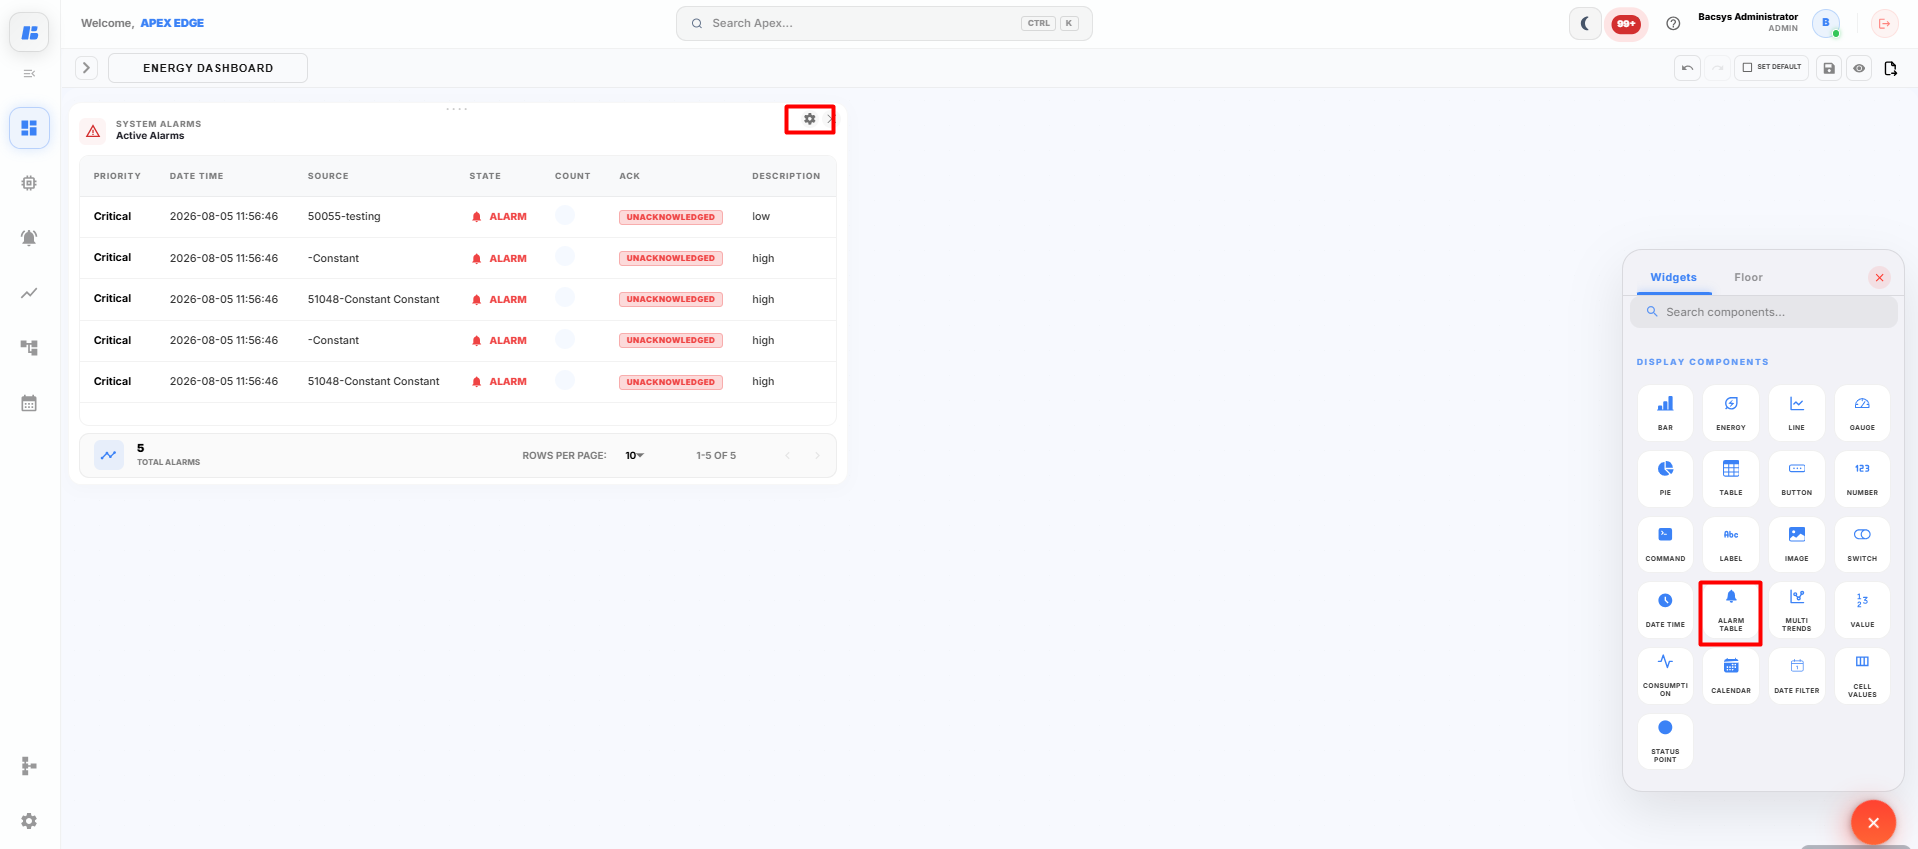
The Widget Settings panel appears.
-
Configure the widget using the following settings.
Field Description Title Enter a title for the Alarm Table widget. Select Points Select one or more points whose alarm status you want to monitor. Poll Frequency (Seconds) Specify how frequently the widget refreshes the alarm status. -
Enter the required Title.
-
Click Select Points and select the required points.
Note: Before selecting the points, ensure that Alarm Configuration is enabled for those points. Navigate to Devices → Select the Point → Config → Alarms, configure the required alarm thresholds, and click Save Alarm Configuration. Only points with configured alarms can display alarm information in the Alarm Table widget.
-
Configure the required Poll Frequency.
-
Click Save Configuration.
The Alarm Table widget is added to the display canvas.
Viewing Alarm Information
After the widget is configured:
- The alarm status of the selected points is displayed in a table.
- Active alarms are updated automatically based on the configured Poll Frequency.
- If no alarms are active, the widget displays the current alarm status for the selected points.
Saving the Display
After configuring the Alarm Table widget:
-
Click Save on the display toolbar.
The display is saved successfully, and the Alarm Table widget is available on the dashboard for monitoring the alarm status of the selected points.ld Description Title Enter a title for the Alarm Table widget. Select Points Select the points whose alarm status will be displayed. Multiple points can be selected. Poll Frequency (Seconds) Specify how frequently the widget refreshes the alarm status. -
Enter the required Title.
-
Click Select Points and choose the required points to monitor.
Note: Ensure that alarms are configured and enabled for the selected points. Only configured alarms are displayed in the Alarm Table widget.
-
Configure the required Poll Frequency.
-
Click Save Configuration.
The Alarm Table widget is added to the display canvas.
Viewing Alarm Information
After the widget is configured:
- Active alarms for the selected points are displayed.
- The alarm status is automatically refreshed based on the configured Poll Frequency.
- If no alarms are active, the widget displays the current alarm status accordingly.
Saving the Display
After configuring the Alarm Table widget:
-
Click Save on the display toolbar.
The display is saved successfully, and the Alarm Table widget is available on the dashboard for monitoring alarm status.
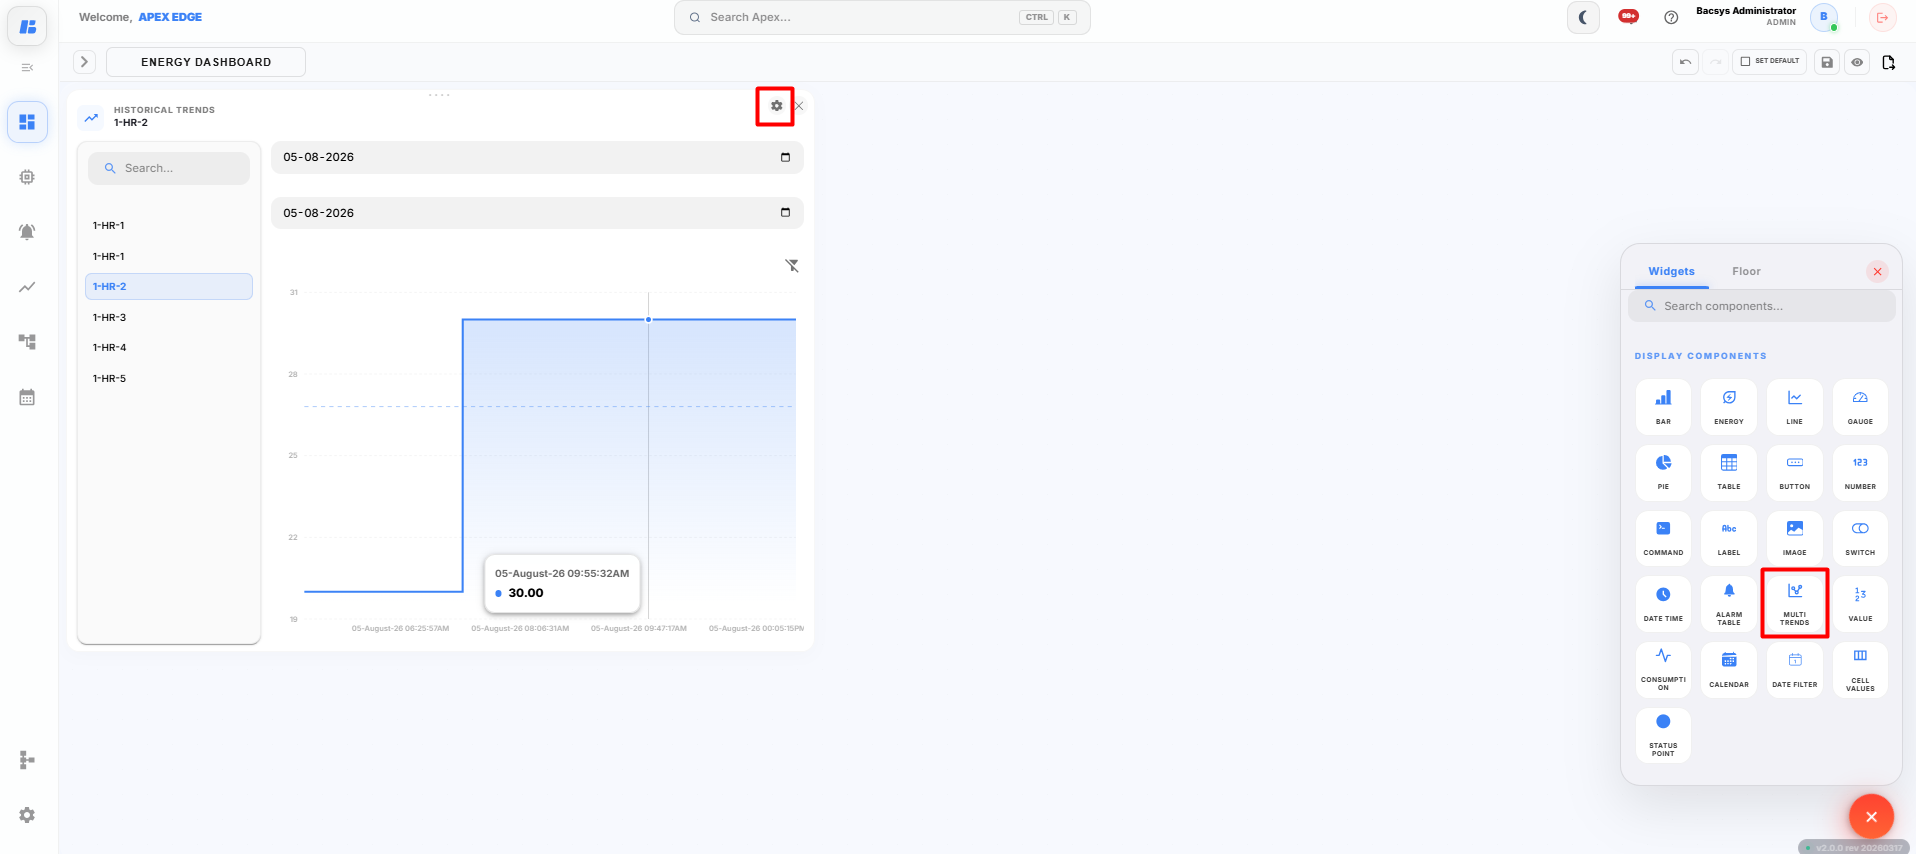
Multi Trends Widget
The Multi Trends widget allows users to compare the historical trend data of multiple points on a single chart. It provides an easy way to analyze and compare the trend values of different points over the same time period.
Adding a Multi Trends Widget
-
Click the + icon on the display canvas.
-
Drag and drop the Multi Trends widget onto the canvas.
The Widget Settings panel appears.
-
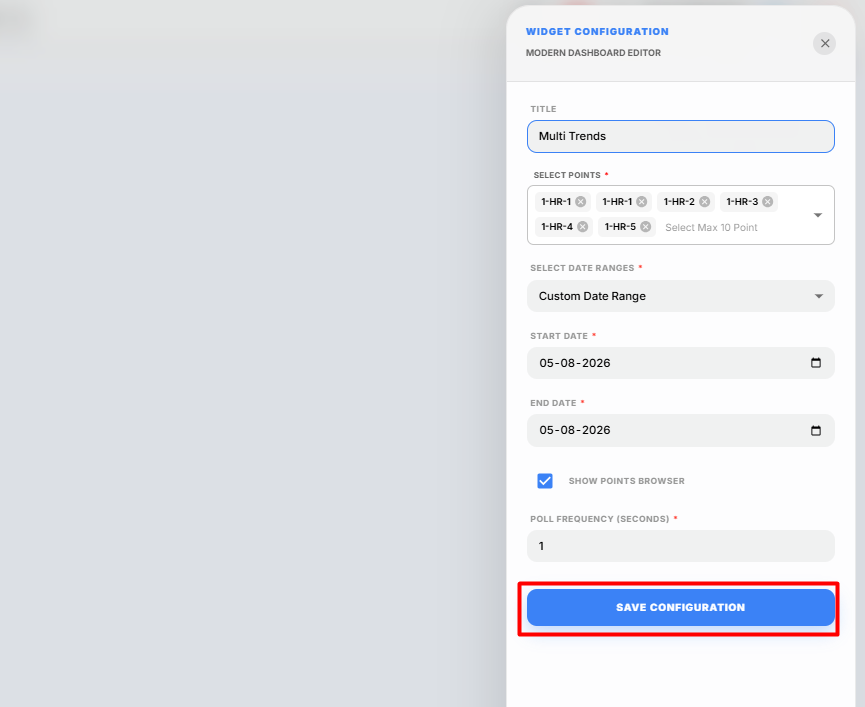
Configure the widget using the following settings.
Field Description Title Enter a title for the Multi Trends widget. Select Points Select up to 10 trend-enabled points to display on the same chart. Select Date Range Select the period for displaying historical trend data. Start Date Specify the start date when Custom Date Range is selected. End Date Specify the end date when Custom Date Range is selected. Show Points Browser Enable this option to display the points browser within the widget for quick point selection and navigation. Poll Frequency (Seconds) Specify how frequently the widget refreshes the displayed trend data. Note: Before selecting points, ensure that Trend Logging is enabled for the required points. Navigate to Devices → Select the Point → Config → Trends, enable Data Logging, configure the required trend settings, and click Save Trend Configuration. Only trend-enabled points can display historical data in the Multi Trends widget.
-
Enter the required Title.
-
Click Select Points and select up to 10 trend-enabled points.
-
Select the required Date Range.
Available options include:
- Last 1 Day
- Last 2 Days
- Last 7 Days
- Custom Date Range
If Custom Date Range is selected, specify the Start Date and End Date.
-
Enable or disable the Show Points Browser option as required.
-
Configure the required Poll Frequency.
-
Click Save Configuration.
The Multi Trends widget is added to the display canvas.
Viewing Multi Trends
After the widget is configured:
- Historical trend data for all selected points is displayed on a single chart.
- Multiple trend lines can be compared simultaneously.
- The displayed trend data is automatically refreshed based on the configured Poll Frequency.
Saving the Display
After configuring the Multi Trends widget:
-
Click Save on the display toolbar.
The display is saved successfully, and the Multi Trends widget is available on the dashboard for comparing historical trend data from multiple points.
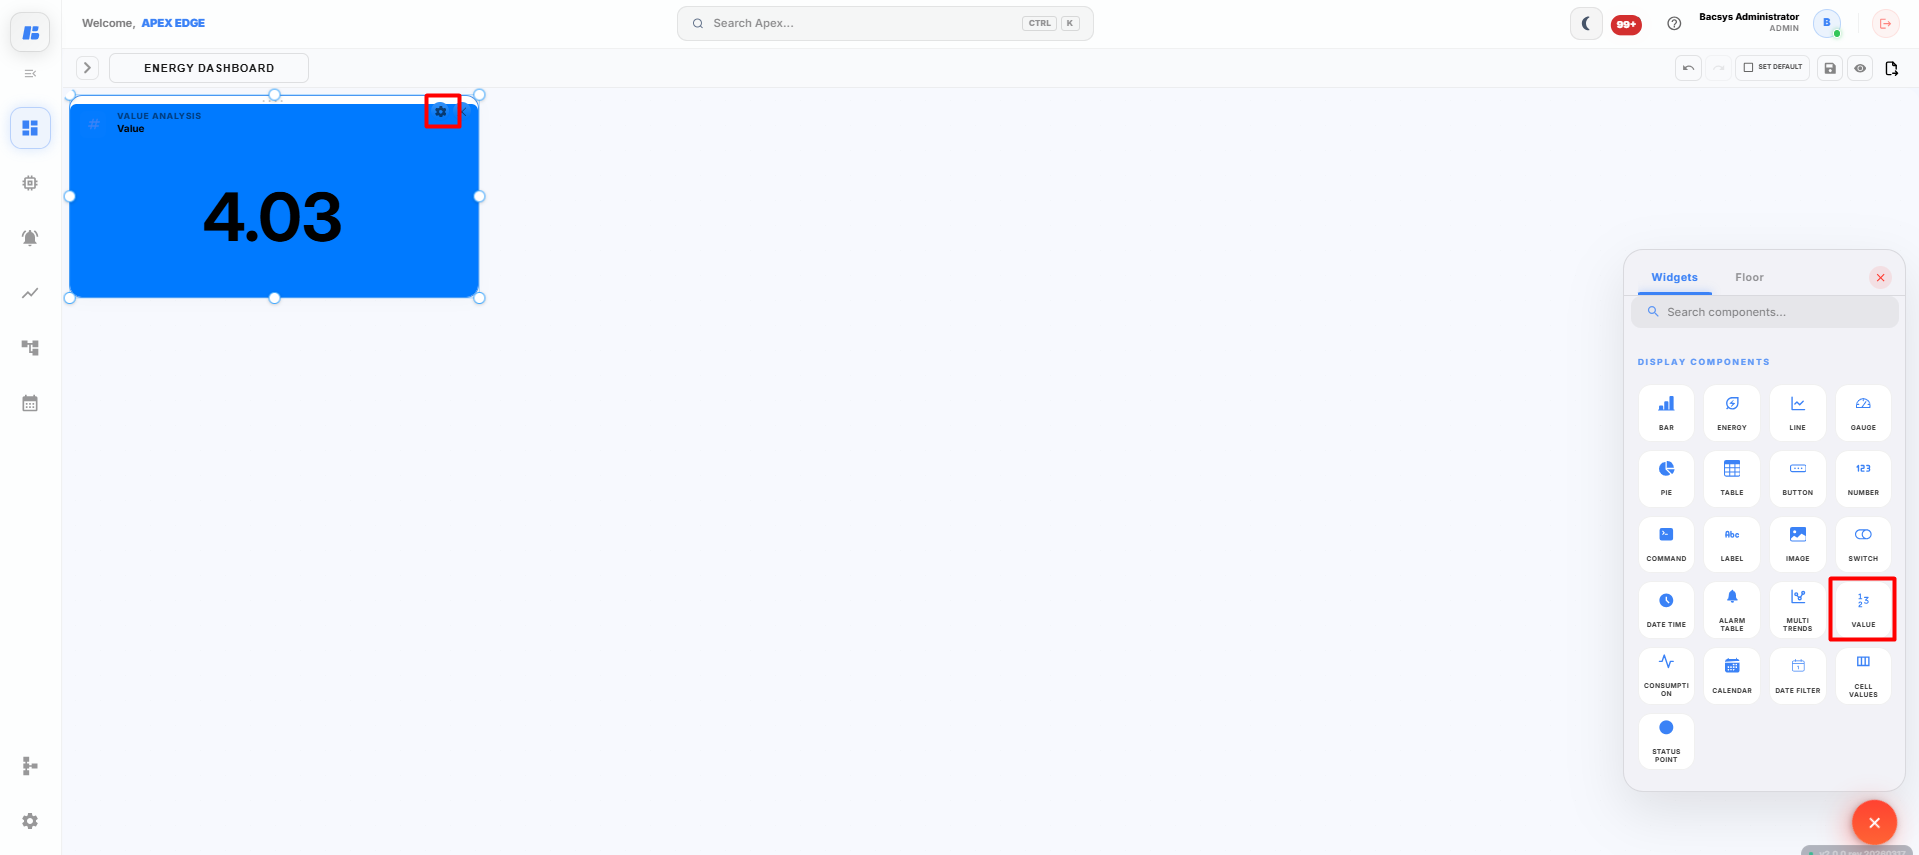
Values Widget
The Values widget displays the real-time value of a selected point in a simple and customizable format. It allows users to monitor a specific point value directly from the dashboard.
Adding a Values Widget
-
Click the + icon on the display canvas.
-
Drag and drop the Values widget onto the canvas.
The Widget Settings panel appears.
-
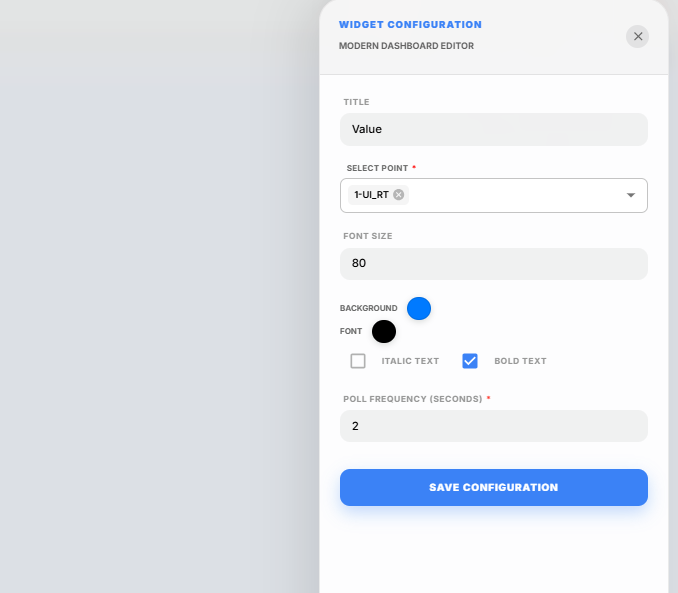
Configure the widget using the following settings.
Field Description Title Enter a title for the Values widget. Select Point Select the point whose value you want to display. Font Size Specify the font size for the displayed value. Background Select the background color of the widget. Font Select the font color for the displayed value. Italic Text Enable this option to display the text in italic style. Bold Text Enable this option to display the text in bold style. Poll Frequency (Seconds) Specify how frequently the widget refreshes the displayed value. -
Enter the required Title.
-
Click Select Point and choose the required point.
Note: Only one point can be selected for the Values widget.
-
Configure the required Font Size.
-
Select the preferred Background and Font colors.
-
Enable Italic Text or Bold Text if required.
-
Configure the required Poll Frequency.
-
Click Save Configuration.
The Values widget is added to the display canvas.
Viewing Values
After the widget is configured:
- The current value of the selected point is displayed.
- The displayed value is refreshed automatically based on the configured Poll Frequency.
- Any changes to the point value are reflected automatically on the dashboard.
Saving the Display
After configuring the Values widget:
-
Click Save on the display toolbar.
The display is saved successfully, and the Values widget is available on the dashboard for real-time monitoring of the selected point.
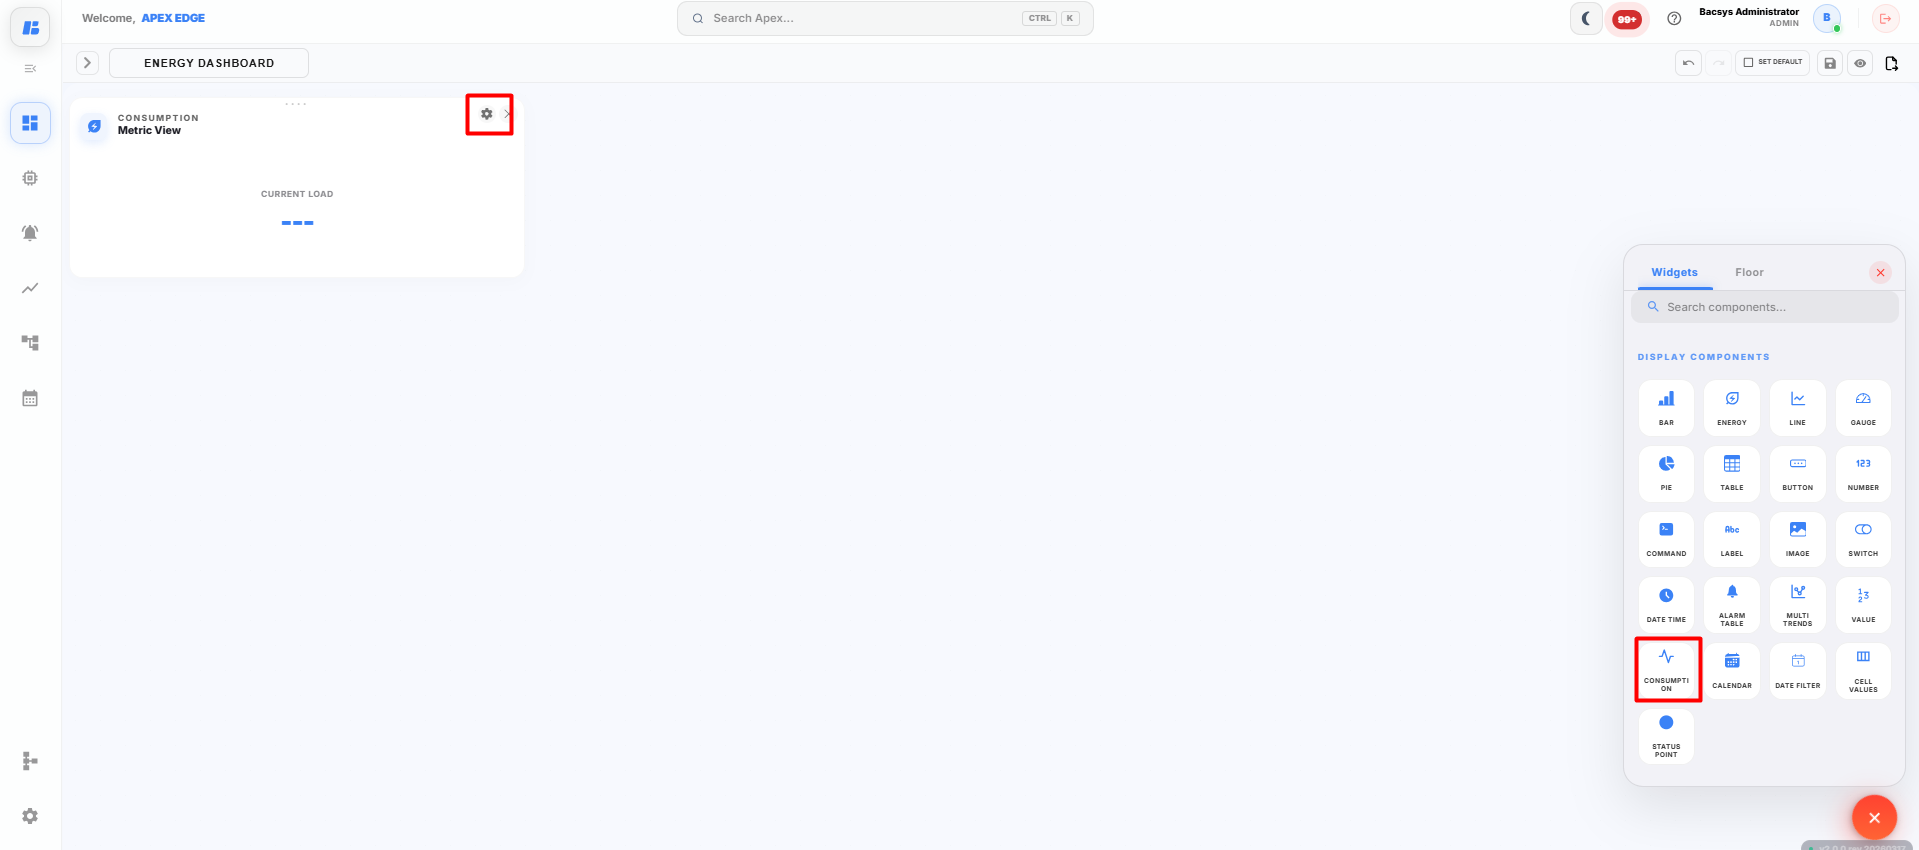
Consumption Widget
The Consumption widget displays the consumption data of a selected point for a specified time period. It allows users to analyze resource usage over daily, weekly, monthly, or yearly intervals and compare it with the current period.
Adding a Consumption Widget
-
Click the + icon on the display canvas.
-
Drag and drop the Consumption widget onto the canvas.
The Widget Settings panel appears.
-
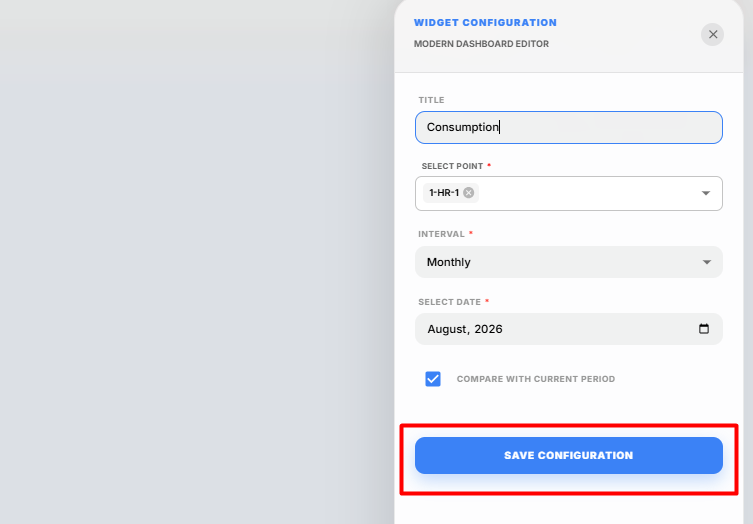
Configure the widget using the following settings.
Field Description Title Enter a title for the Consumption widget. Select Point Select the point whose consumption data you want to display. Interval Select the time interval for viewing consumption data. Select Date Select the date corresponding to the chosen interval. Compare with Current Period Enable this option to compare the selected period with the current period. -
Enter the required Title.
-
Click Select Point and choose the required consumption-enabled point.
Note: Ensure that Trend Logging is enabled for the selected point. Consumption values are calculated using the historical trend data recorded for that point.
-
Select the required Interval.
The available intervals include:
- Daily
- Weekly
- Monthly
- Yearly
-
Select the required Date.
The widget displays the consumption data for the selected date and interval.
-
Enable Compare with Current Period if you want to compare the selected period with the current period.
-
Click Save Configuration.
The Consumption widget is added to the display canvas.
Viewing Consumption Data
After the widget is configured:
- Consumption values are displayed for the selected point.
- The displayed data is based on the selected Interval and Date.
- If Compare with Current Period is enabled, the widget compares the selected period with the corresponding current period, making it easier to analyze changes in consumption.
Saving the Display
After configuring the Consumption widget:
-
Click Save on the display toolbar.
The display is saved successfully, and the Consumption widget is available on the dashboard for monitoring and analyzing consumption data.
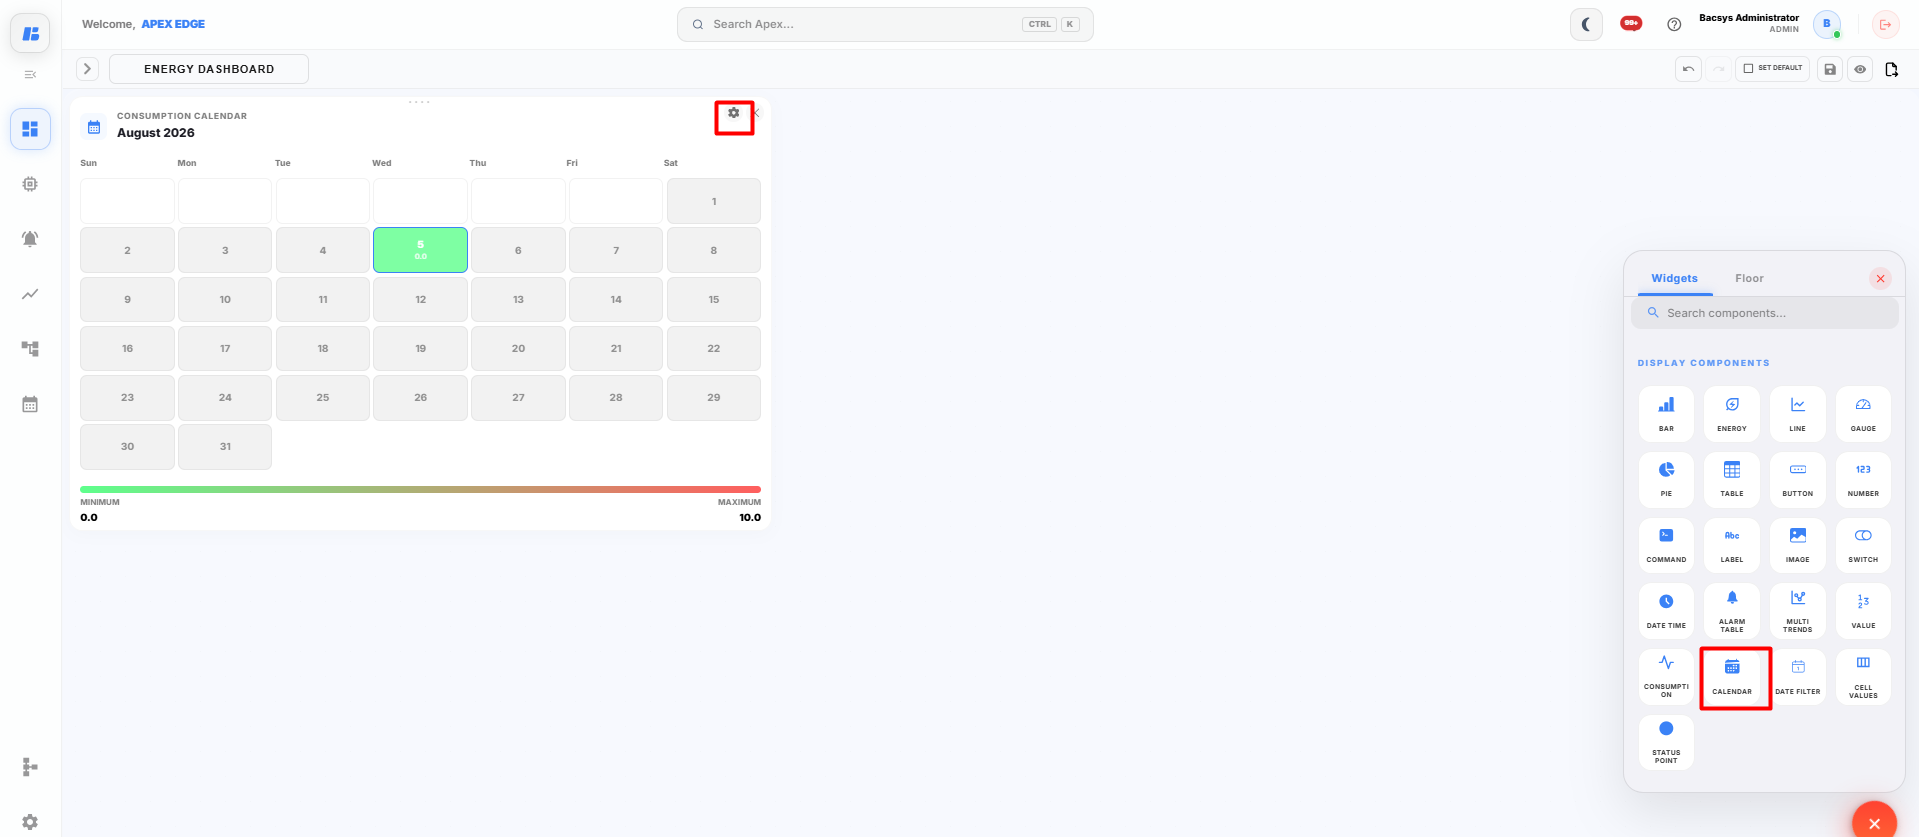
Consumption Calendar Widget
The Consumption Calendar widget displays the historical consumption of a selected trend point in a calendar view. It uses color indicators to highlight low and high consumption values, making it easier to identify consumption patterns over a selected month.
Adding a Consumption Calendar Widget
-
Click the + icon on the display canvas.
-
Drag and drop the Consumption Calendar widget onto the canvas.
The Widget Settings panel appears.
-
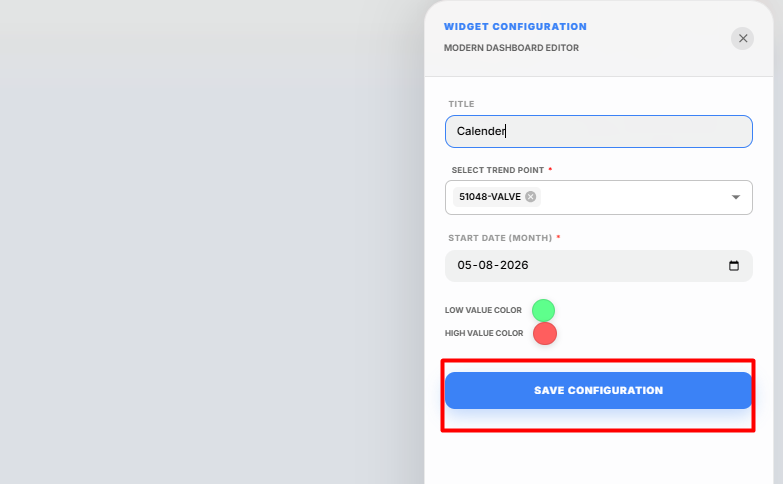
Configure the widget using the following settings.
Field Description Title Enter a title for the Consumption Calendar widget. Select Trend Point Select the trend-enabled point whose consumption data will be displayed. Start Date (Month) Select the month for which the consumption data should be displayed. Low Value Color Select the color used to represent low consumption values. High Value Color Select the color used to represent high consumption values. Note: Before selecting a point, ensure that Trend Logging is enabled for the required point. Navigate to Devices → Select the Point → Config → Trends, enable Data Logging, configure the required trend settings, and click Save Trend Configuration.
-
Enter the required Title.
-
Click Select Trend Point and choose the required trend-enabled point.
-
Select the required Start Date (Month).
-
Choose the preferred Low Value Color and High Value Color.
- Low Value Color represents lower consumption values.
- High Value Color represents higher consumption values.
-
Click Save Configuration.
The Consumption Calendar widget is added to the display canvas.
Viewing the Consumption Calendar
After the widget is configured:
- The selected month's consumption data is displayed in a calendar format.
- Each day is color-coded based on the recorded consumption.
- The selected Low Value Color represents lower consumption values.
- The selected High Value Color represents higher consumption values, making it easy to identify high-usage days.
Saving the Display
After configuring the Consumption Calendar widget:
-
Click Save on the display toolbar.
The display is saved successfully, and the Consumption Calendar widget is available on the dashboard for monitoring monthly consumption patterns.
Date Filter Widget
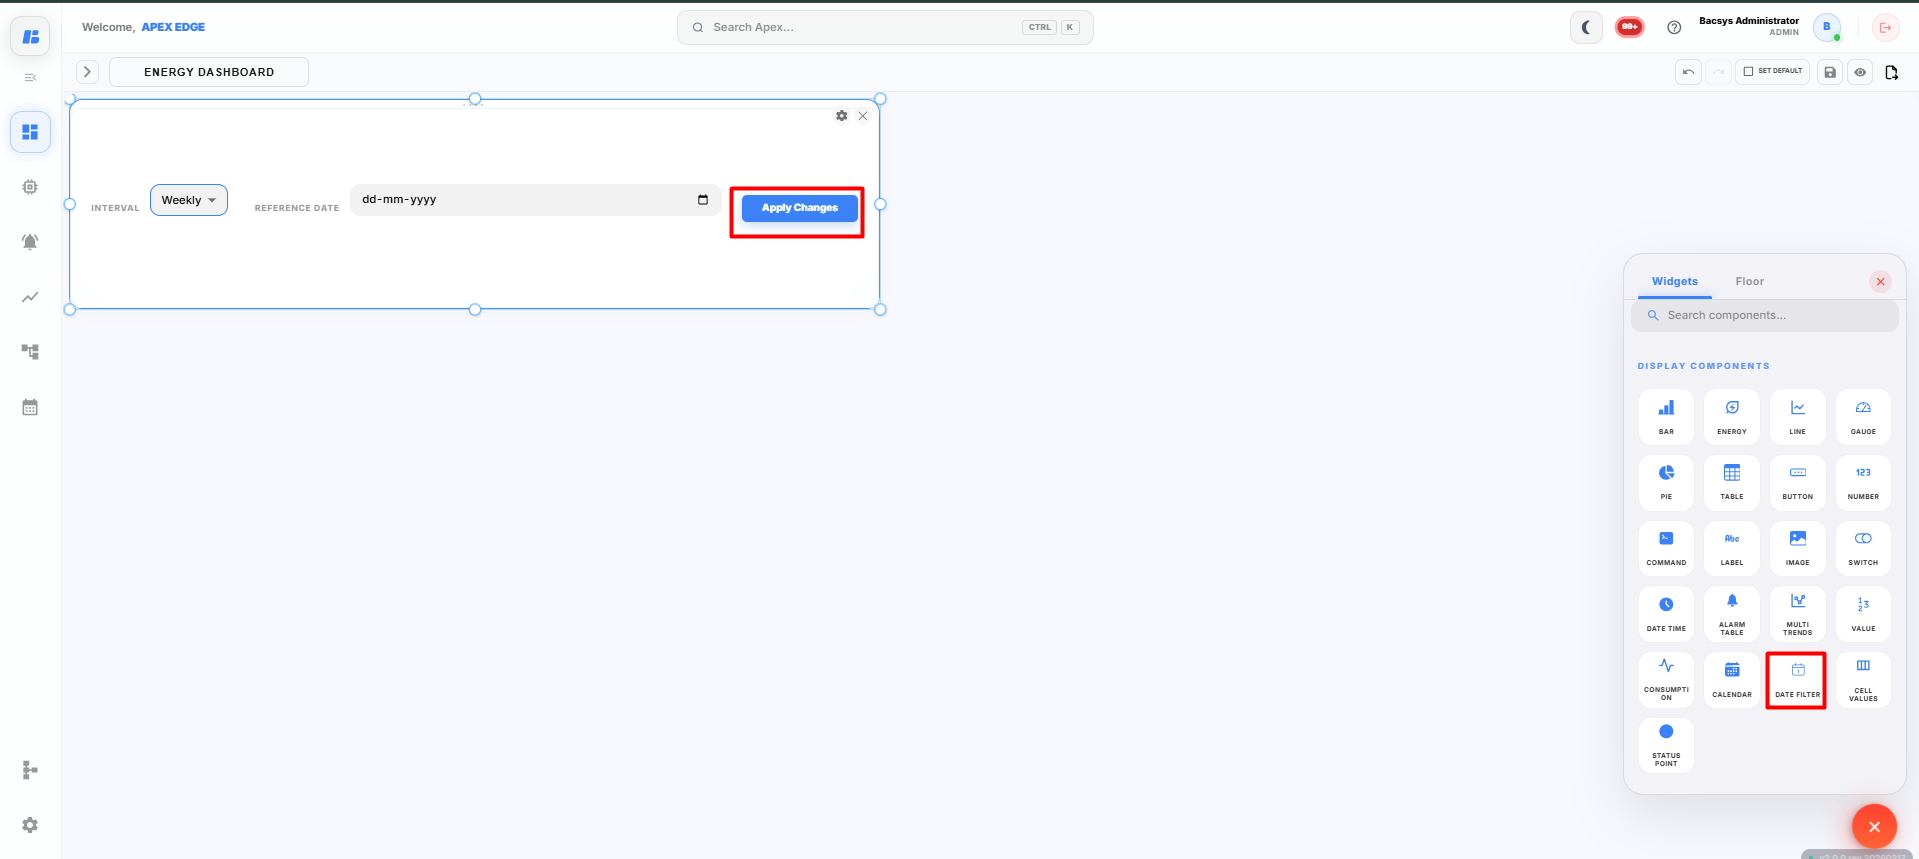
The Date Filter widget allows users to filter data across all supported dashboard widgets based on a selected time interval and reference date. Once applied, all linked widgets automatically refresh and display data for the selected period.
Adding a Date Filter Widget
-
Click the + icon on the display canvas.
-
Drag and drop the Date Filter widget onto the canvas.
The Date Filter widget is added to the display.
Using the Date Filter Widget
The Date Filter widget contains the following options:
| Field | Description |
|---|---|
| Interval | Select the required time interval for filtering the dashboard data. |
| Reference Date | Select the date that will be used as the reference for the selected interval. |
| Apply Changes | Applies the selected filter to all supported widgets on the dashboard. |
The available Interval options include:
- Daily
- Weekly
- Monthly
- Yearly
-
Select the required Interval.
For example, choose Weekly to view data for a specific week.
-
Click the Reference Date field and select the required date.
The selected date acts as the reference date for the chosen interval.
-
Click Apply Changes.
The dashboard is automatically updated based on the selected interval and reference date.
Dashboard Filtering
After clicking Apply Changes:
- All supported widgets on the dashboard refresh automatically.
- Historical charts and trend widgets display data for the selected period.
- Consumption widgets update based on the selected interval.
- Multiple widgets are synchronized, ensuring that the entire dashboard displays data for the same time period.
For example:
- If Weekly is selected with a reference date, all supported widgets display data for that week.
- If Monthly is selected, the dashboard displays data for the selected month.
- If Yearly is selected, the dashboard displays data for the selected year.
Saving the Display
After configuring the Date Filter widget:
-
Click Save on the display toolbar.
The display is saved successfully, and the Date Filter widget is available on the dashboard for filtering data across all supported widgets.
Cell Values Widget
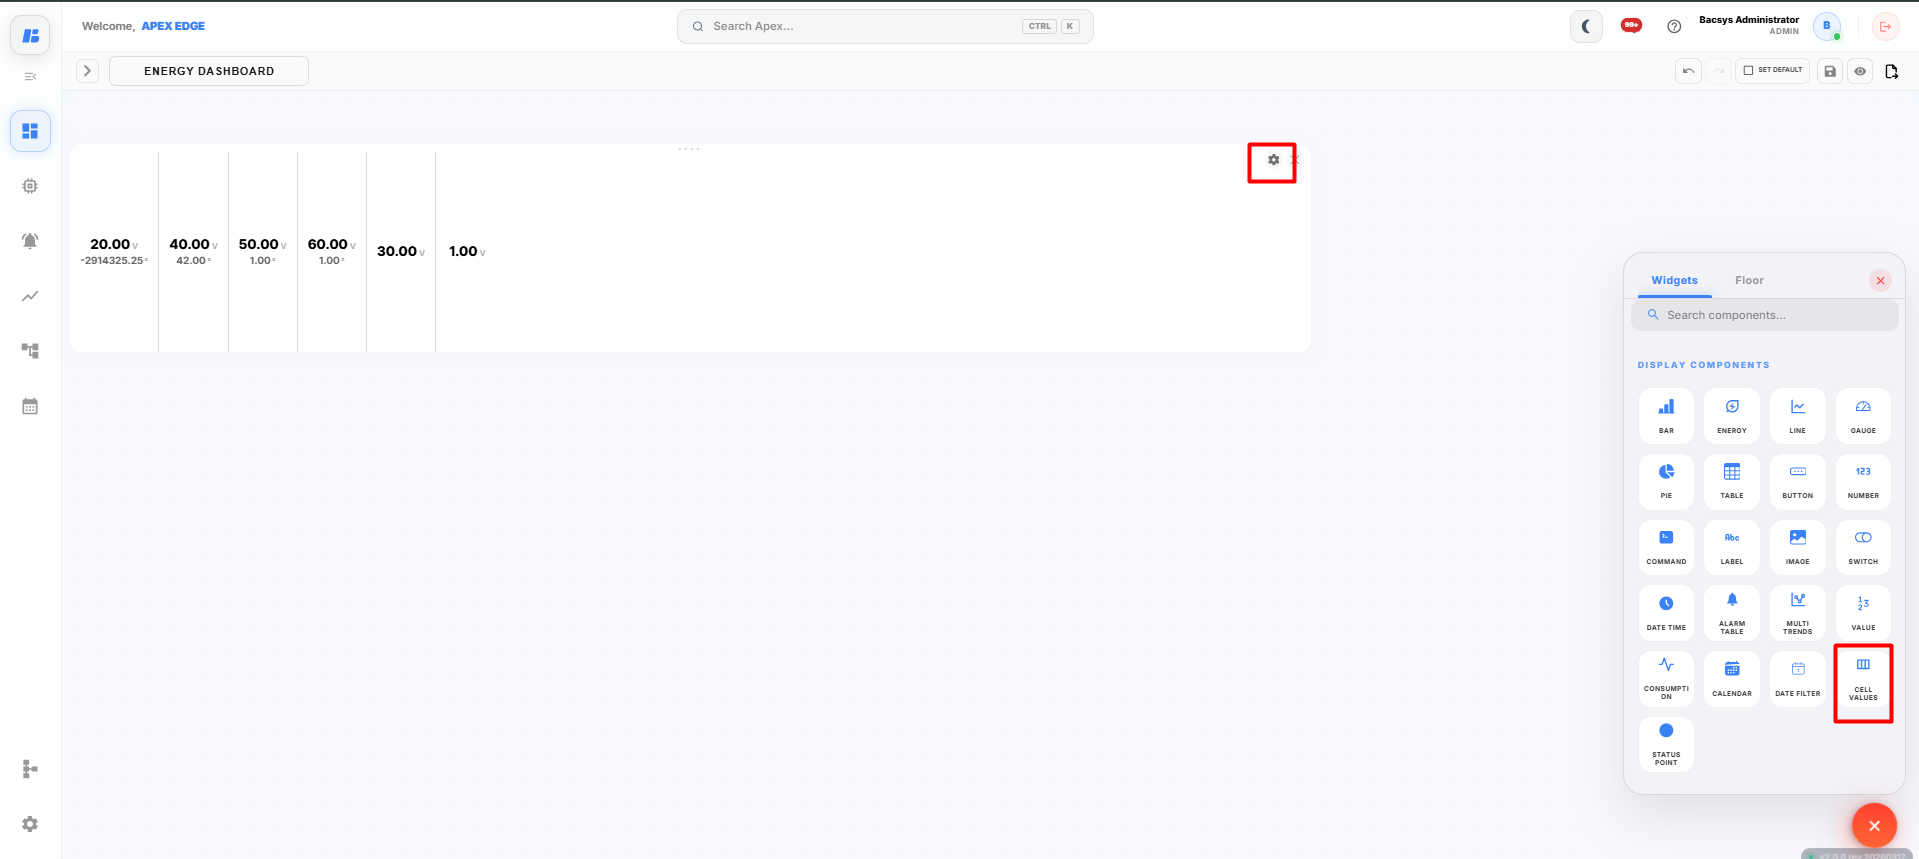
The Cell Values widget displays voltage and temperature values of selected points in a structured cell format. It allows users to monitor multiple voltage and temperature points simultaneously from a single dashboard widget.
Adding a Cell Values Widget
-
Click the + icon on the display canvas.
-
Drag and drop the Cell Values widget onto the canvas.
The Widget Settings panel appears.
-
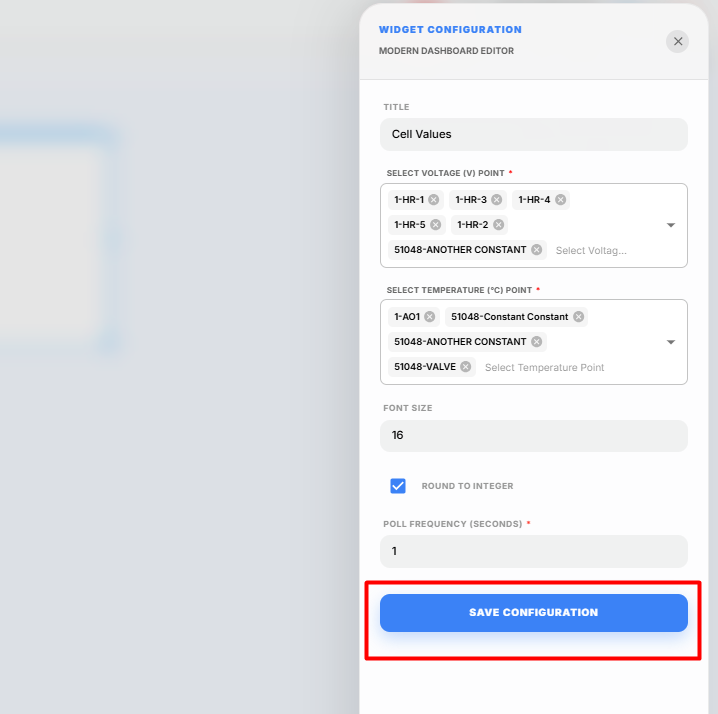
Configure the widget using the following settings.
Field Description Title Enter a title for the Cell Values widget. Select Voltage (V) Point Select one or more voltage points to display. Select Temperature (°C) Point Select one or more temperature points to display. Font Size Specify the font size used to display the values. Round to Integer Enable this option to display values as whole numbers. Poll Frequency (Seconds) Specify how frequently the widget refreshes the displayed values. -
Enter the required Title.
-
Click Select Voltage (V) Point and select the required voltage points.
-
Click Select Temperature (°C) Point and select the required temperature points.
-
Configure the required Font Size.
-
Enable Round to Integer if you want the displayed values to be rounded to the nearest whole number.
-
Configure the required Poll Frequency.
-
Click Save Configuration.
The Cell Values widget is added to the display canvas.
Viewing Cell Values
After the widget is configured:
- The selected Voltage (V) values are displayed in real time.
- The selected Temperature (°C) values are displayed alongside the corresponding voltage values.
- The displayed values are automatically refreshed based on the configured Poll Frequency.
- If Round to Integer is enabled, the displayed values are rounded to the nearest whole number.
Saving the Display
After configuring the Cell Values widget:
-
Click Save on the display toolbar.
The display is saved successfully, and the Cell Values widget is available on the dashboard for monitoring voltage and temperature values.
Status Widget
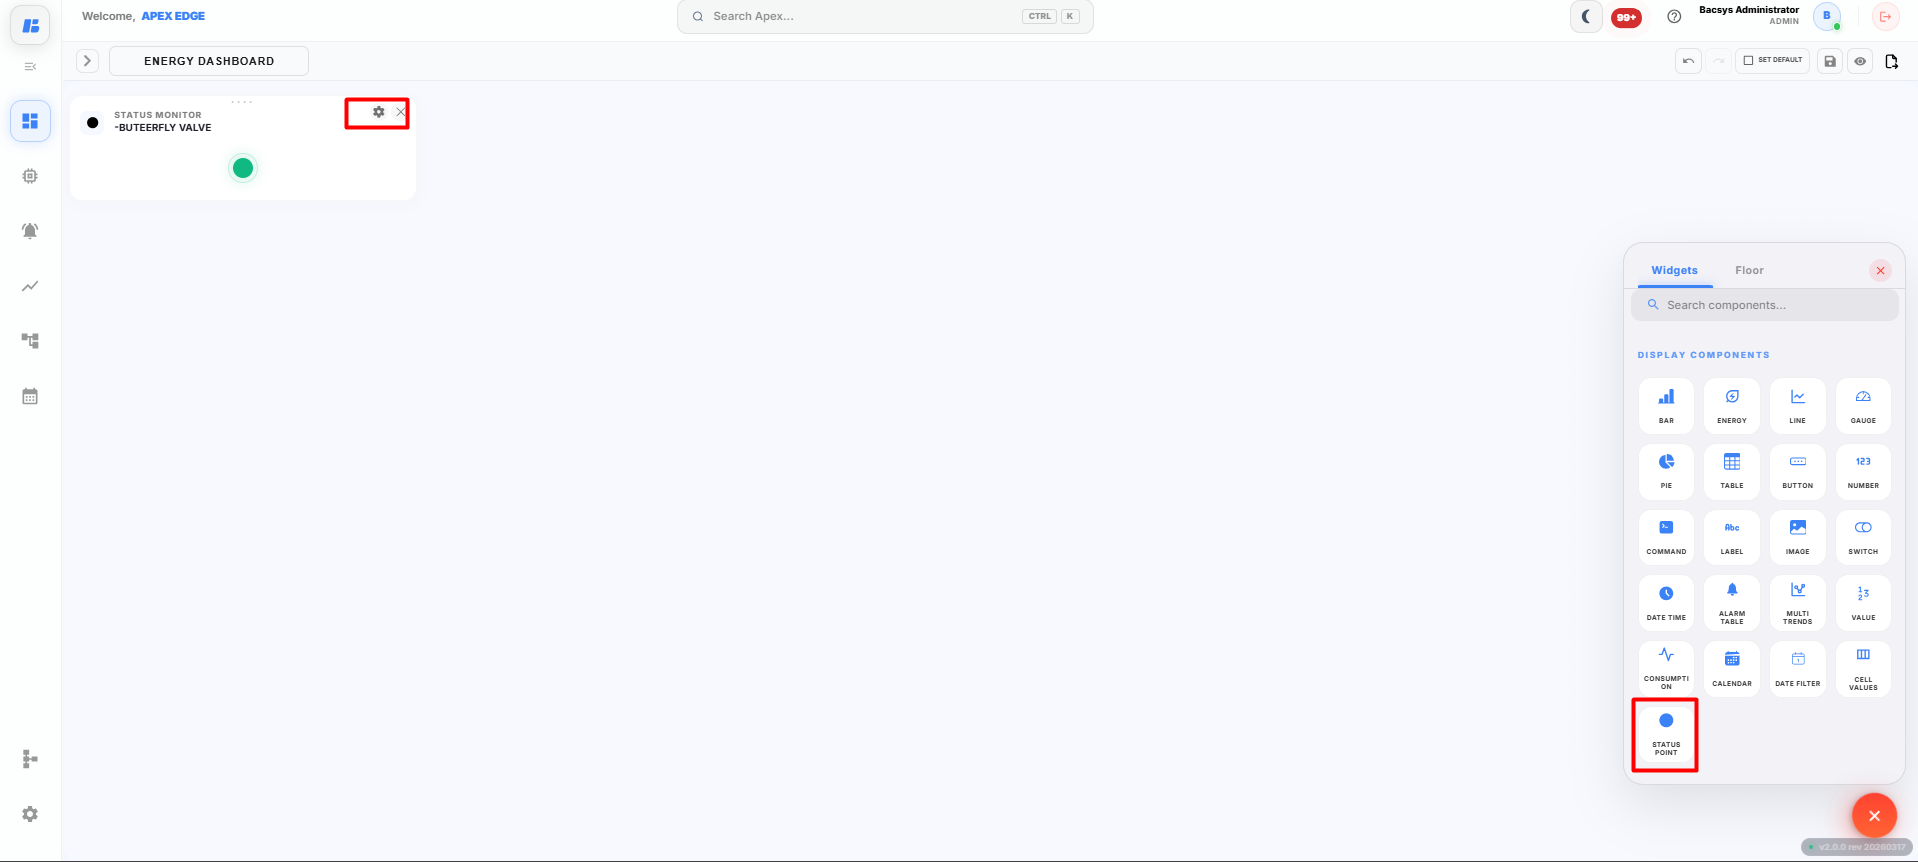
The Status widget displays the real-time status of a selected point. It provides a quick visual indication of the current operating state of the selected device or point.
Adding a Status Widget
-
Click the + icon on the display canvas.
-
Drag and drop the Status widget onto the canvas.
The Widget Settings panel appears.
-
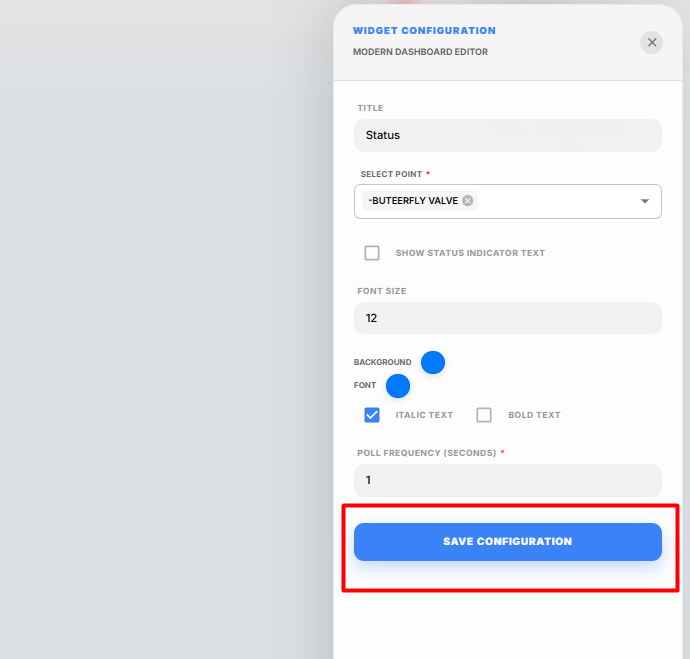
Configure the widget using the following settings.
Field Description Title Enter a title for the Status widget. Select Point Select the point whose status will be displayed. Show Status Indicator Text Enable this option to display the status text (such as ON, OFF, Open, or Closed) along with the status indicator. Font Size Specify the font size used for the displayed status text. Background Select the background color of the widget. Font Select the font color for the displayed status text. Italic Text Enable this option to display the text in italic style. Bold Text Enable this option to display the text in bold style. Poll Frequency (Seconds) Specify how frequently the widget refreshes the displayed status. -
Enter the required Title.
-
Click Select Point and choose the required point.
Note: Only one point can be selected for the Status widget.
-
Enable Show Status Indicator Text if you want to display the status text along with the status indicator.
-
Configure the required Font Size.
-
Select the preferred Background and Font colors.
-
Enable Italic Text or Bold Text if required.
-
Configure the required Poll Frequency.
-
Click Save Configuration.
The Status widget is added to the display canvas.
Viewing Status
After the widget is configured:
- The current status of the selected point is displayed in real time.
- The status is automatically refreshed based on the configured Poll Frequency.
- If Show Status Indicator Text is enabled, the widget displays both the visual status indicator and the corresponding status text.
Saving the Display
After configuring the Status widget:
-
Click Save on the display toolbar.
The display is saved successfully, and the Status widget is available on the dashboard for monitoring the real-time status of the selected point.
Sensor Widget
The Sensor widget allows you to place a sensor icon on an image, such as a floor plan or equipment layout, and link it to a live point. Clicking the sensor can also navigate users to another display for detailed monitoring.
Adding a Sensor Widget
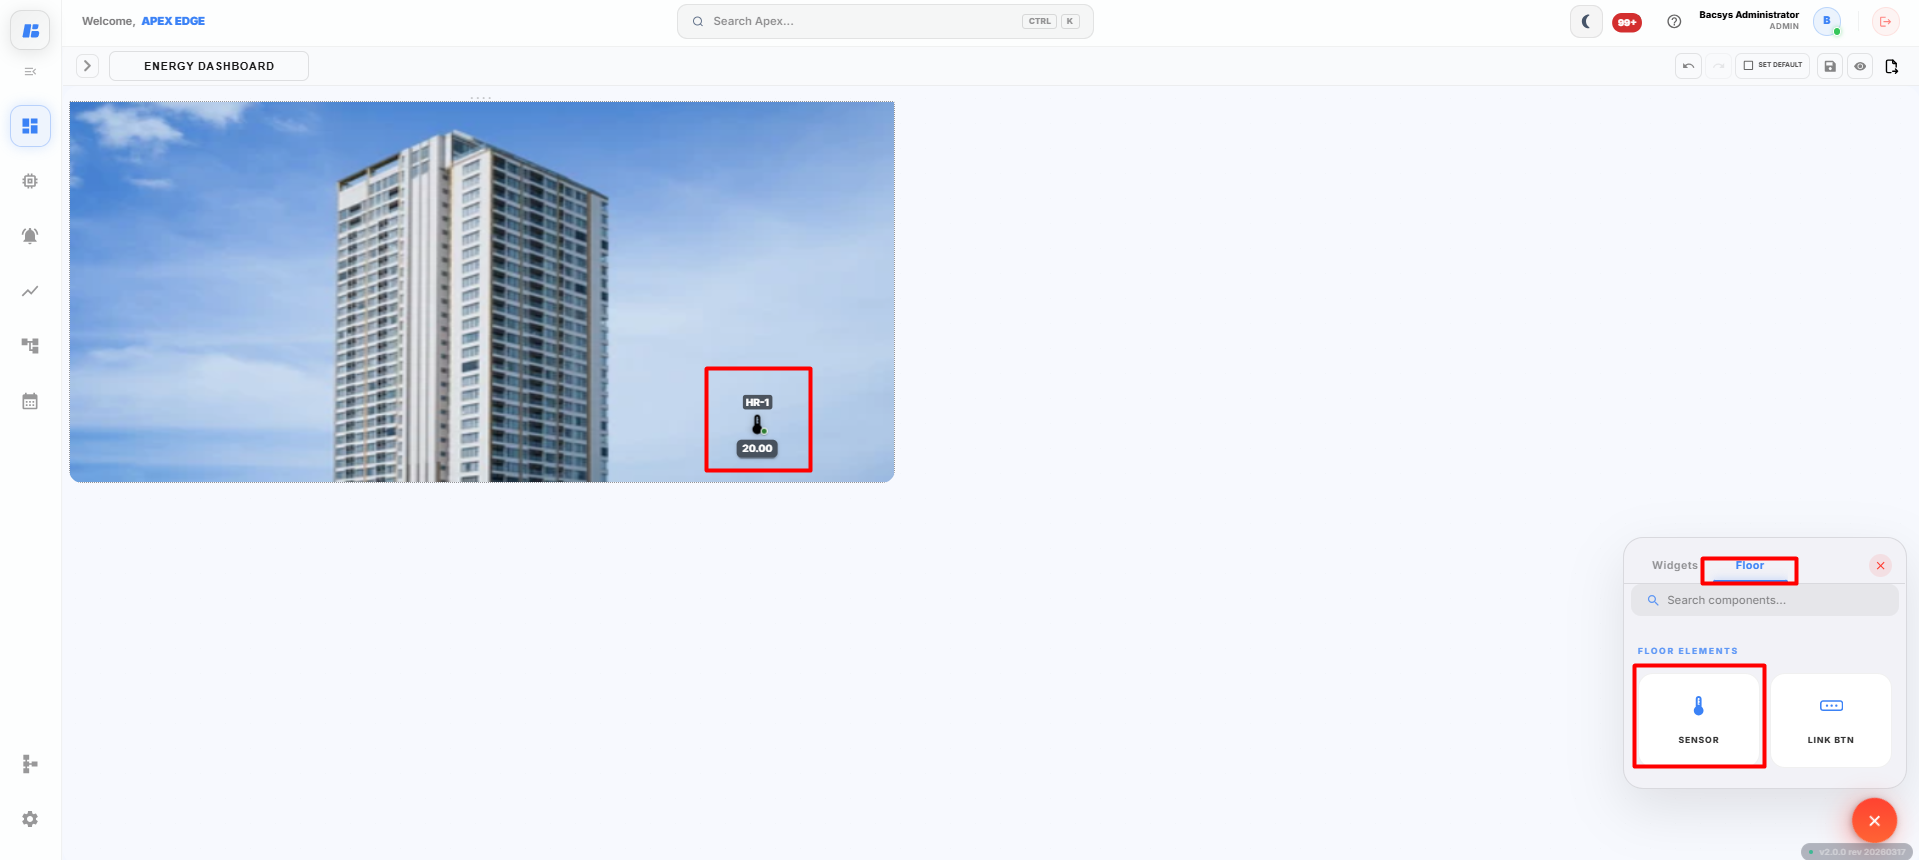
Before adding a Sensor widget, ensure that an Image widget has already been added to the display.
-
Click the + icon on the display canvas.
-
Drag and drop the Image widget onto the canvas.
-
Upload the required floor plan or equipment image and save the configuration.
-
From the Floors section, drag and drop the Sensor widget onto the uploaded image.
Position the sensor at the required location on the image.
-
Double-click the Sensor widget.
The Widget Config dialog box appears.
-
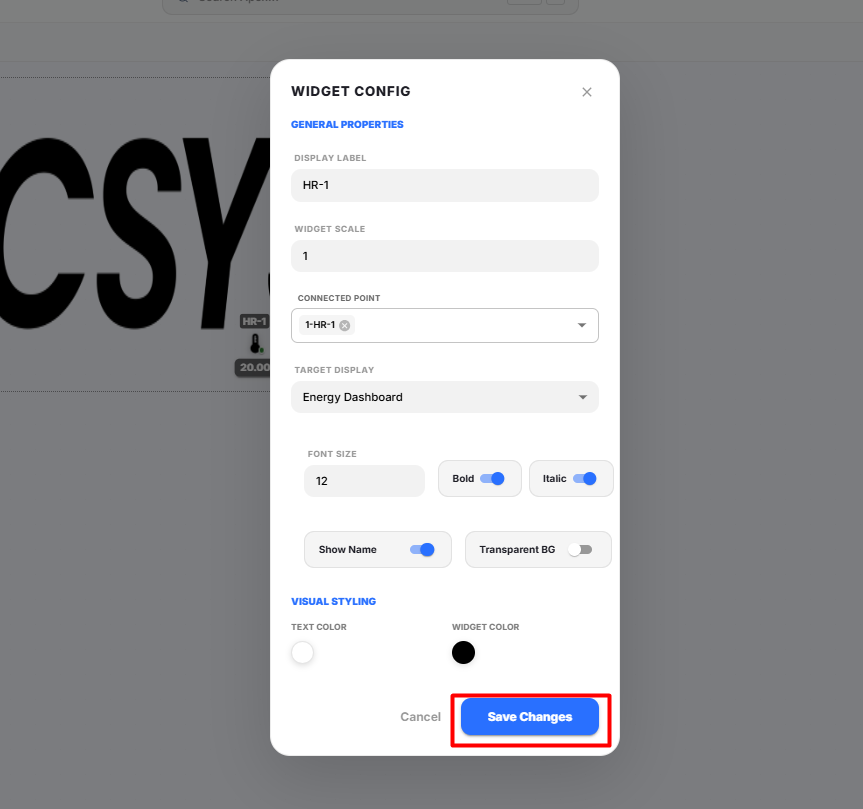
Configure the widget using the following settings.
Field Description Display Label Enter the name to display for the sensor. Widget Scale Specify the size of the sensor widget. Connected Point Select the point associated with the sensor. Target Display Select the display that opens when the sensor is clicked. Font Size Specify the font size for the sensor label. Bold Enables bold formatting for the sensor label. Italic Enables italic formatting for the sensor label. Show Name Displays or hides the sensor label on the image. Transparent BG Enables or disables a transparent background for the sensor label. Text Color Select the color of the sensor label text. Widget Color Select the color of the sensor icon. -
Enter the required Display Label.
-
Configure the Widget Scale.
-
Select the required Connected Point.
The selected point provides the real-time data for the sensor.
-
Select the required Target Display.
When the sensor is clicked in Preview mode, the selected display opens.
-
Configure the Font Size and enable Bold or Italic if required.
-
Enable or disable the following options as required:
- Show Name
- Transparent BG
-
Select the preferred Text Color and Widget Color.
-
Click Save Changes.
The Sensor widget is added to the image.
Viewing the Sensor Widget
After the widget is configured:
- The sensor is displayed at the selected location on the image.
- The sensor displays the real-time value of the connected point.
- Clicking the sensor opens the configured Target Display.
- The sensor appearance can be customized using the configured colors, font settings, and display options.
Saving the Display
After configuring the Sensor widget:
-
Click Save on the display toolbar.
The display is saved successfully, and the Sensor widget is available on the image for real-time monitoring and navigation.
Link Button Widget
The Link Button widget allows users to create a clickable button on a floor plan or image. When the button is clicked, it navigates to another display, enabling quick navigation between different dashboards or floor layouts.
Adding a Link Button Widget
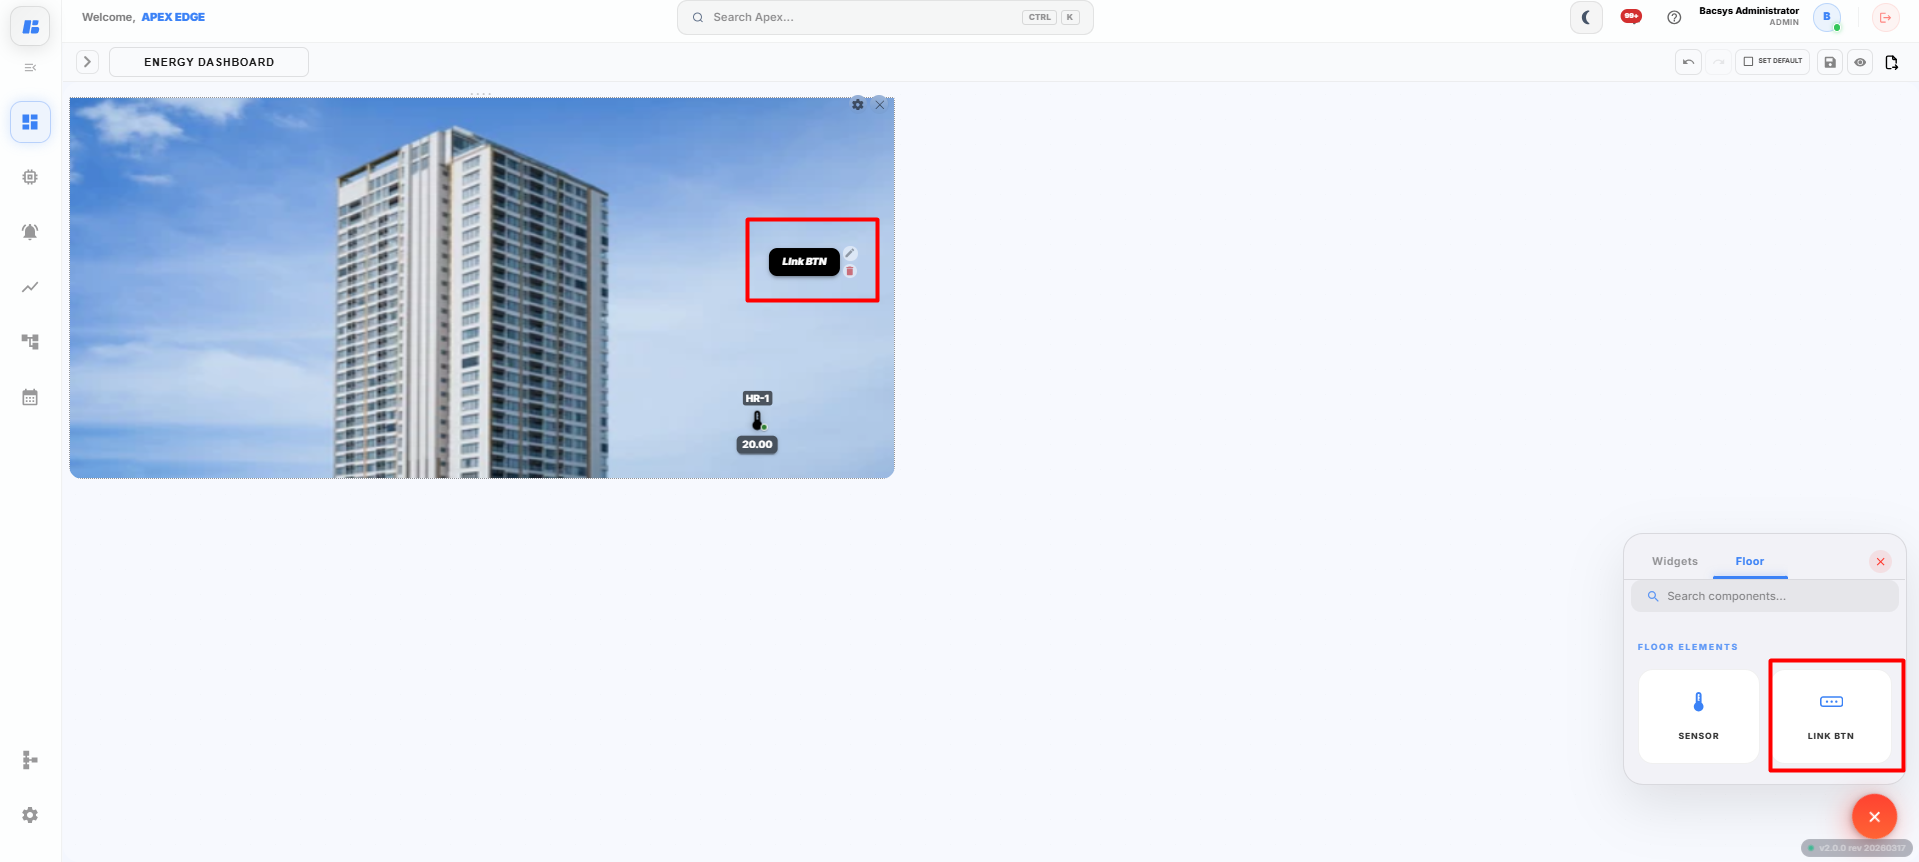
Before adding a Link Button widget, ensure that an Image widget has already been added to the display.
-
Click the + icon on the display canvas.
-
Drag and drop the Image widget onto the canvas.
-
Upload the required floor plan or equipment image and save the configuration.
-
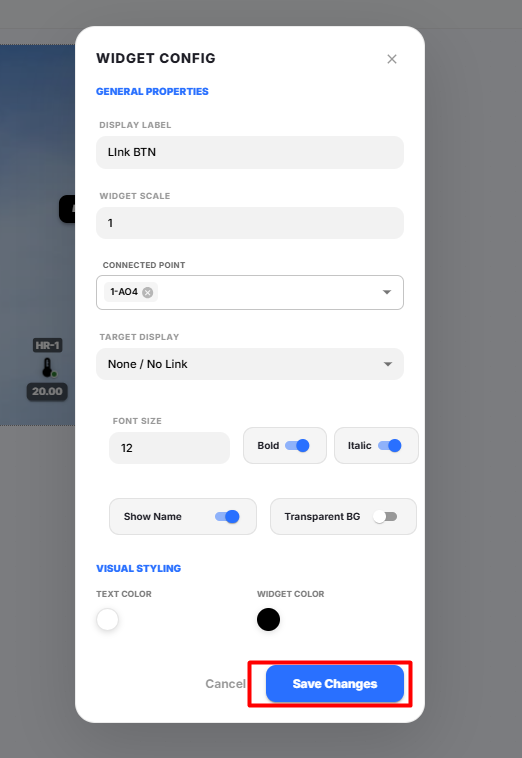
From the Floor tab, drag and drop the Link BTN widget onto the image.
Position the Link Button at the required location.
-
Double-click the Link BTN widget.
The Widget Config dialog box appears.
-
Configure the widget using the following settings.
Field Description Display Label Enter the name to display on the Link Button. Widget Scale Specify the size of the Link Button. Connected Point Select a point to associate with the button (optional). Target Display Select the display that should open when the button is clicked. Font Size Specify the font size for the button label. Bold Enables bold formatting for the button label. Italic Enables italic formatting for the button label. Show Name Displays or hides the button label. Transparent BG Enables or disables a transparent background for the button. Text Color Select the color of the button text. Widget Color Select the color of the button. -
Enter the required Display Label.
-
Configure the Widget Scale.
-
(Optional) Select a Connected Point if required.
-
Select the required Target Display.
Note: If Target Display is set to None / No Link, clicking the button will not navigate to another display.
-
Configure the Font Size and enable Bold or Italic if required.
-
Enable or disable the following options as required:
- Show Name
- Transparent BG
-
Select the preferred Text Color and Widget Color.
-
Click Save Changes.
The Link Button widget is added to the image.
Using the Link Button
After the widget is configured:
- The Link Button is displayed on the image.
- Clicking the button opens the configured Target Display.
- The button appearance can be customized using the configured font, colors, and display options.
- Multiple Link Buttons can be added to the same image to navigate between different displays.
Saving the Display
After configuring the Link Button widget:
-
Click Save on the display toolbar.
The display is saved successfully, and the Link Button widget is available for navigation between displays.
Managing Widgets
After adding a widget to the display canvas, you can manage it by right-clicking on the widget. A context menu appears with several options that help you organize and manage the widget.
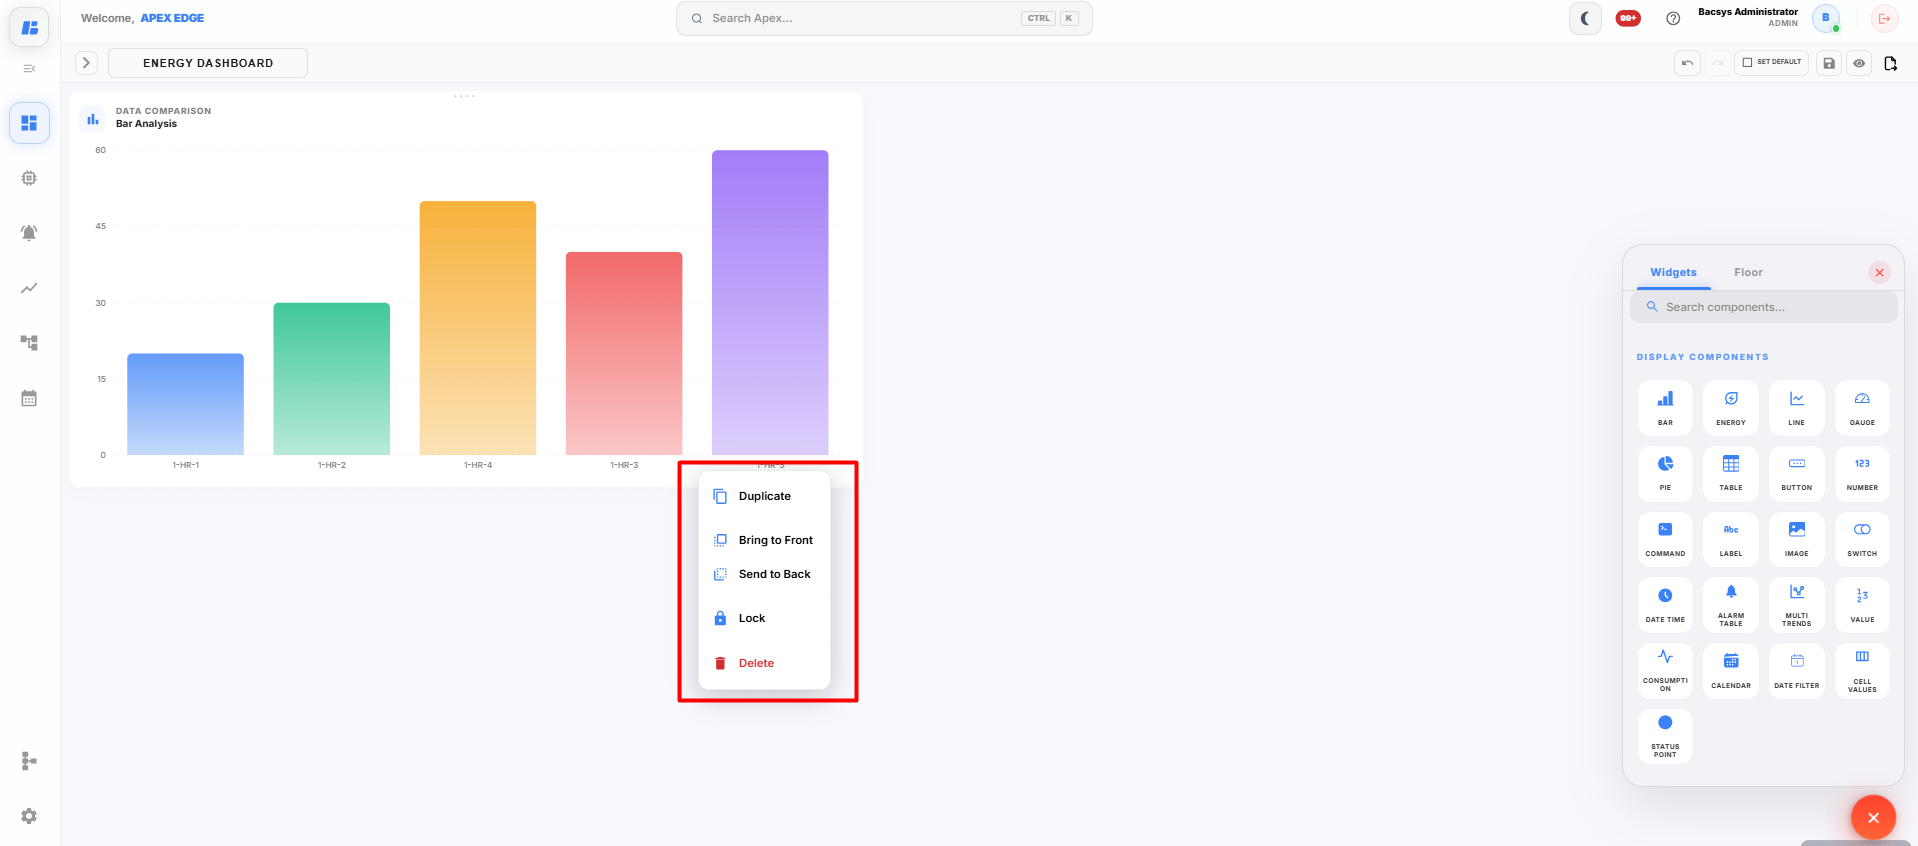
The available options are described below.
| Option | Description |
|---|---|
| Duplicate | Creates an exact copy of the selected widget, including all its configuration settings. |
| Bring to Front | Moves the selected widget above all other overlapping widgets on the display canvas. |
| Send to Back | Moves the selected widget behind other overlapping widgets on the display canvas. |
| Lock | Locks the widget in its current position, preventing accidental movement or resizing. |
| Delete | Removes the selected widget from the display canvas. |
Using the Widget Context Menu
-
Right-click the required widget on the display canvas.
The widget context menu appears.
-
Select the required option.
- Click Duplicate to create another copy of the widget.
- Click Bring to Front to display the widget above other widgets.
- Click Send to Back to place the widget behind other widgets.
- Click Lock to prevent accidental modifications to the widget position.
- Click Delete to permanently remove the widget from the display.
The selected action is applied immediately to the widget.
Undo and Redo
The Display Module provides Undo and Redo options to help users quickly reverse or restore recent changes while designing a dashboard.
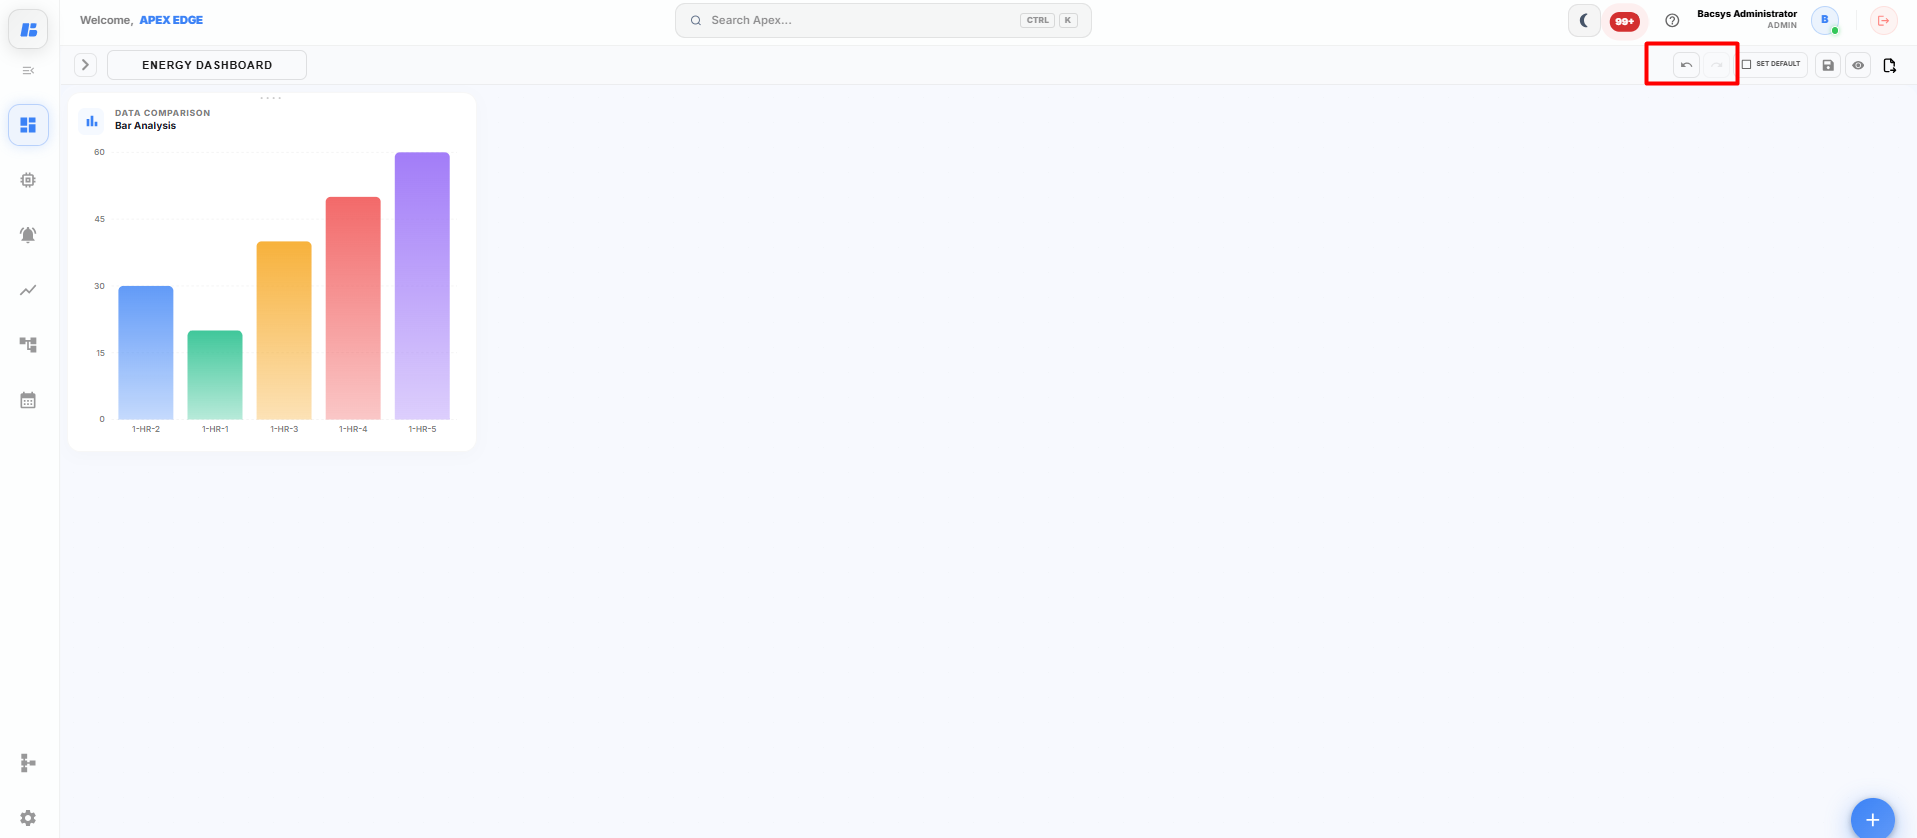
Undo
The Undo option reverses the most recent action performed on the display canvas.
You can use Undo to revert actions such as:
- Adding a widget
- Moving a widget
- Resizing a widget
- Deleting a widget
- Modifying widget properties
Click the Undo icon to return the display to its previous state.
Redo
The Redo option restores the last action that was reversed using Undo.
You can use Redo to reapply actions such as:
- Restoring a deleted widget
- Reapplying a widget movement or resize
- Restoring configuration changes
- Re-adding a widget that was removed using Undo
Click the Redo icon to restore the previously undone action.
Note: The Undo and Redo options affect only the current editing session. To permanently save the changes, click Save after completing the required modifications.
Set as Default
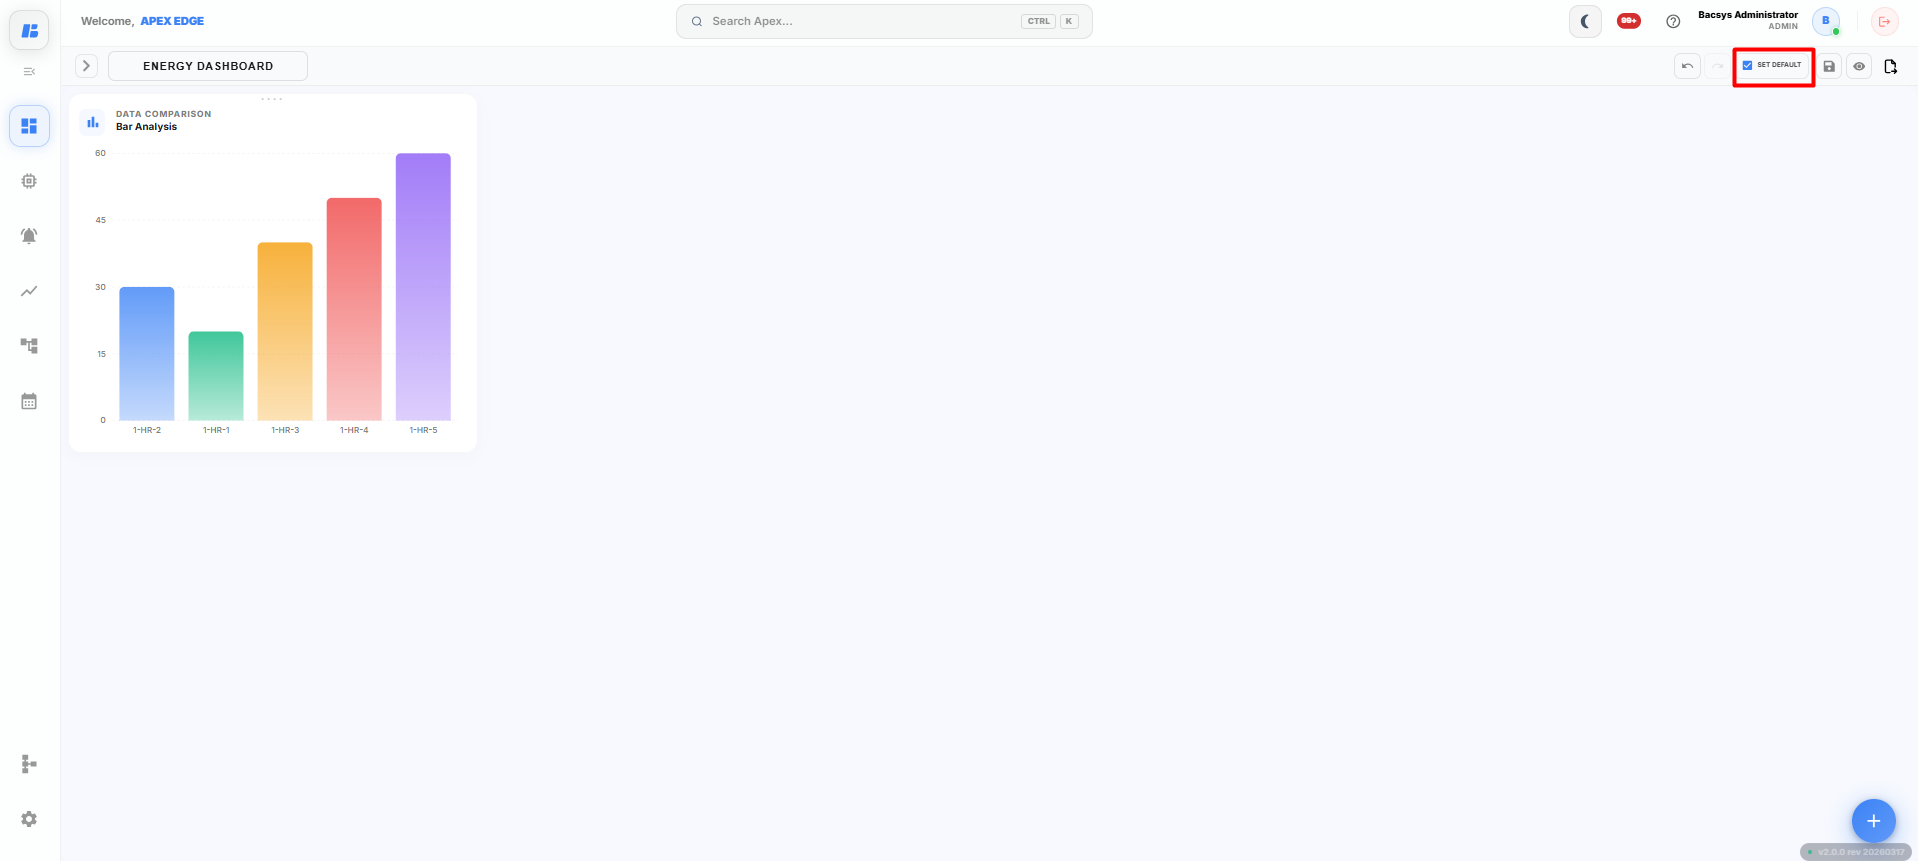
The Set as Default option allows you to set the current display as the default dashboard. When users open the Display module, the selected display is loaded automatically.
Setting a Default Display
-
Open the required display.
-
Complete the required changes and save the display.
-
Click Set Default from the toolbar.
The selected display is marked as the default display.
Default Display Behavior
After a display is set as the default:
- The selected display opens automatically when the Display module is accessed.
- Only one display can be configured as the default at a time.
- If another display is set as the default later, it replaces the previously configured default display.
- The default display remains active until it is changed by the user.
Saving the Changes
After setting the display as the default:
-
Click Save if there are any unsaved changes.
The selected display is saved and configured as the default display for the application.
Save Display
The Save button stores the current display along with all configured widgets, layouts, and settings. After saving, the display is available for future use without losing any changes.
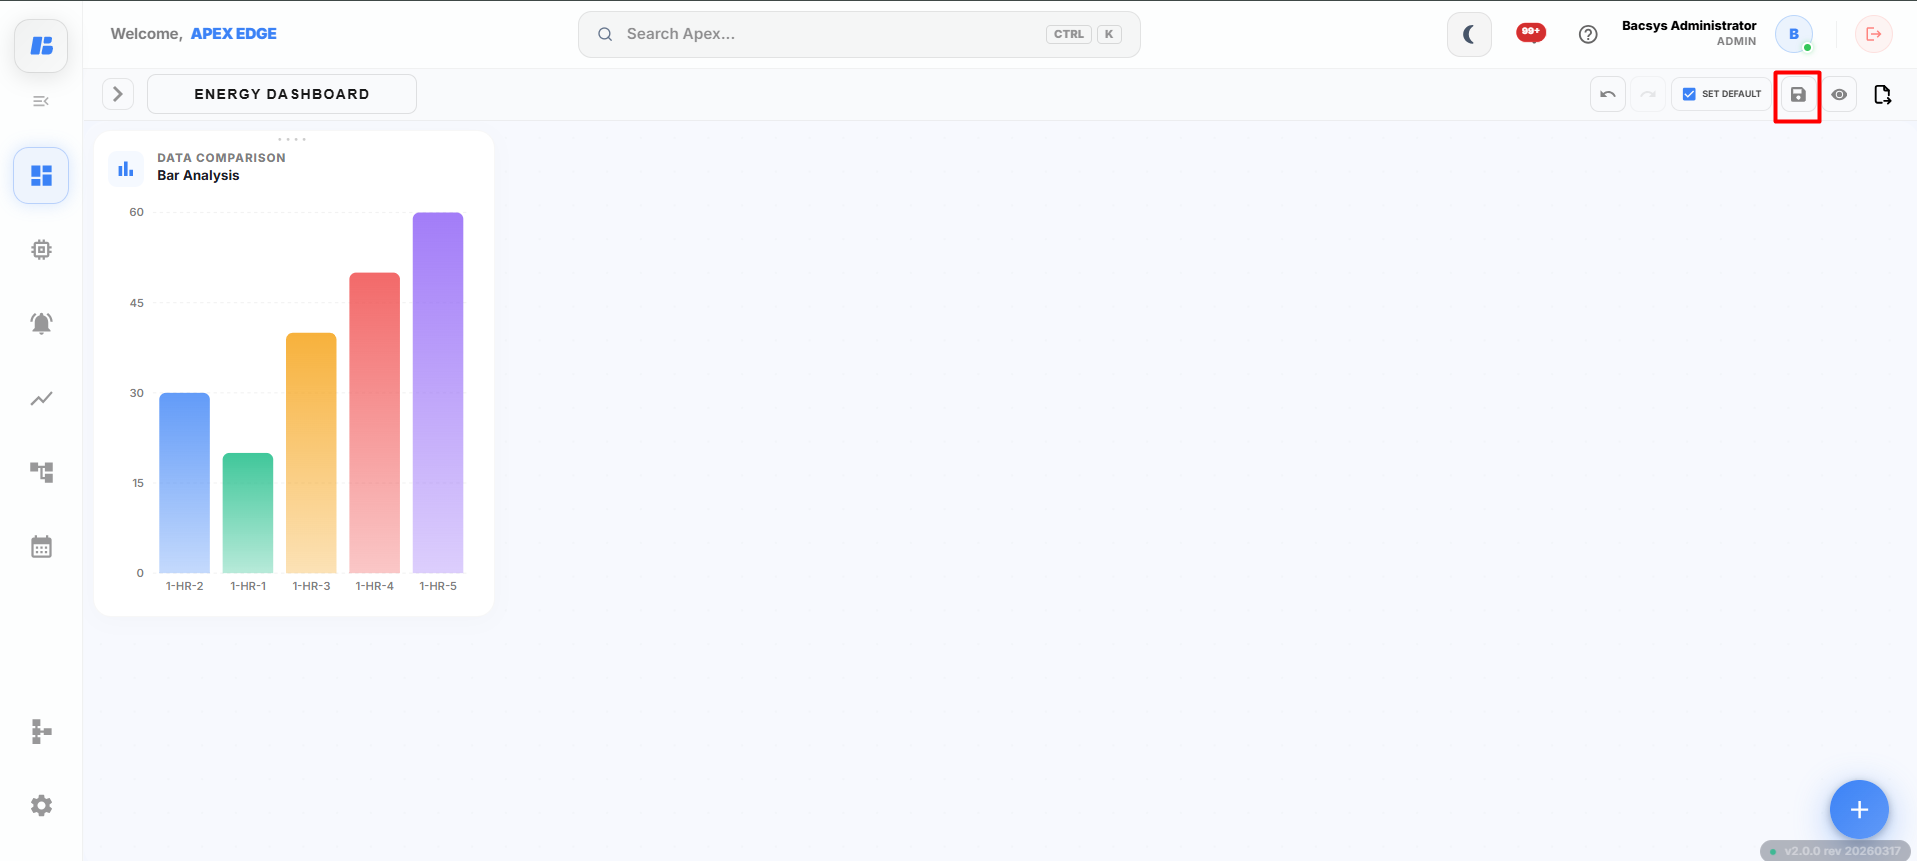
Saving a Display
After creating or modifying a display:
-
Click the Save button on the toolbar.
The platform saves the current display, including:
- Widget configurations
- Widget positions and sizes
- Display layout
- Floor components
- Display settings
-
Wait for the save process to complete.
The display is successfully saved and is available from the Display Browser.
When to Use Save
Use the Save button whenever you:
- Create a new display.
- Add or remove widgets.
- Modify widget configurations.
- Reposition or resize widgets.
- Update floor components such as Sensors or Link Buttons.
- Make any changes to the display layout.
Note: Unsaved changes will not be retained. Always click Save before leaving the Display module to ensure that all modifications are stored.
Preview Mode
The Preview option allows you to view the display exactly as it appears to end users before saving or publishing it. This helps you verify the dashboard layout, widget functionality, and navigation.
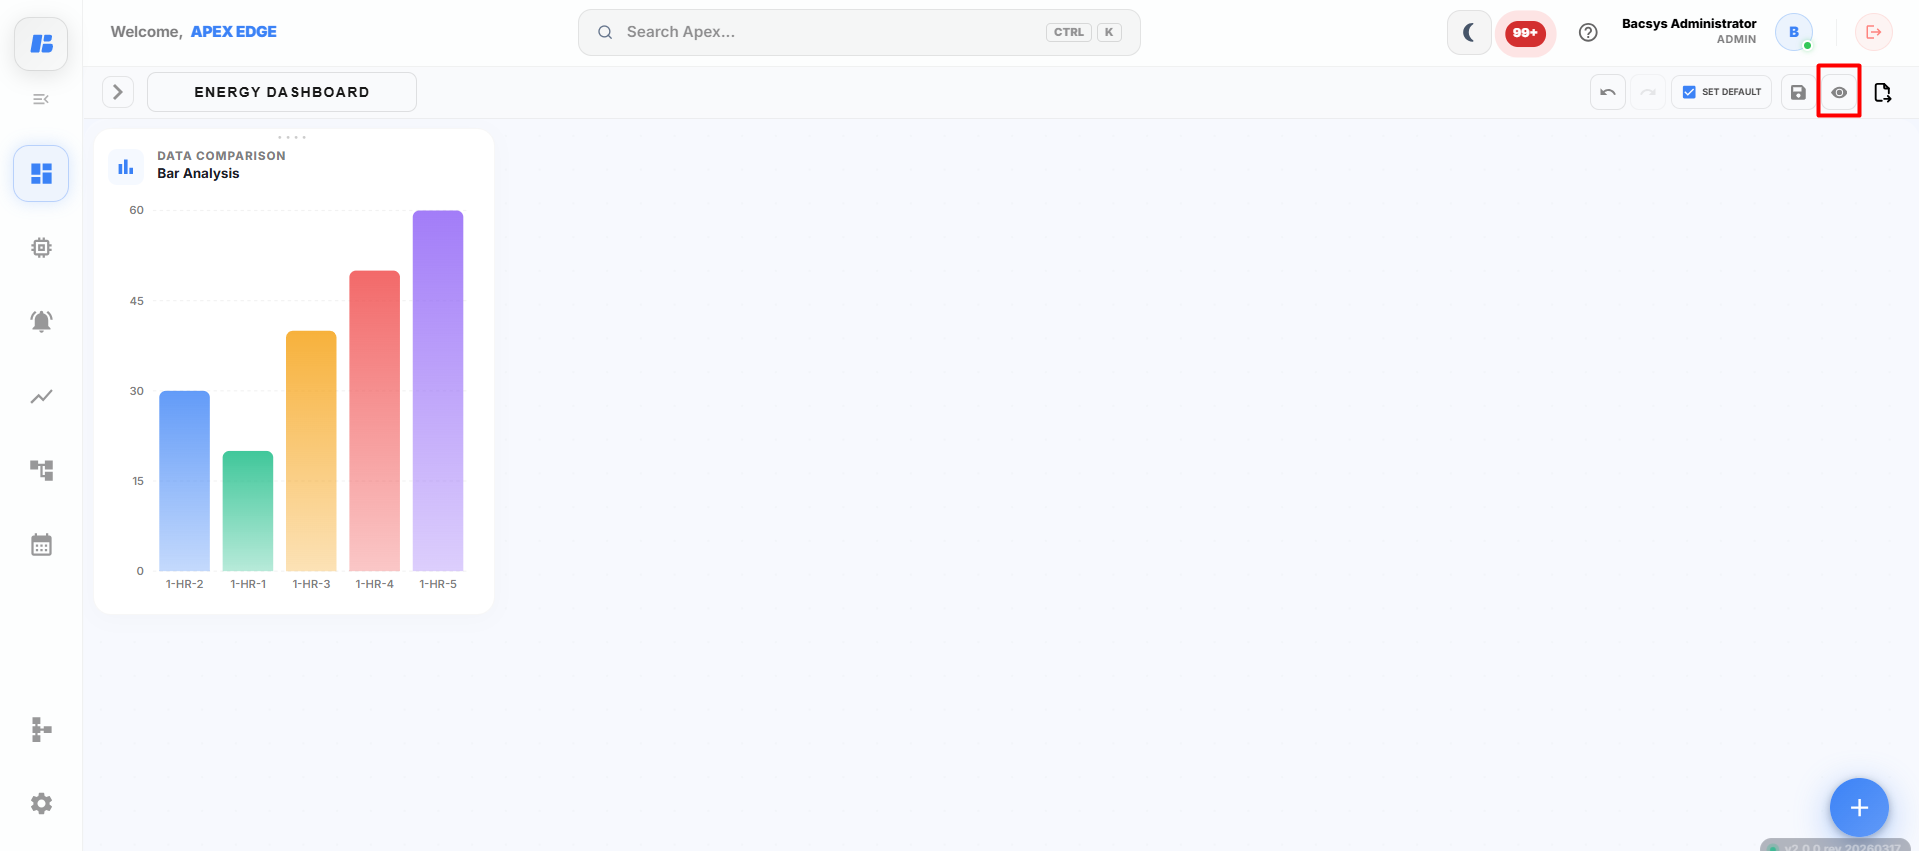
Opening Preview Mode
After configuring the display:
-
Click the Preview (Eye) icon on the toolbar.
The display opens in Preview Mode.
Using Preview Mode
In Preview Mode, you can:
- View the dashboard as an end user.
- Verify the layout and alignment of all widgets.
- Monitor real-time widget values.
- Test navigation using Button, Sensor, and Link Button widgets.
- Verify charts, trends, and other widget data.
- Ensure that all configured widgets are functioning correctly before saving or setting the display as the default.
Exiting Preview Mode
To return to edit mode:
-
Close the preview or click the Back/Edit option.
The display returns to the editing canvas, where you can continue making changes.
Note: Preview Mode is used only for verification. Any changes made to the display must be saved by clicking Save before exiting the Display module.
Save As, Export as Image, and Export as PDF
The Display Module provides options to save a copy of a display and export the dashboard for sharing or reporting purposes.
Save As
The Save As option creates a copy of the current display with a new name. This allows you to reuse an existing dashboard without modifying the original display.
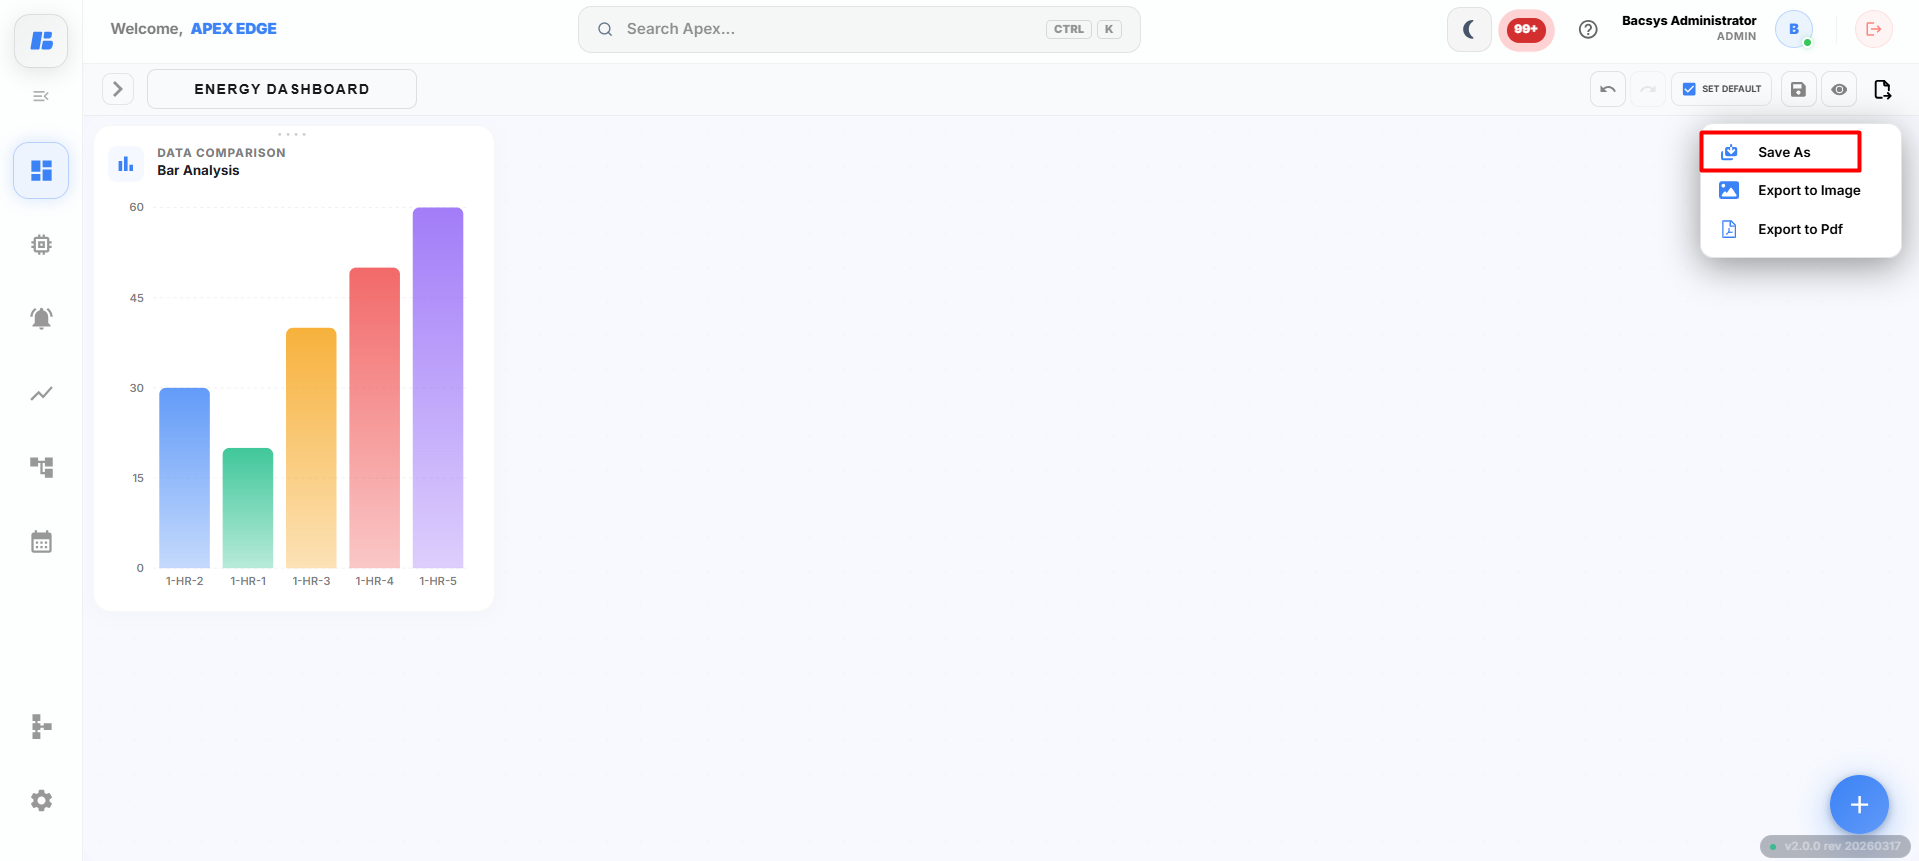
Using Save As
-
Open the required display.
-
Click Save As on the toolbar.
-
Enter a new name for the display.
-
Click Save.
A new display is created with the specified name, while the original display remains unchanged.
Export as Image
The Export as Image option saves the current dashboard as an image file, making it easy to share or include in reports and presentations.
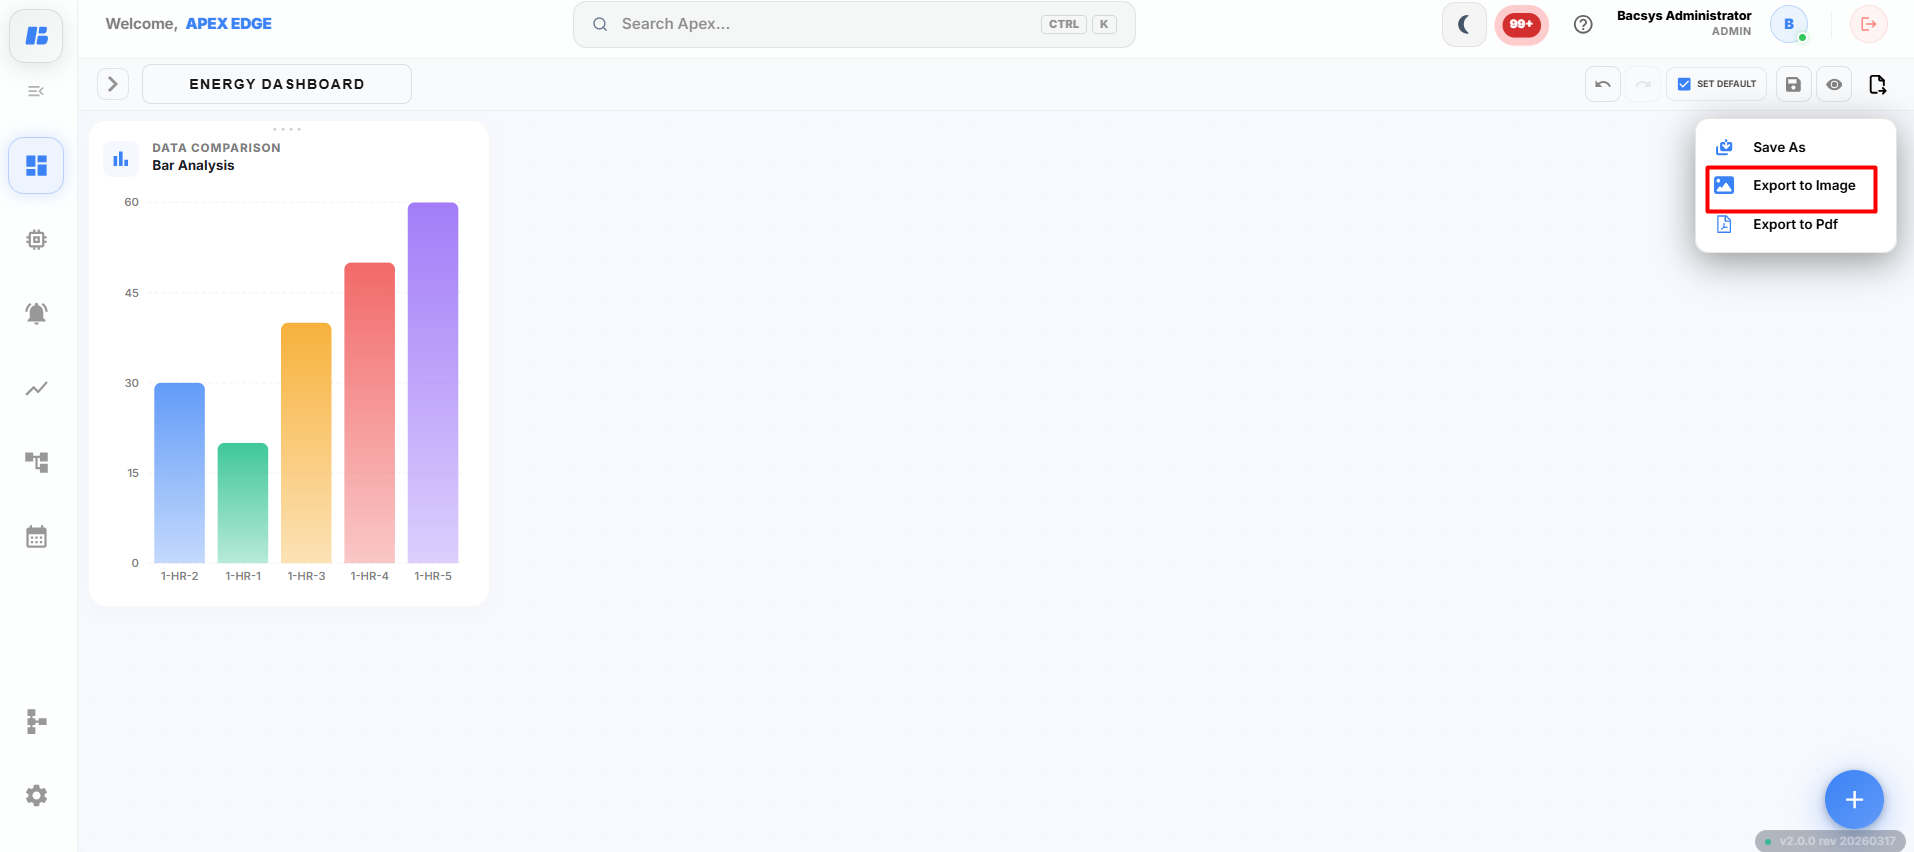
Exporting a Display as an Image
-
Open the required display.
-
Click Export as Image.
The platform generates an image of the current dashboard.
-
Save the generated image to your local system.
The exported image includes all visible widgets and the current dashboard layout.
Export as PDF
The Export as PDF option exports the current dashboard as a PDF document for documentation, reporting, or printing purposes.
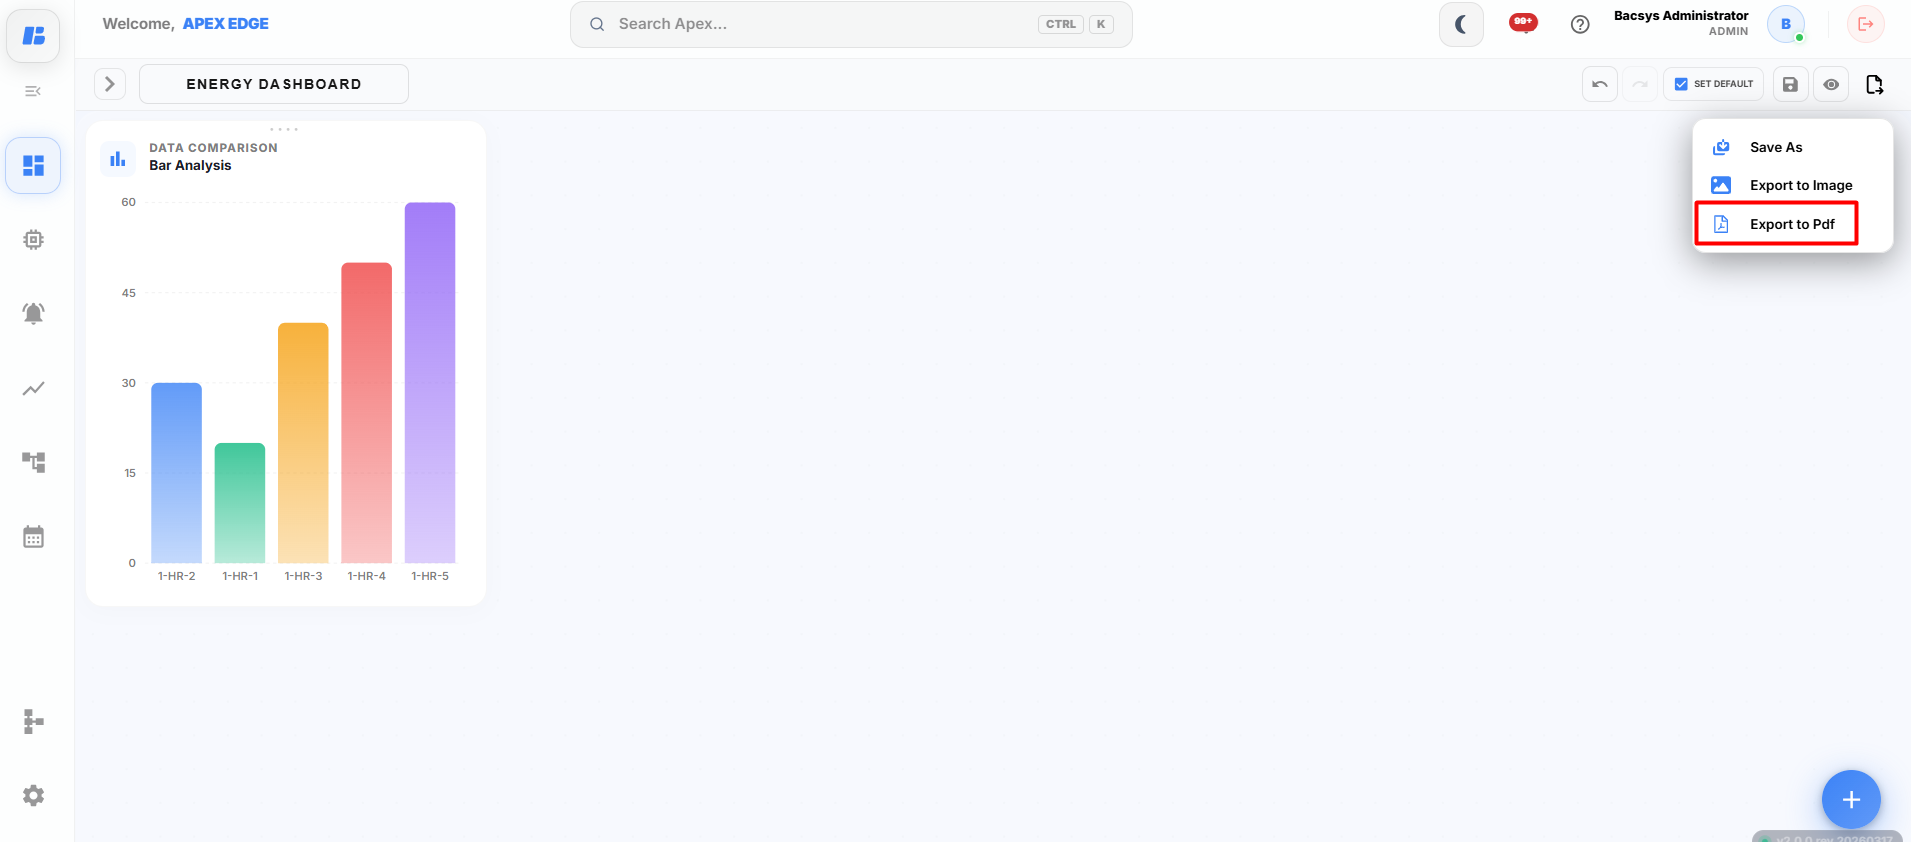
Exporting a Display as a PDF
-
Open the required display.
-
Click Export as PDF.
The platform generates a PDF of the current dashboard.
-
Save the PDF file to your local system.
The exported PDF preserves the current layout and displays all visible widgets as shown on the dashboard.
Edit Display
The Edit button allows you to modify an existing display. Once Edit mode is enabled, you can add, remove, reposition, resize, or reconfigure widgets on the display.
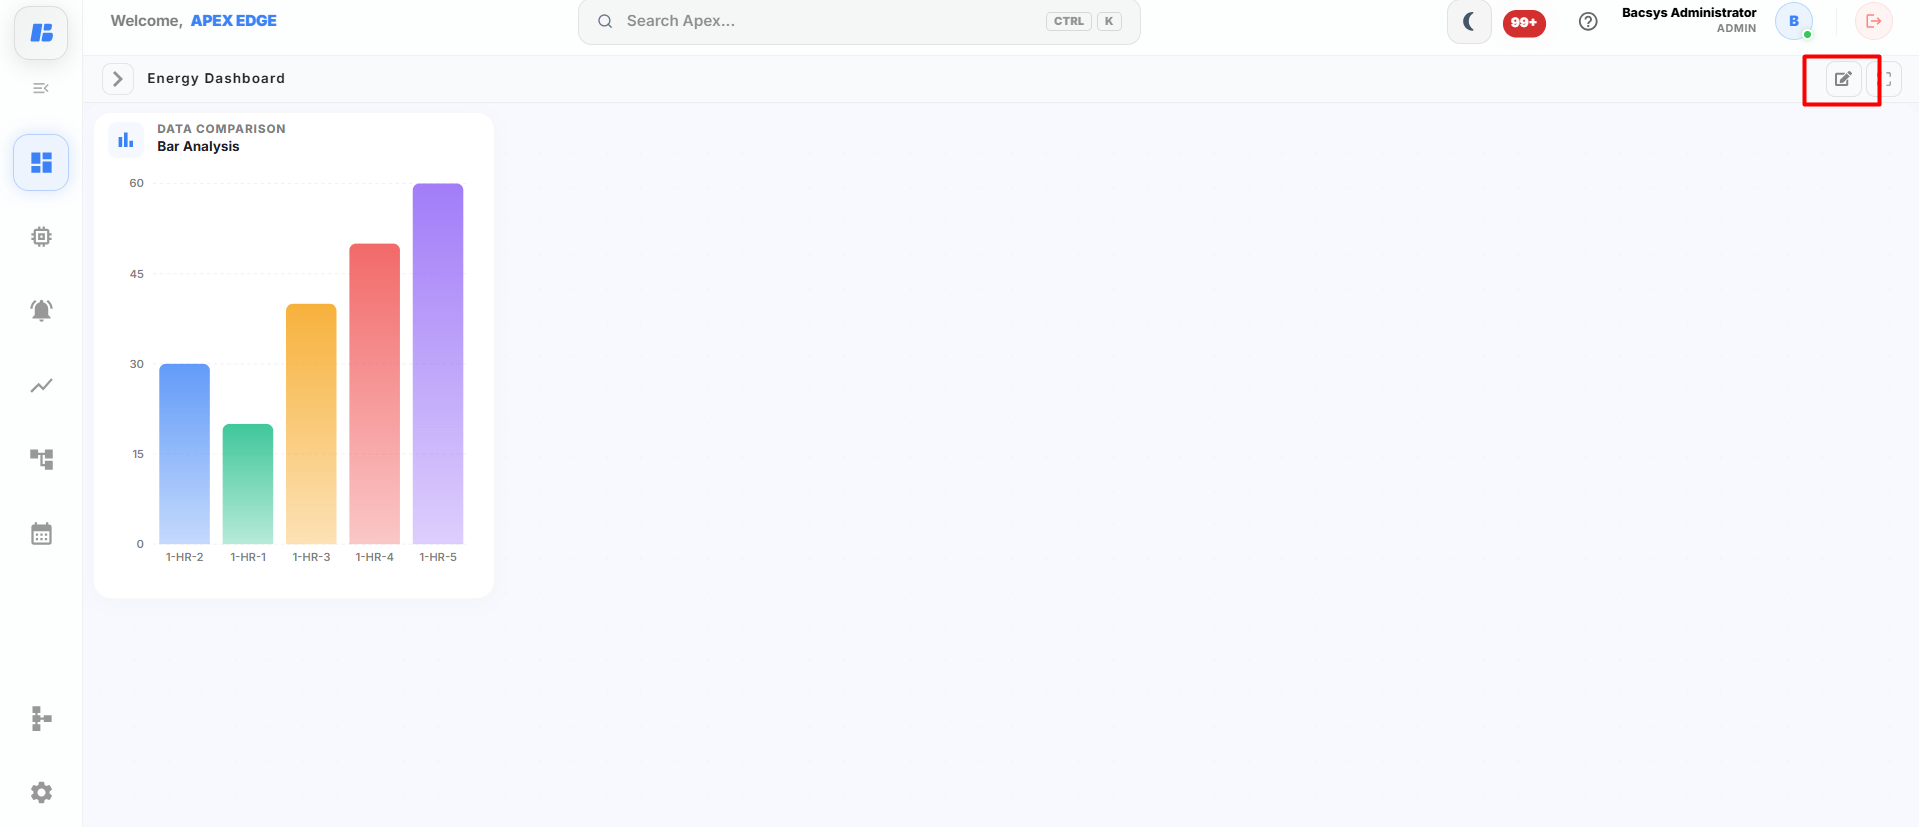
Editing a Display
-
Open the required display.
-
Click the Edit button on the toolbar.
The display enters Edit Mode, allowing you to modify the dashboard.
Using Edit Mode
After clicking Edit, you can perform the following actions:
- Add new widgets to the display.
- Remove existing widgets.
- Move widgets to different positions.
- Resize widgets.
- Modify widget settings.
- Change widget colors, fonts, and other properties.
- Add or edit Floor widgets such as Sensor and Link Button.
- Rearrange the dashboard layout as required.
Saving the Changes
After completing the required modifications:
-
Click Save.
The display is updated with the latest changes.
Note: Changes made in Edit Mode are not saved automatically. Always click Save before leaving the display to retain your modifications.
Full Screen
The Full Screen option expands the display to occupy the entire screen, providing a larger viewing area for monitoring dashboards and widgets without any interface distractions.
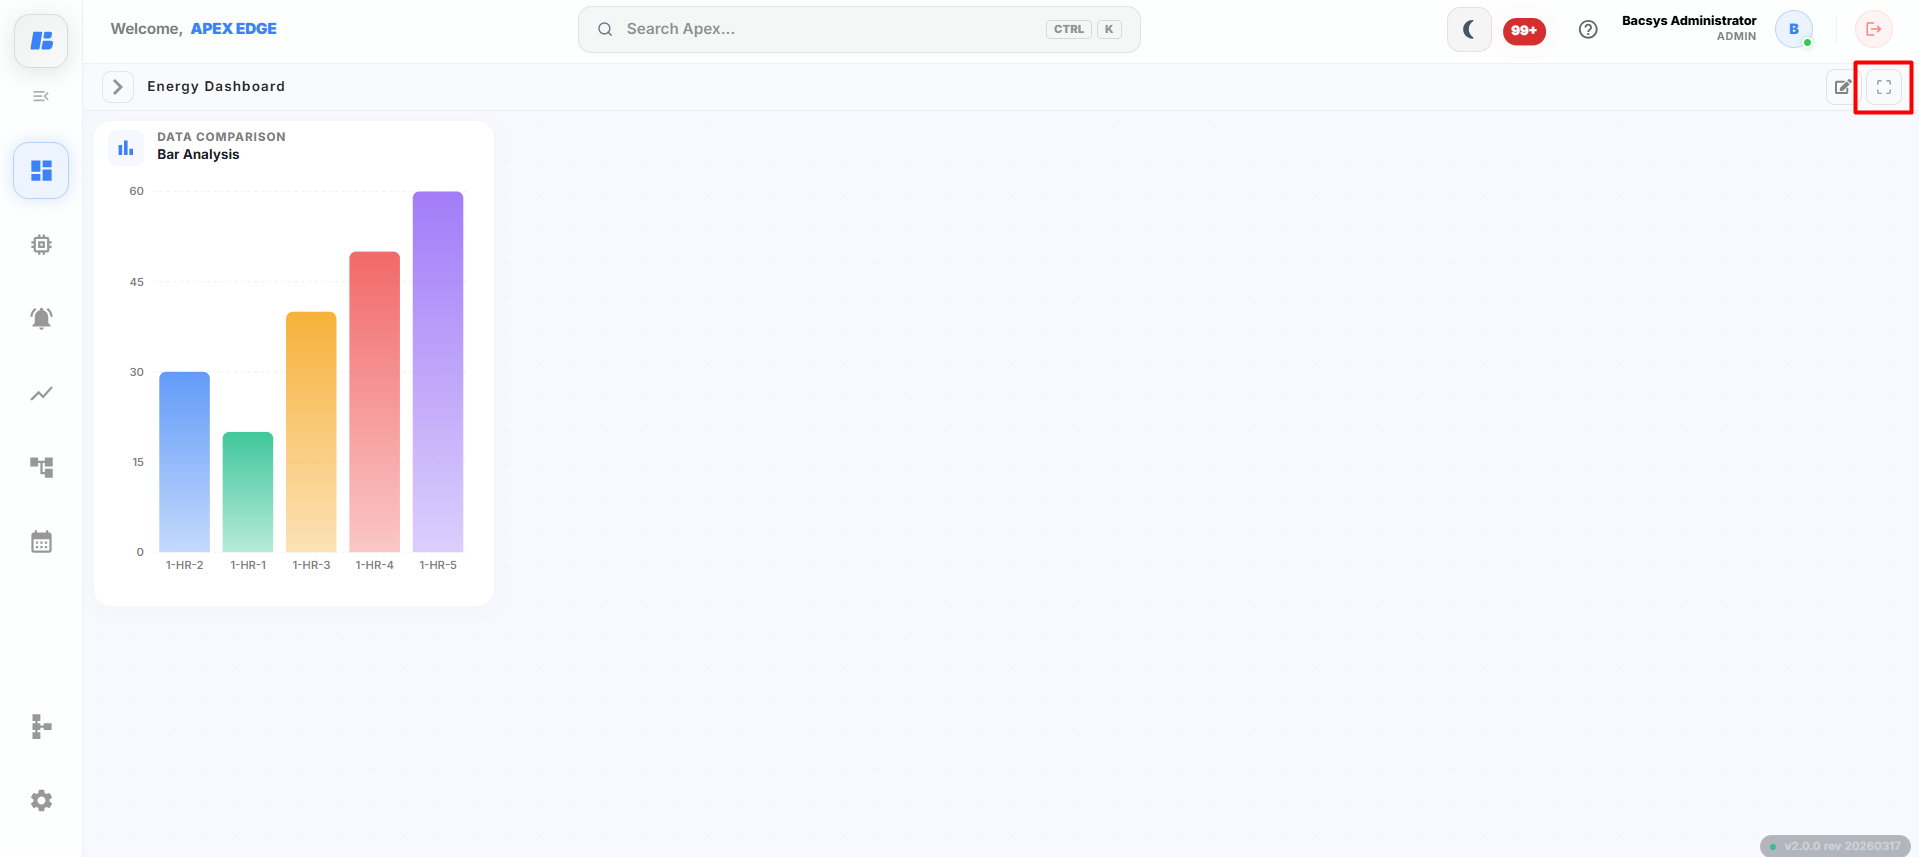
Opening Full Screen Mode
-
Open the required display.
-
Click the Full Screen icon on the toolbar.
The display expands to Full Screen Mode.
Using Full Screen Mode
In Full Screen Mode, you can:
- View the dashboard using the entire screen.
- Monitor all widgets with improved visibility.
- View charts, graphs, and values more clearly.
- Continue monitoring real-time data without changing the widget configuration.
- Navigate through the display while remaining in Full Screen mode.
Exiting Full Screen Mode
To return to the normal view:
-
Click the Exit Full Screen icon or press the Esc key.
The display returns to the standard view.
Display Widget Workflow
All widgets in the Display module follow the same configuration workflow. The only difference between widgets is the available configuration options.
Workflow
-
Open the required display.
-
Click the + icon on the display canvas.
The Widget Library opens.
-
Drag and drop the required widget onto the canvas.
The Widget Settings panel appears.
-
Configure the widget using the available settings.
Depending on the selected widget, configure the required options such as:
- Title
- Select Type
- Select Point(s)
- Date Range
- Poll Frequency
- Font and Background settings
- Other widget-specific options
-
Click Save Configuration.
The widget is added to the display canvas.
-
Arrange and resize the widget as required.
-
Click Save on the display toolbar.
The display is saved successfully.
Note:
- Widgets that use Trend Value require Trend Logging to be enabled for the selected point.
- Widgets that display alarms require Alarm Configuration to be enabled.
- Widgets that perform control actions (such as Command and Switch) require a writable point.