

Trends
The Trends module allows users to monitor, analyze, and compare historical and real-time data collected from configured device points.
Using the Trends module, users can:
- View real-time and historical values of device points.
- Display trend data in both Table and Chart views.
- Refresh and monitor live trend data.
- Export trend data for reporting and analysis.
- Compare trends from multiple points simultaneously.
- View saved trends for an individual point directly from the Devices module.
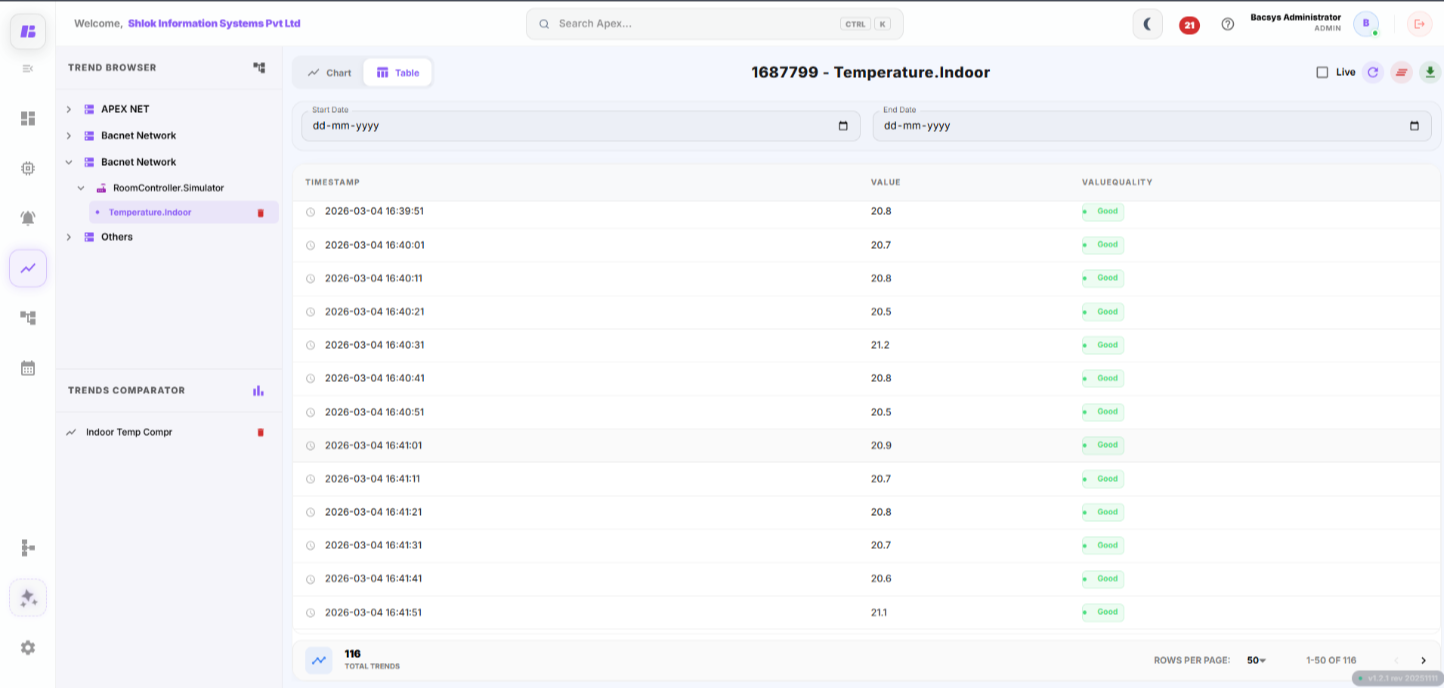
Trends - Table View
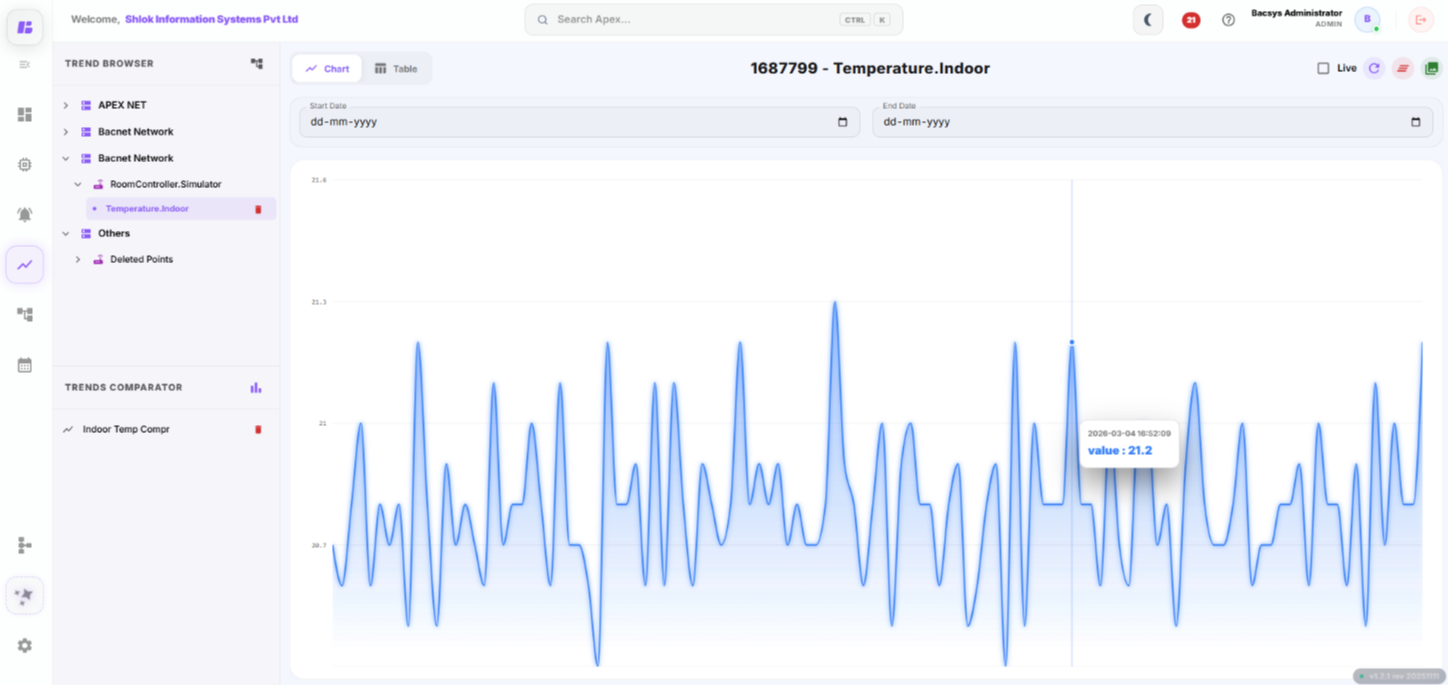
Trends - Chart View
Opening the Trends Module
Step 1
Navigate to the Trends module from the sidebar.
Step 2
Click the Menu (Menu) icon to open the browser panel.
You can also use:
- (>) to expand the browser panel.
- (<) to collapse the browser panel.
The browser panel contains:
- Trends Navigator
- Trends Comparator
Viewing Trends in Table View
The Table View displays recorded values of a selected point in tabular format.
Step 1
In the Trends Navigator, select the required device point.
Step 2
Click the Table tab.
The trend history for the selected point is displayed.
Managing Table Trends
Live Data
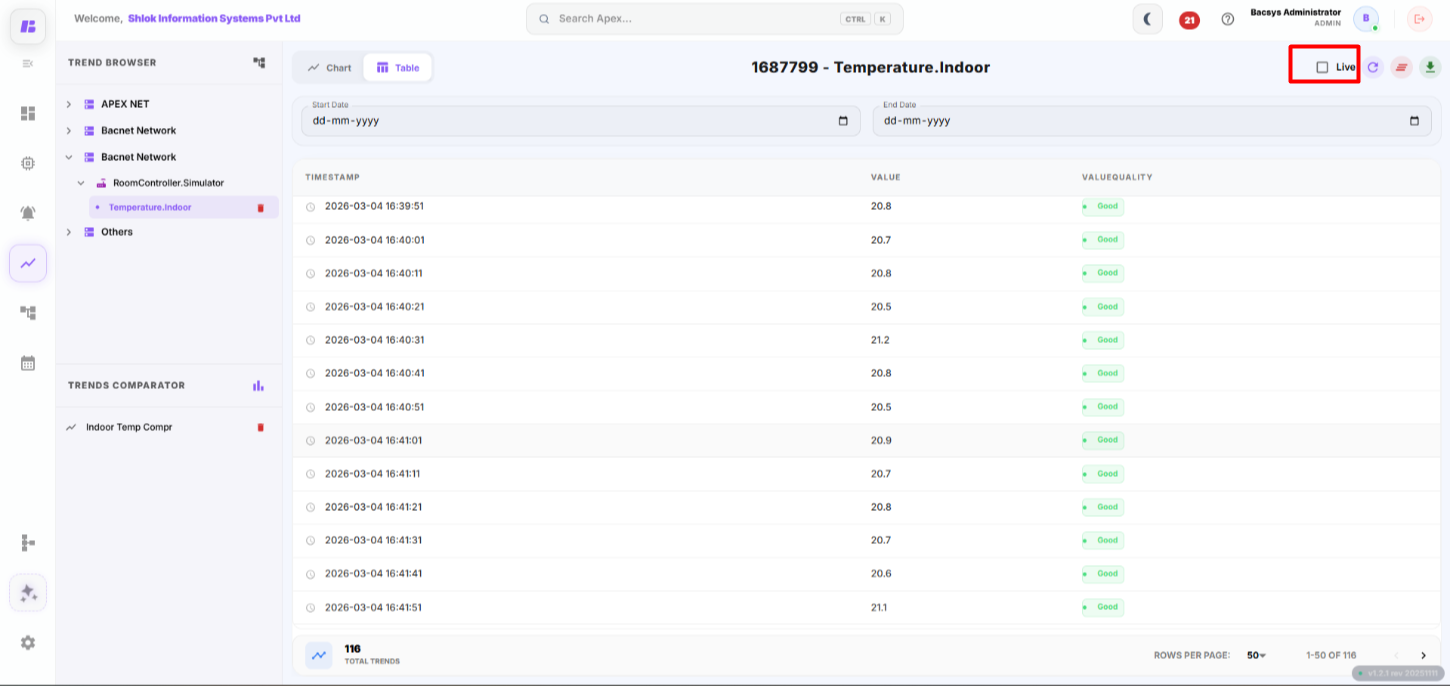
Enable the Live Data checkbox to continuously receive live updates from the selected point.
Refresh
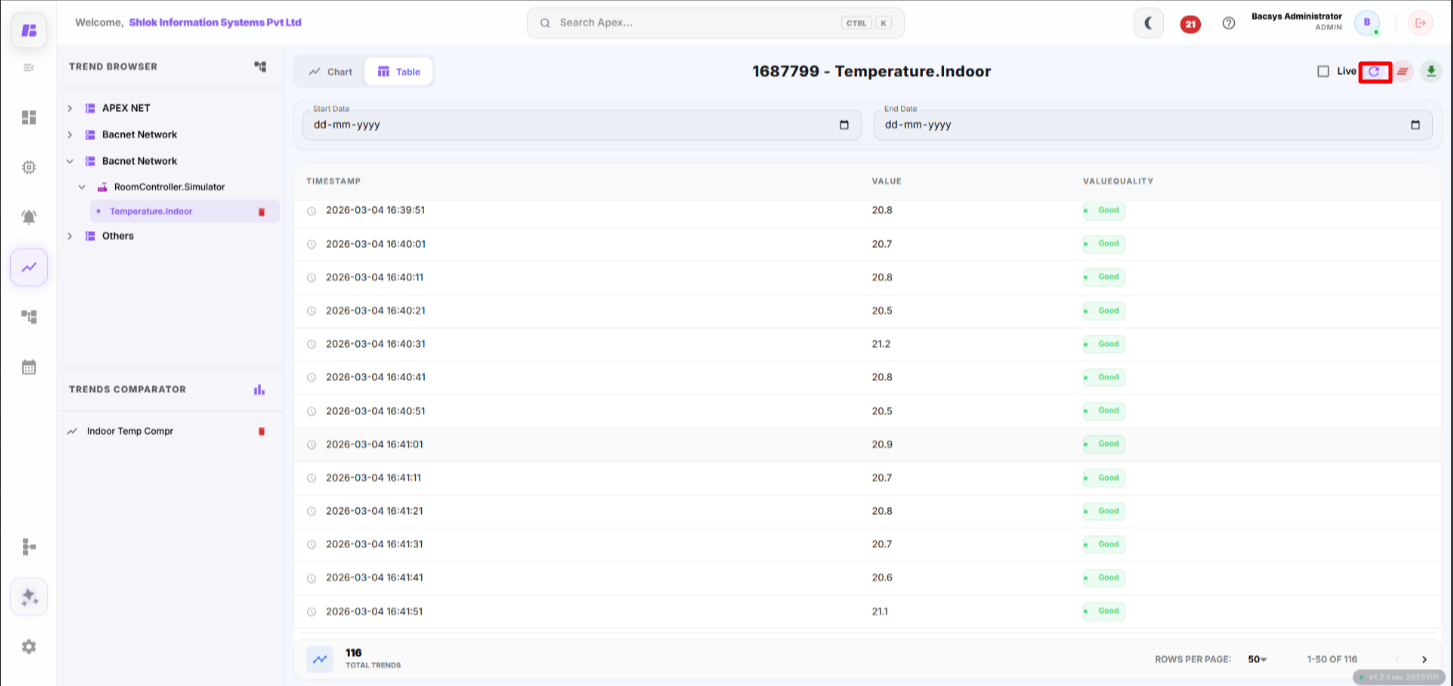
Click Refresh to retrieve the latest trend values from the selected point.
Clear Trends
Click Clear Trends to remove the recorded trend history for the selected point.
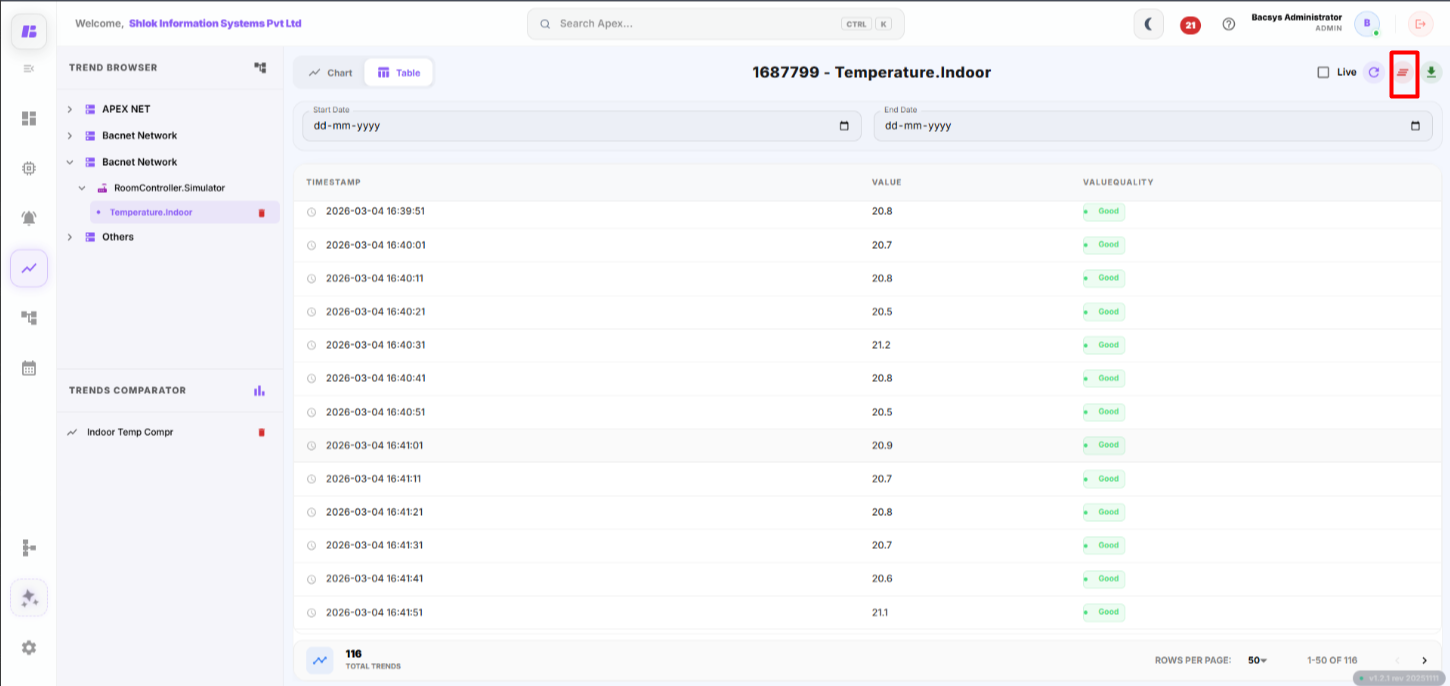
Export Table
Click Export Table to download the displayed trend data as a CSV file.
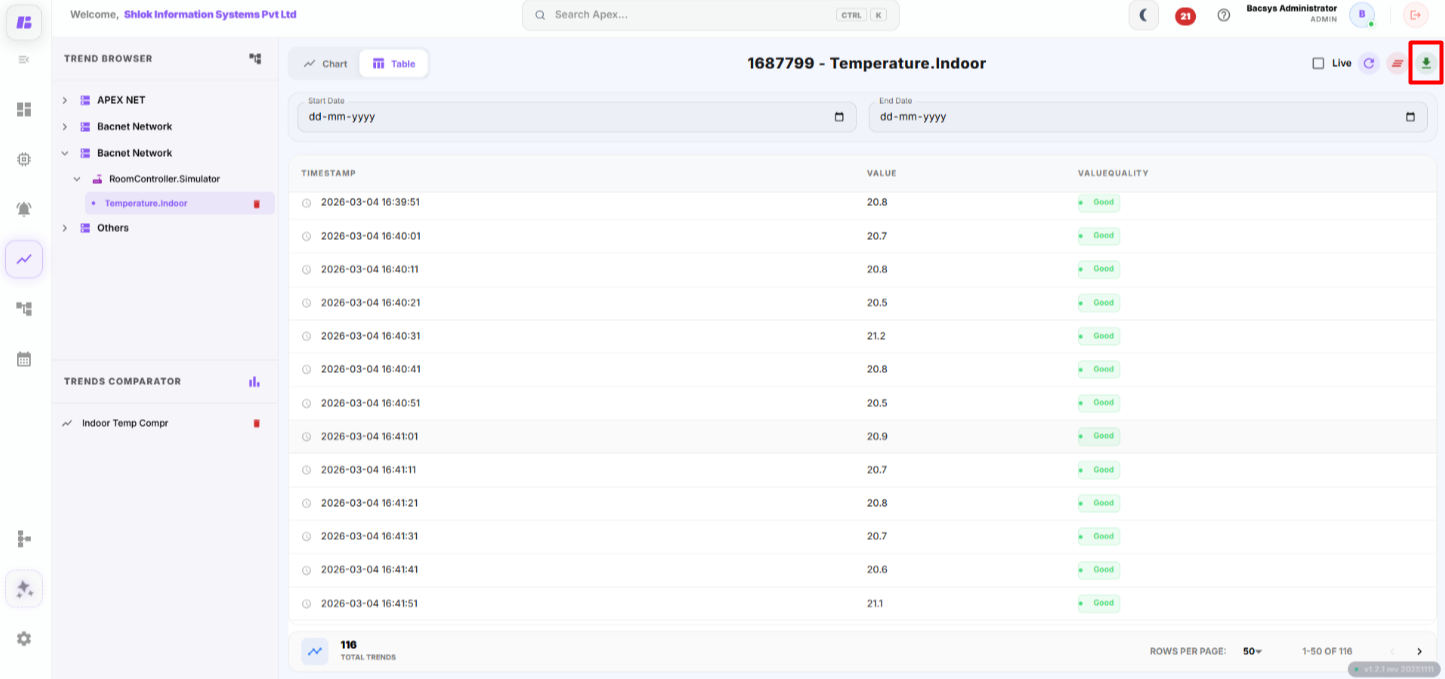
Table Columns
| Column | Description |
|---|---|
| Timestamp | Displays the date and time when the trend value was recorded. |
| Value | Displays the recorded value of the selected point. |
| Value Quality | Indicates whether the received value is Good or Bad. A Good status indicates successful communication, while Bad indicates a communication issue or unavailable data. |
Viewing Trends in Chart View
The Chart View displays trend values graphically.
Step 1
Select the required device point from the Trends Navigator.
Step 2
Click the Chart tab.
The recorded trend values are displayed as a graph.
Managing Chart Trends
Live Data
Enable Live Data to automatically update the chart with the latest values.
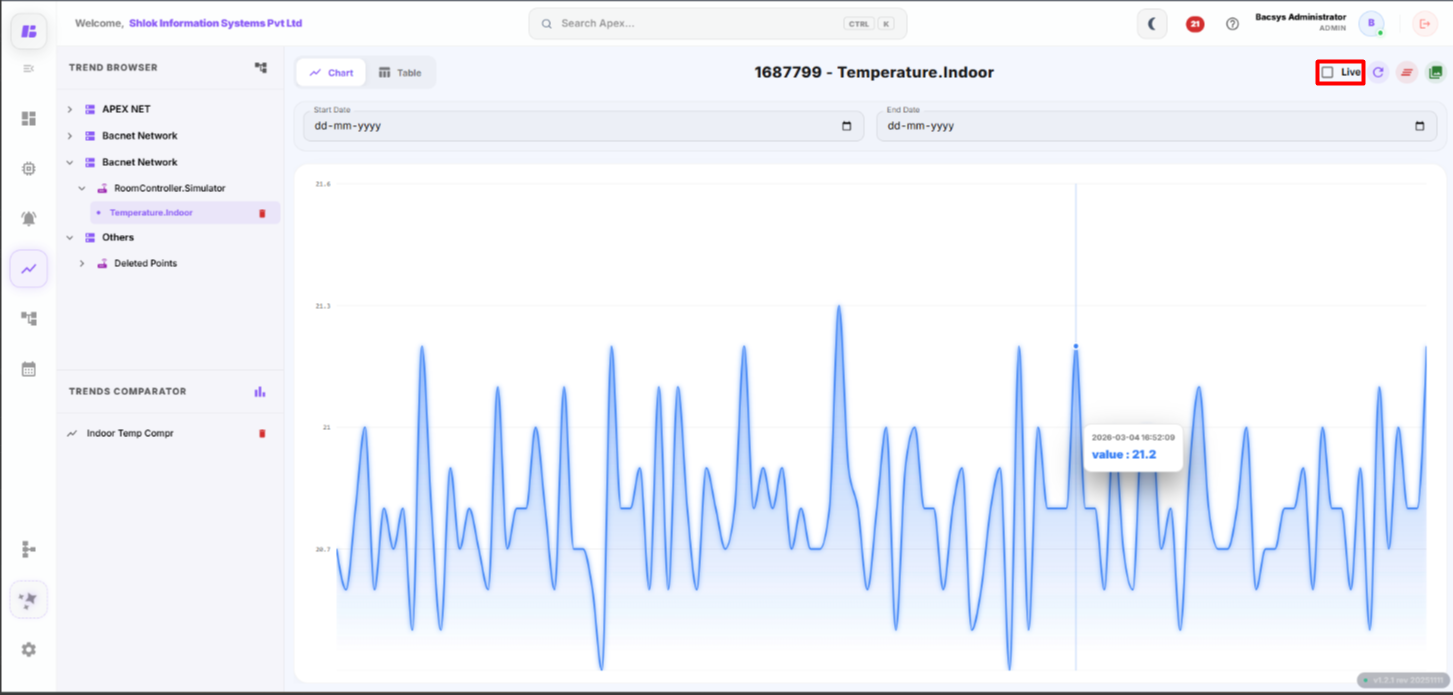
Refresh
Click Refresh to update the chart with the latest trend values.
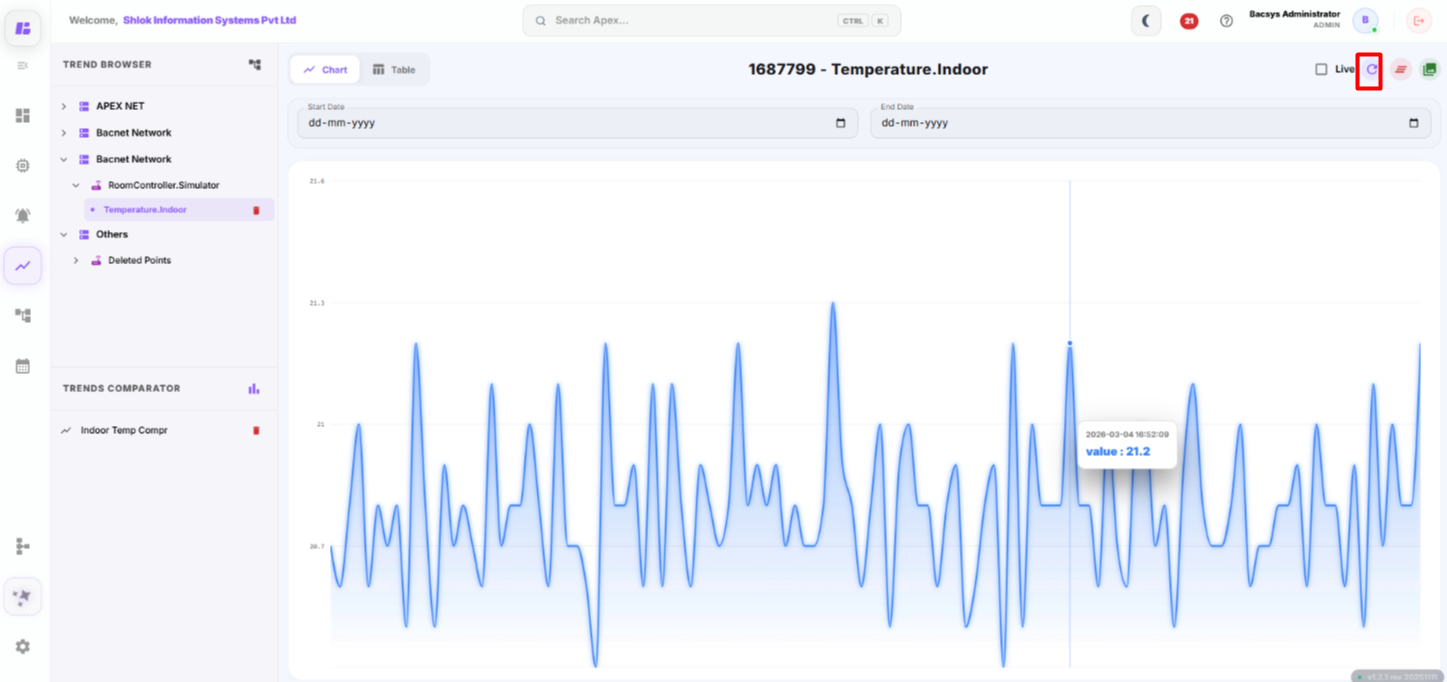
Clear Trends
Click Clear Trends to remove the recorded trend history from the chart.
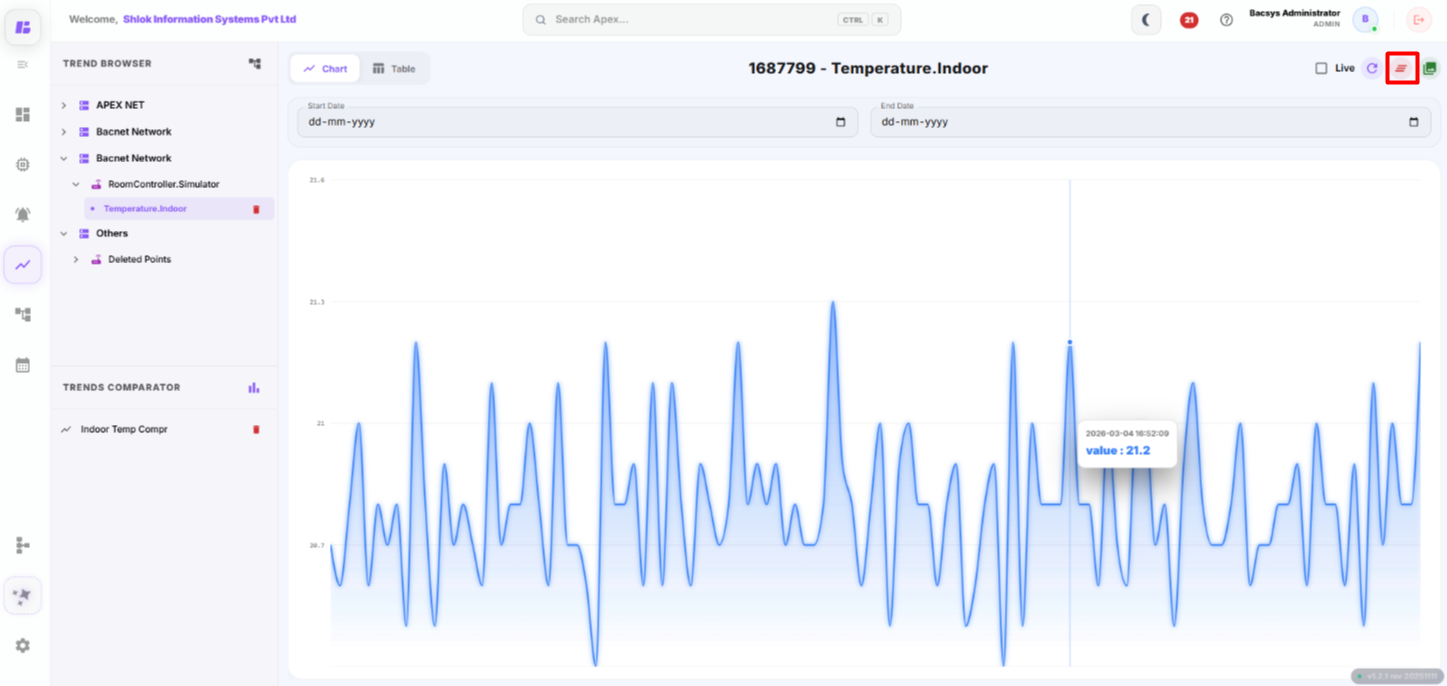
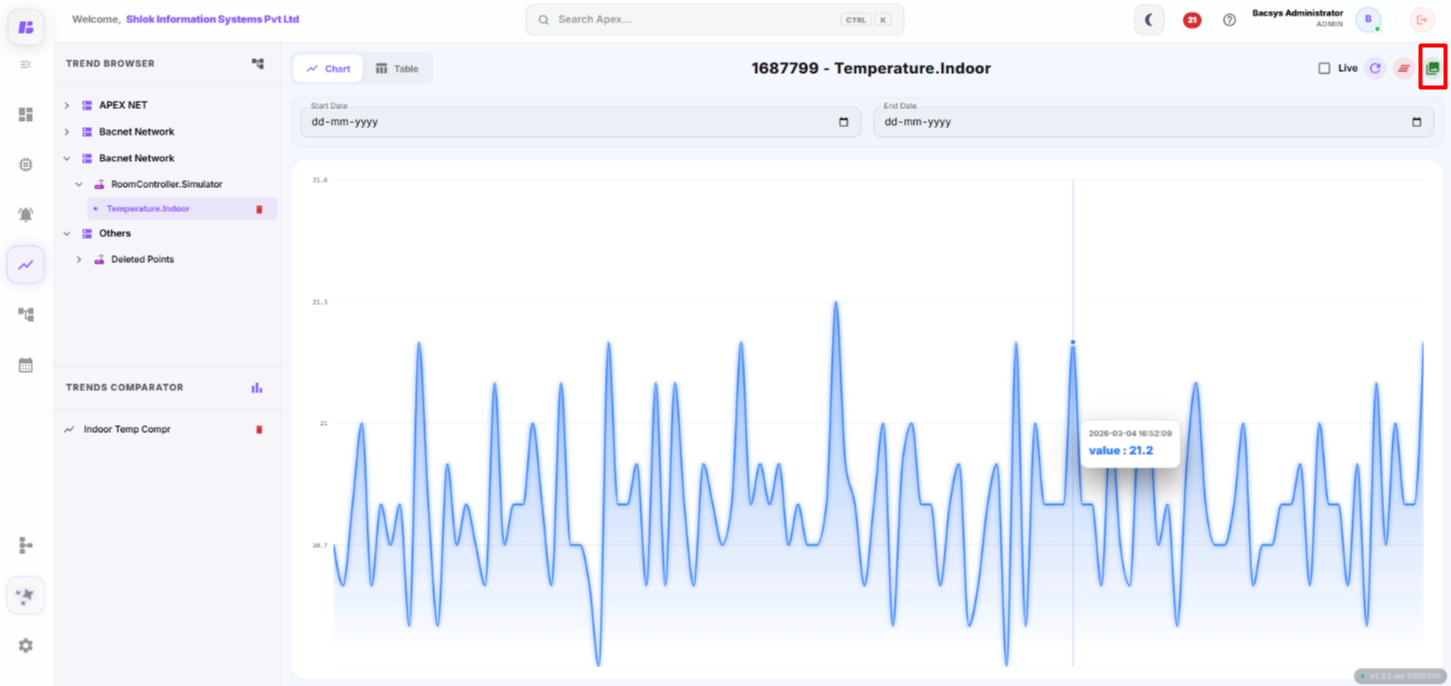
Export Chart
Click Export Chart to download the chart as an image (PNG).
Comparing Trends
The Trends Comparator allows users to compare multiple points on a single chart.
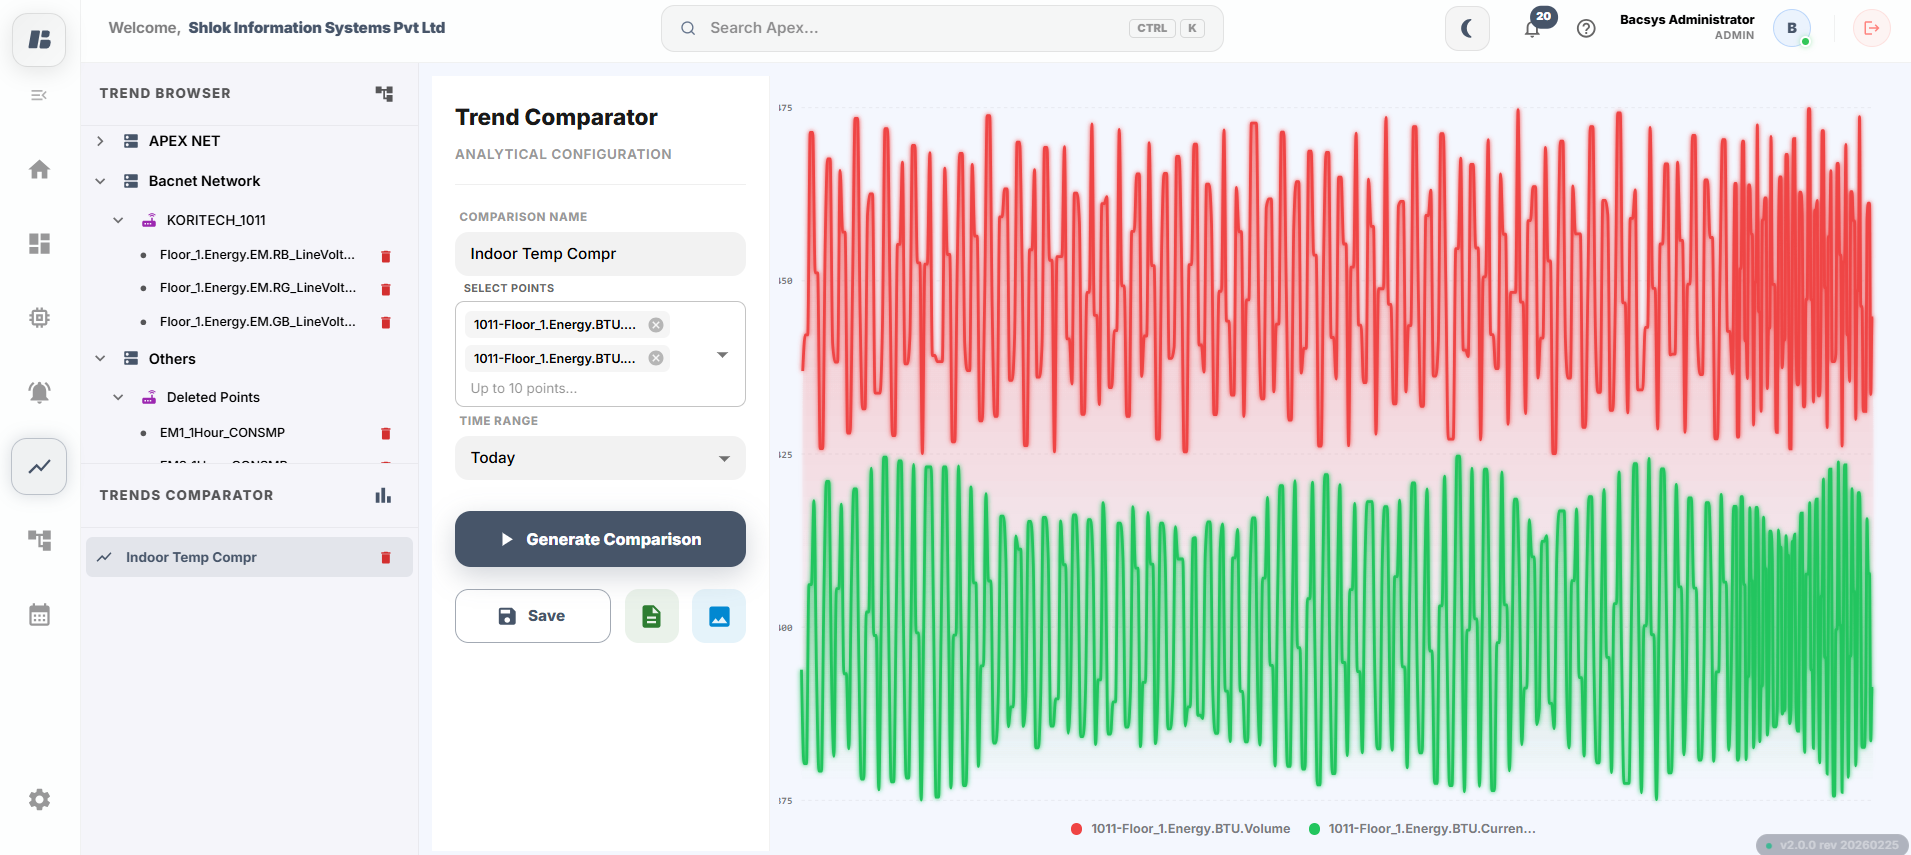
Step 1
Click Compare Trend.
Step 2
Enter a unique name in the Comparison Name field.
Step 3
Select between 2 and 10 device points in the Select Points field.
Step 4
Choose the required period in the Values to Show field.
Step 5
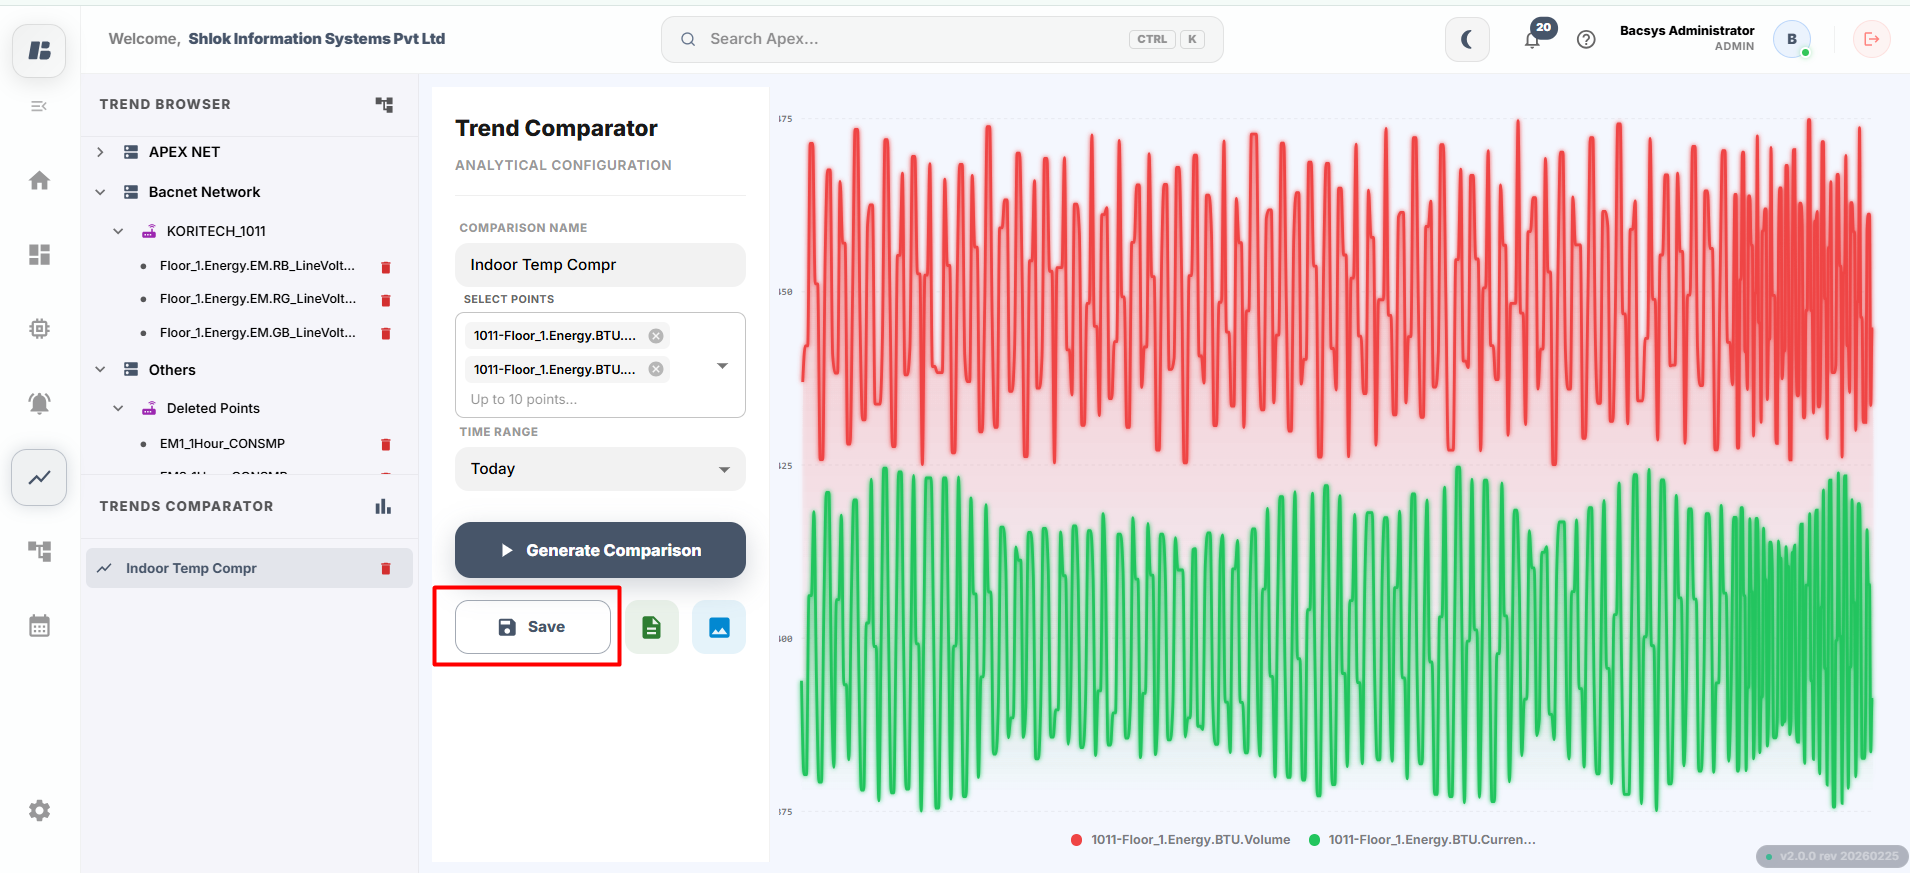
Click Save.
The comparison configuration is saved.
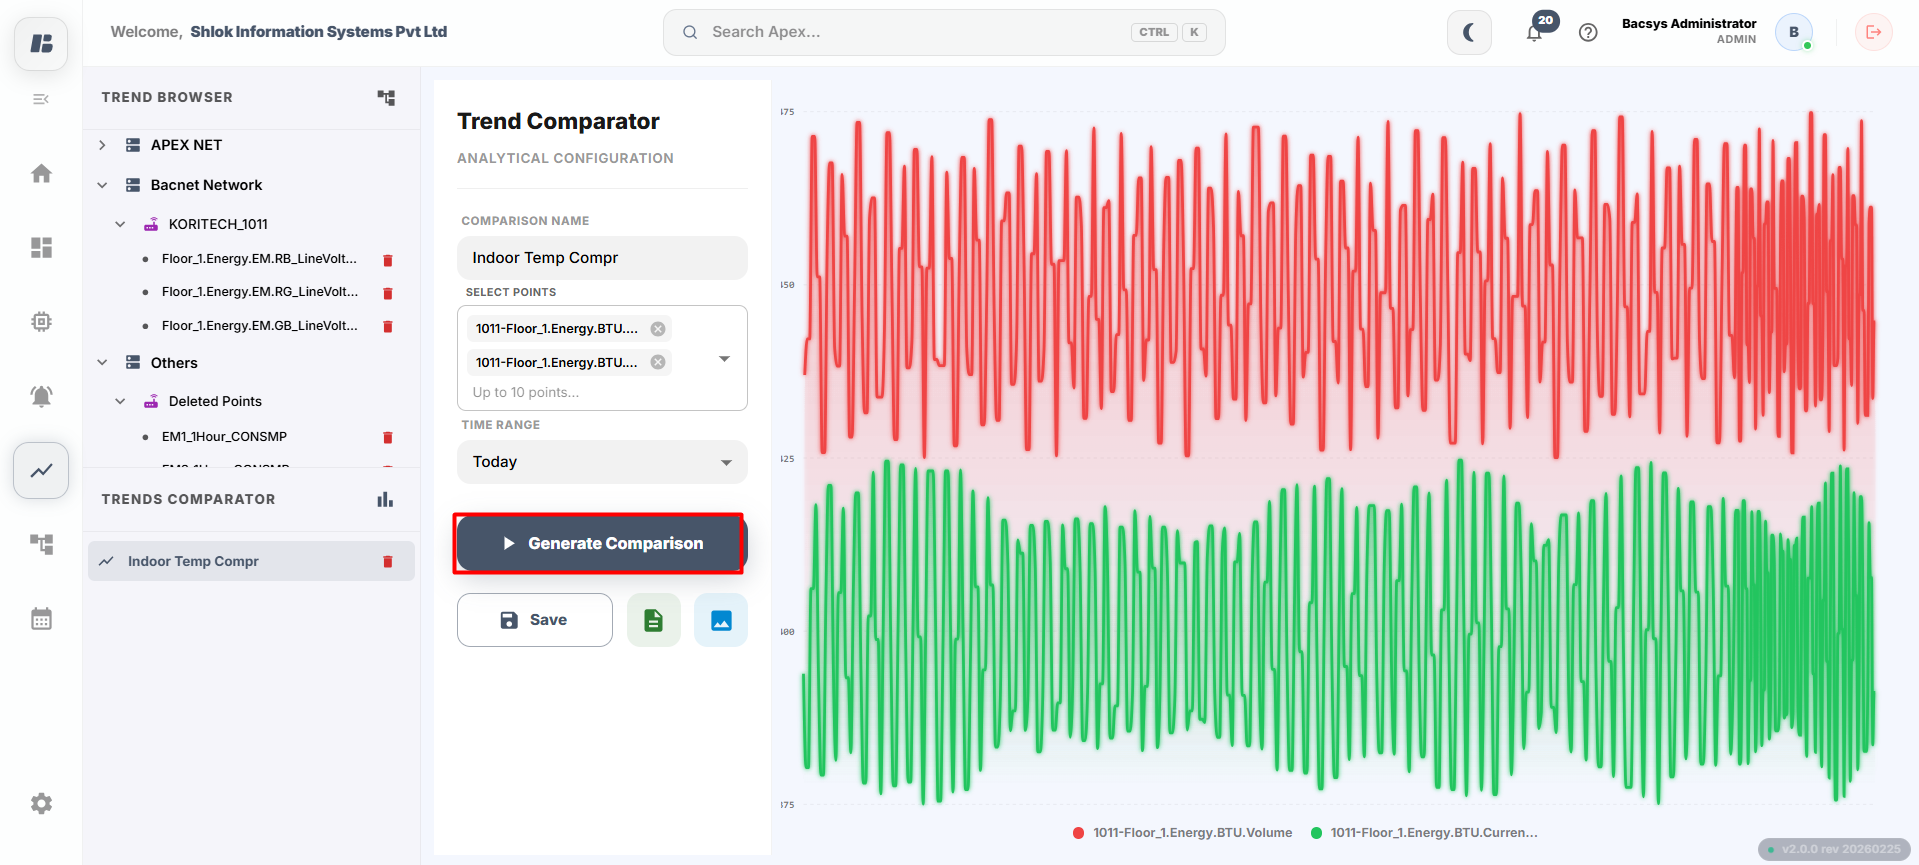
Step 6
Click Generate.
The comparison chart is generated.
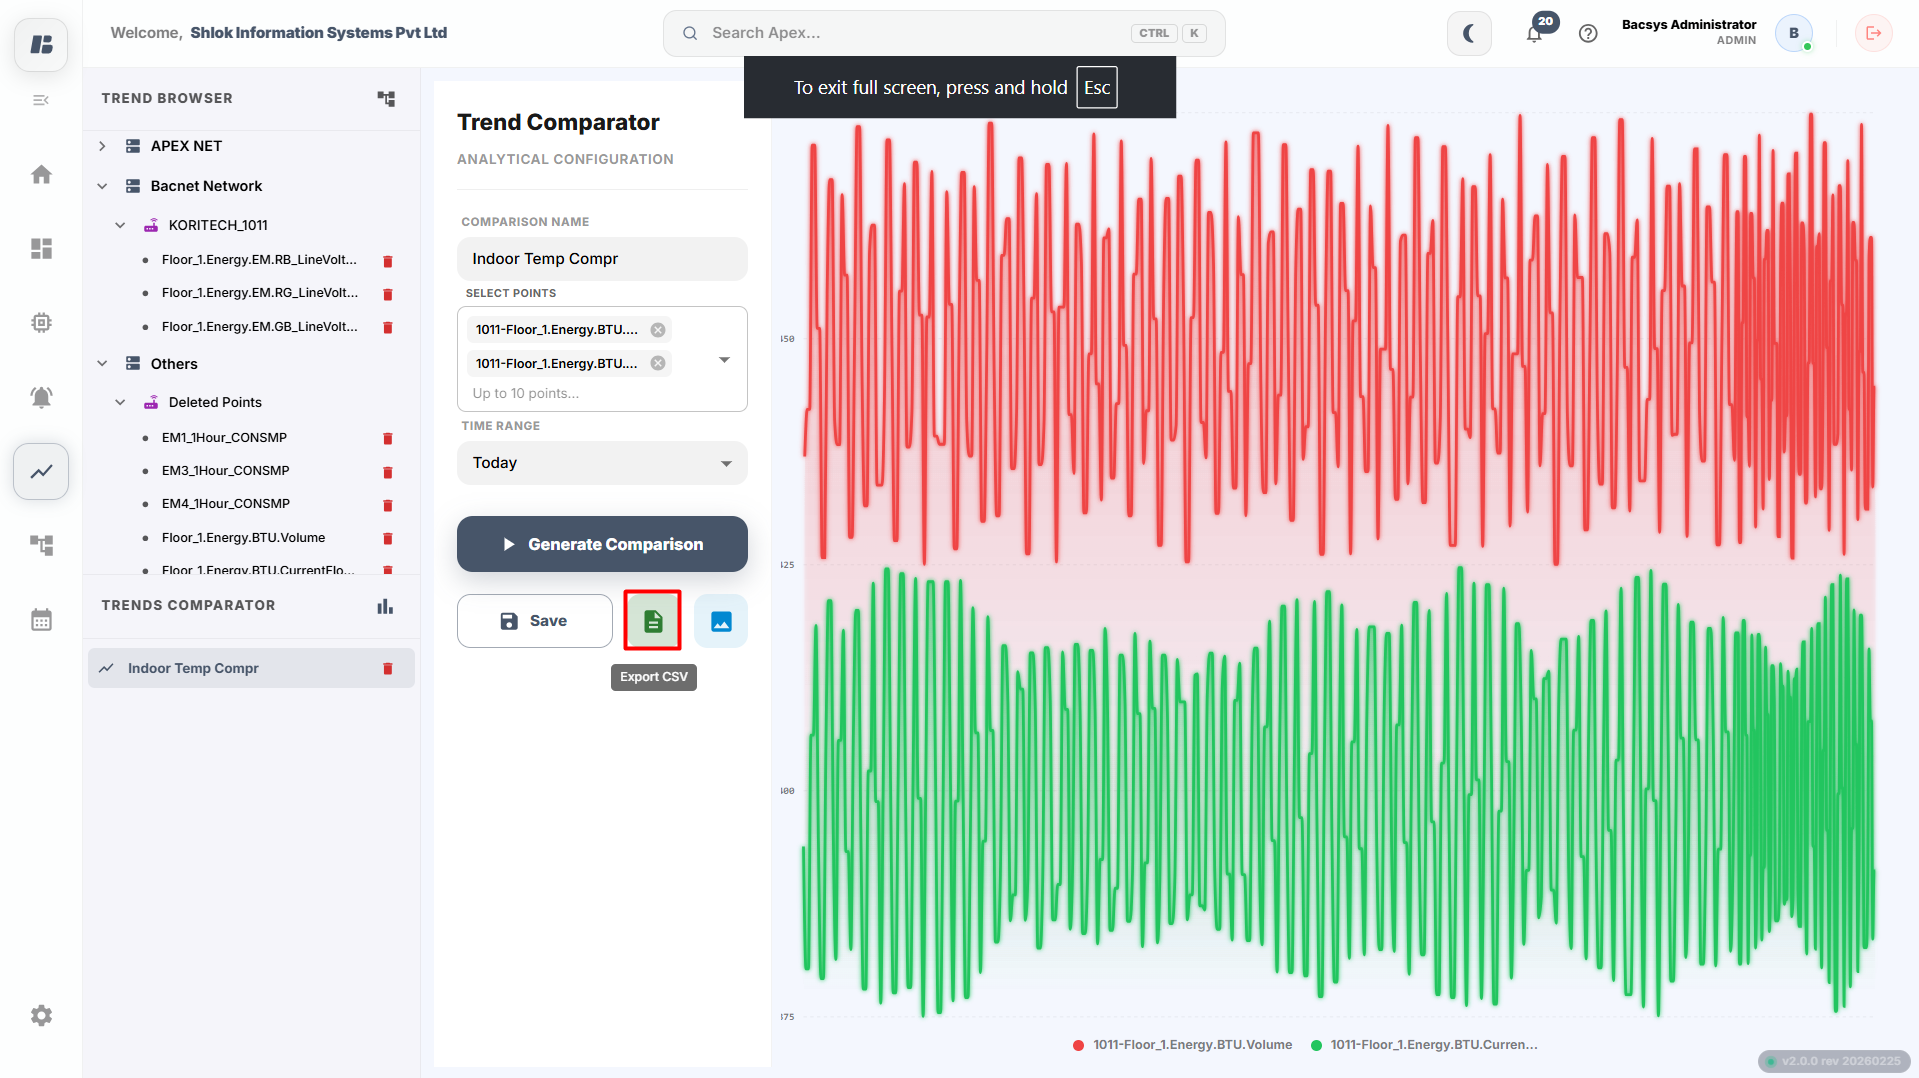
Step 7
Click Export CSV to download the comparison data in CSV format.
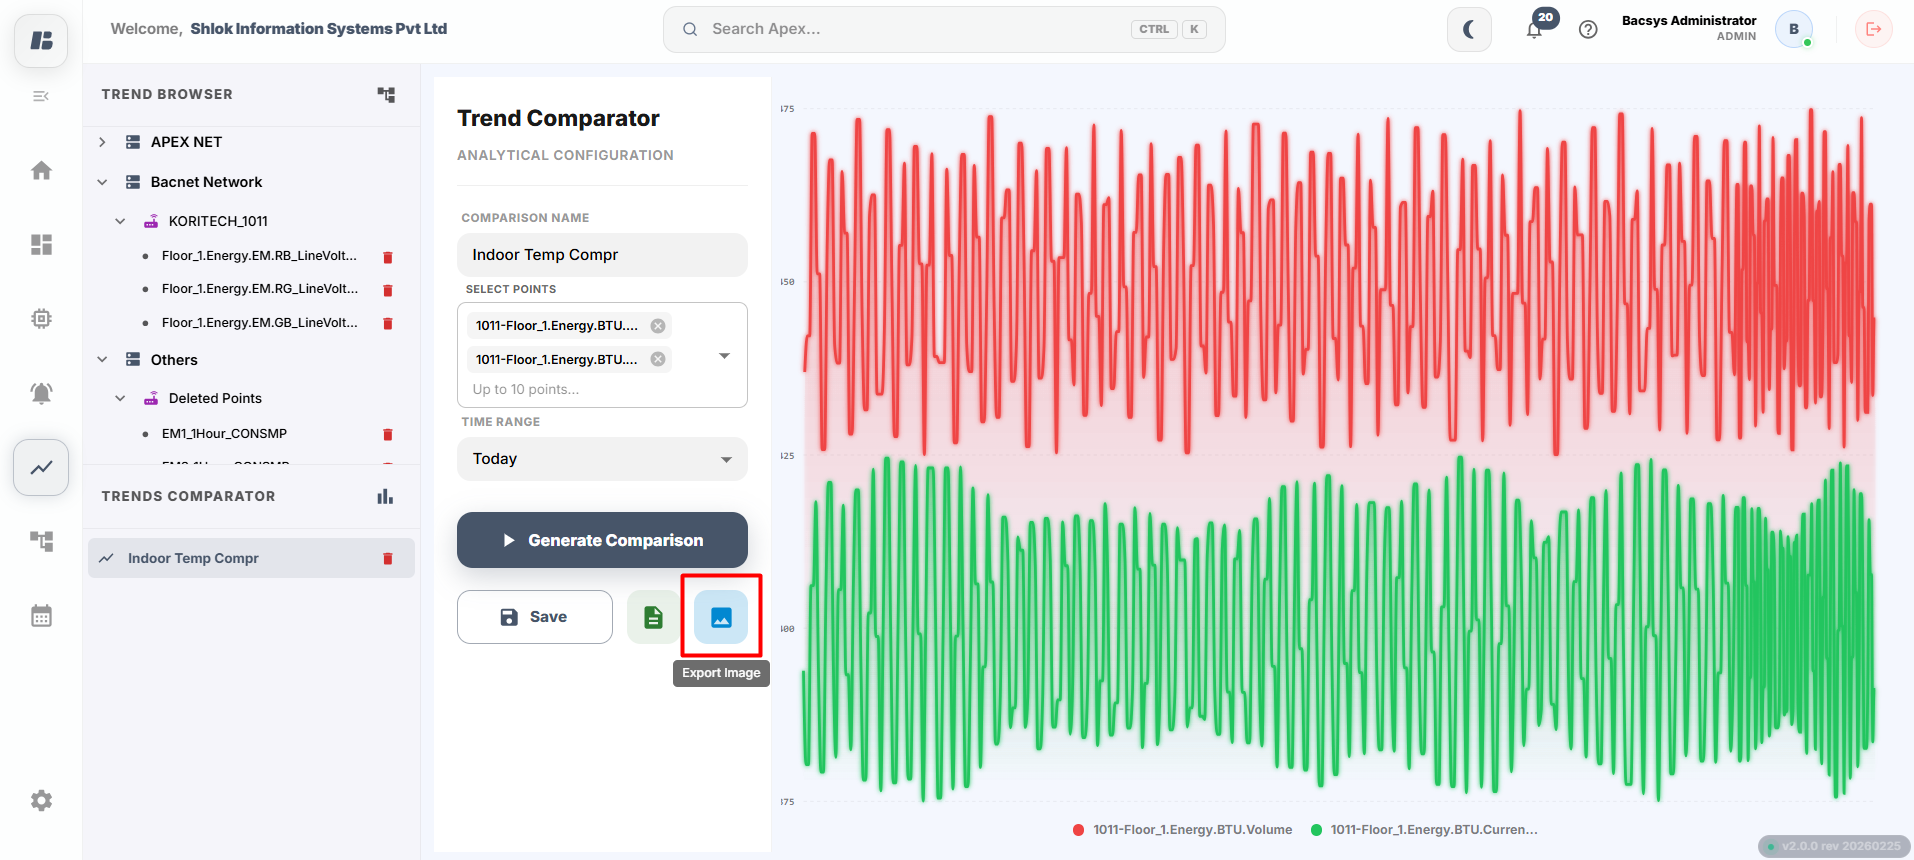
Step 8
Click Export Chart to download the comparison chart as a PNG image.
Managing Trend Comparisons
| Field | Description |
|---|---|
| Comparison Name | Displays or edits the name of the trend comparison. |
| Select Points | Adds or removes points included in the comparison. |
| Values to Show | Specifies the time period for displaying trend data. |
| Save | Saves the comparison configuration. |
| Generate | Generates the comparison chart using the selected settings. |
Viewing Saved Trends for a Particular Point
The Trends module displays trend information for all configured points. If you want to view trend history for a single point, you can access it directly from the Devices module.
Step 1
Navigate to the Devices module.
Step 2
Open the required Network.
Step 3
Select the required Device.
Step 4
Click the required Point.
Step 5
Open the Trends tab.
The page displays all trend records that have been saved for the selected point.
Users can view:
- Timestamp
- Recorded Point Value
- Value Quality
- Historical Trend Data
- Live Trend Updates (if enabled)
Users can also perform the following actions:
- Refresh the saved trend data.
- Clear the saved trend history.
- Export trend data as a CSV file.
- View the recorded data in Table format.
- View the recorded data in Chart format.
This feature allows users to analyze the historical values of an individual point without navigating to the main Trends module.
Complete Workflow
Follow the workflow below to monitor and analyze trend data:
- Open the Trends module from the sidebar.
- Expand or collapse the browser panel as required.
- Select the required device point from the Trends Navigator.
- View the recorded trend data in Table view.
- Enable Live Data to monitor real-time updates, if required.
- Click Refresh to retrieve the latest trend values.
- Click Clear Trends to remove the recorded trend history, if required.
- Click Export Table to download the displayed trend data as a CSV file.
- Switch to the Chart view to visualize the recorded trend data.
- Enable Live Data to automatically update the chart with the latest values.
- Click Refresh to update the chart with the latest trend data.
- Click Clear Trends to remove the chart history, if required.
- Click Export Chart to download the chart as an image.
- Open the Trends Comparator to compare multiple trend points.
- Enter a Comparison Name.
- Select the required device points for comparison.
- Choose the required Values to Show time period.
- Click Save to save the comparison configuration.
- Click Generate to display the comparison chart.
- Export the comparison data as a CSV file or download the comparison chart as an image, if required.
- To view trend history for a specific point, navigate to the Devices module, select the required Network, Device, and Point, and open the Trends tab.