

Display Browser
The Display Browser enables users to create fully customized dashboards to visualize data from connected devices and data points. With a variety of built-in widgets, users can design multiple dashboards tailored to specific monitoring and reporting needs.
Display Navigator
Used to create and configure dashboards using widgets, and to switch between different displays for monitoring.
Accessing the Display Module
- Click on the Display icon on the main menu.
- Click on (>) button to Expand or (<) button to collapse the browser menu.
- The browser menu lists all the created dashboard.
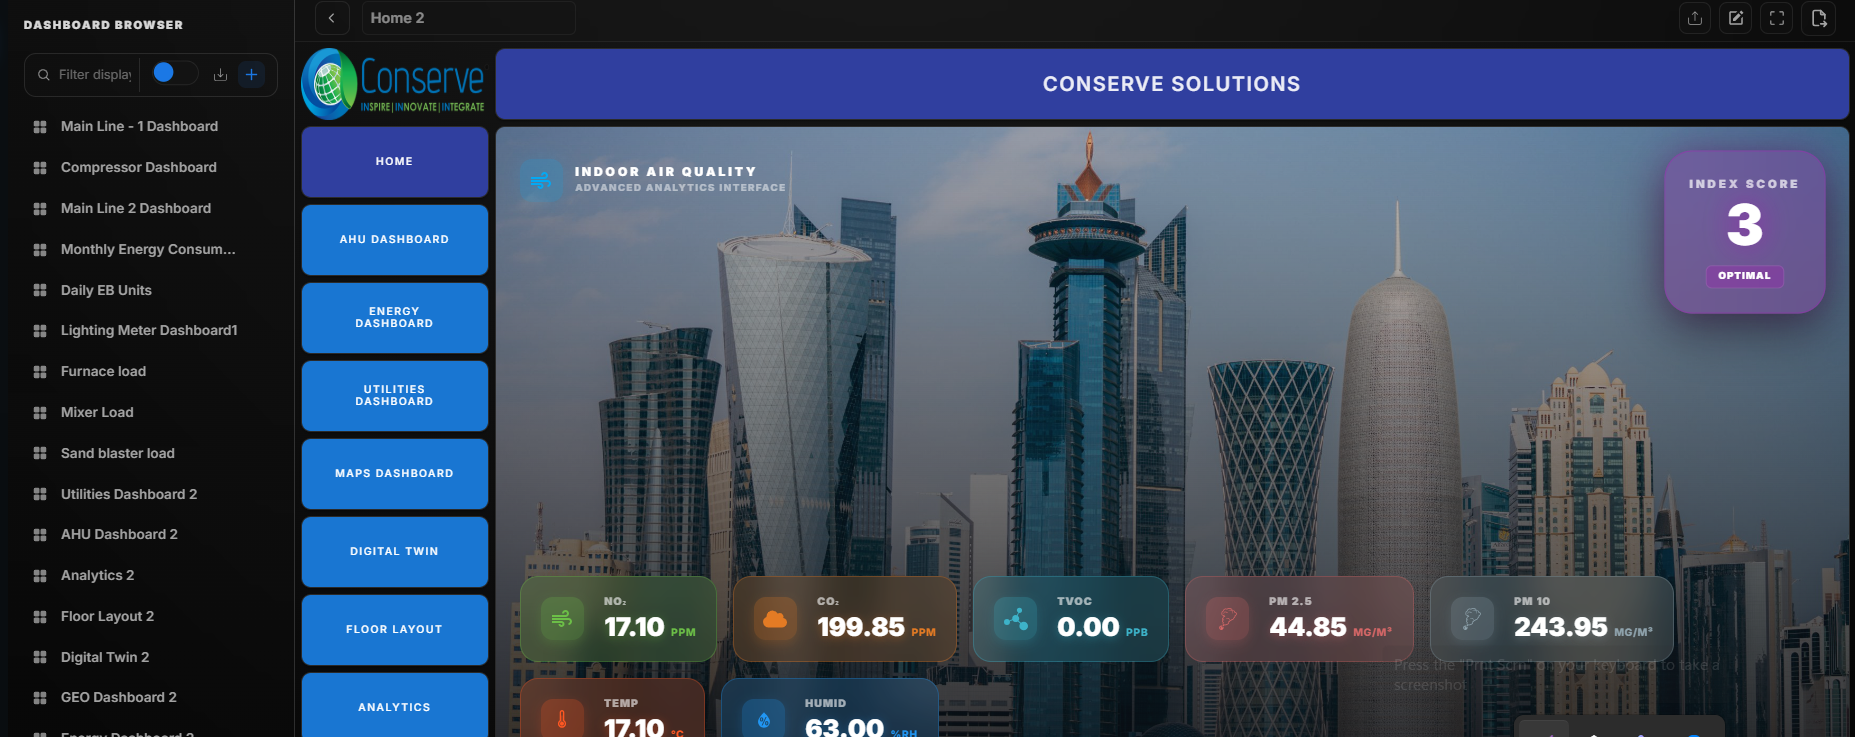 Display Screen
Creating a Display
By default, when you access the Display Navigator section, a new display is shown, which you can edit based on your preferences. Alternatively, you can create a new display by clicking the "+" button next to the Display Navigator switch.
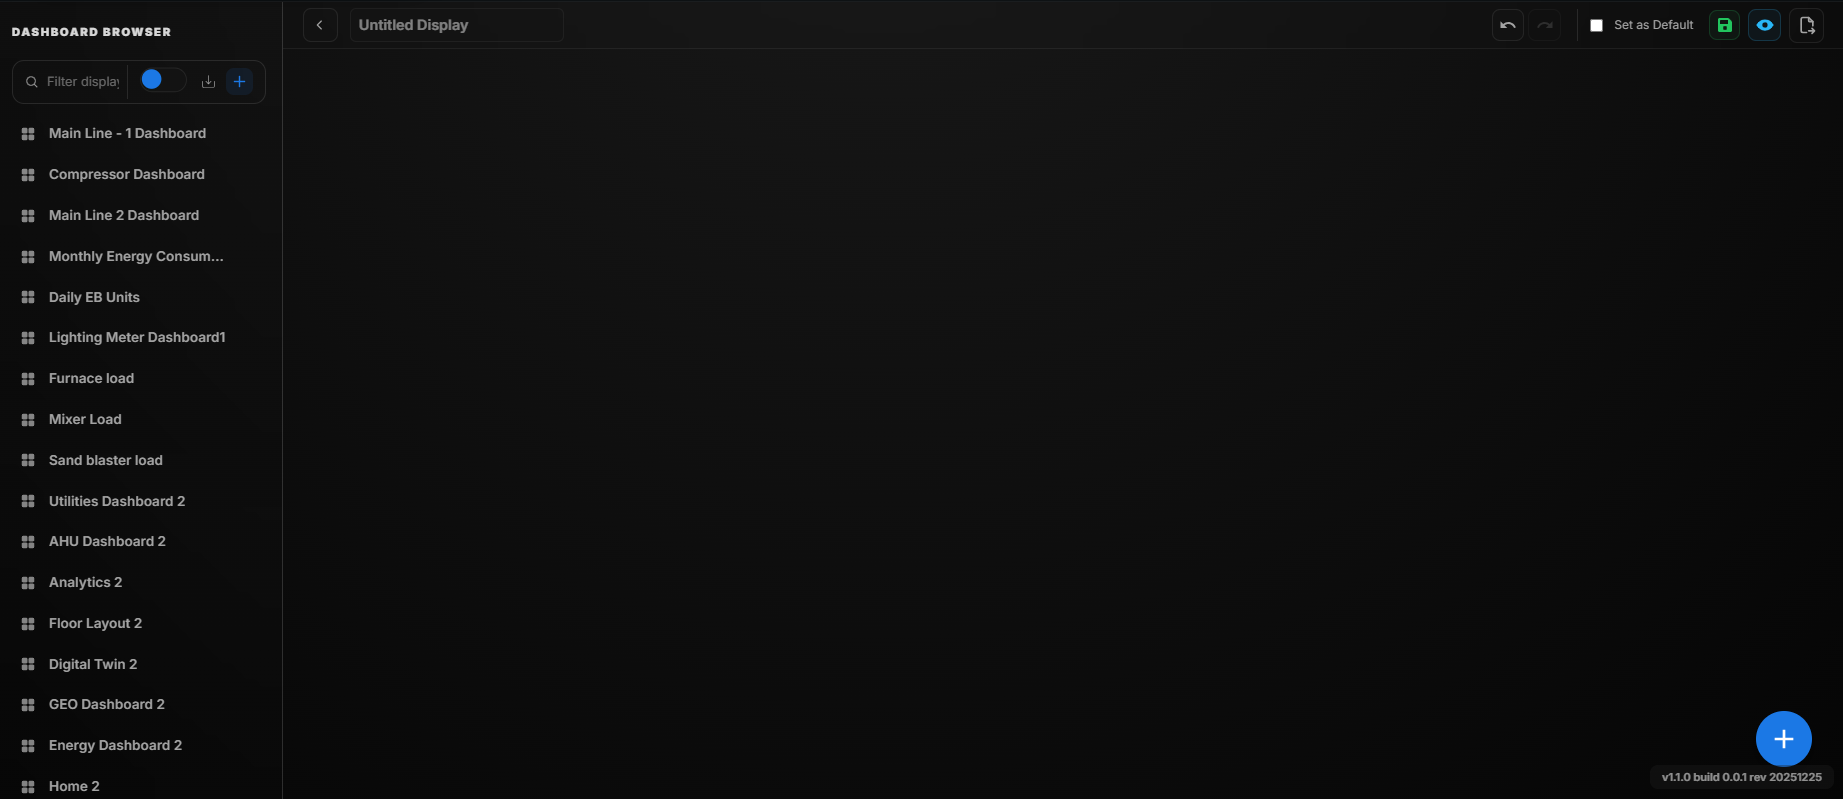 New Display Screen
-
Click on the Name Field to name the display page to a desired name, e.g., 'Energy Meter Dashboard'.
-
Once the name is entered, the new display is created with the given name.
-
Darg and drop any number of widgets from the Display Widgets and Floor Layout Widget pane into the canvas.
- To access the Display Widget and Floor Layout Widget pane, click on the Display Widgets icon and Floor Layout Widget icon located in the right most pane of the window.
Customizing a Display Widget
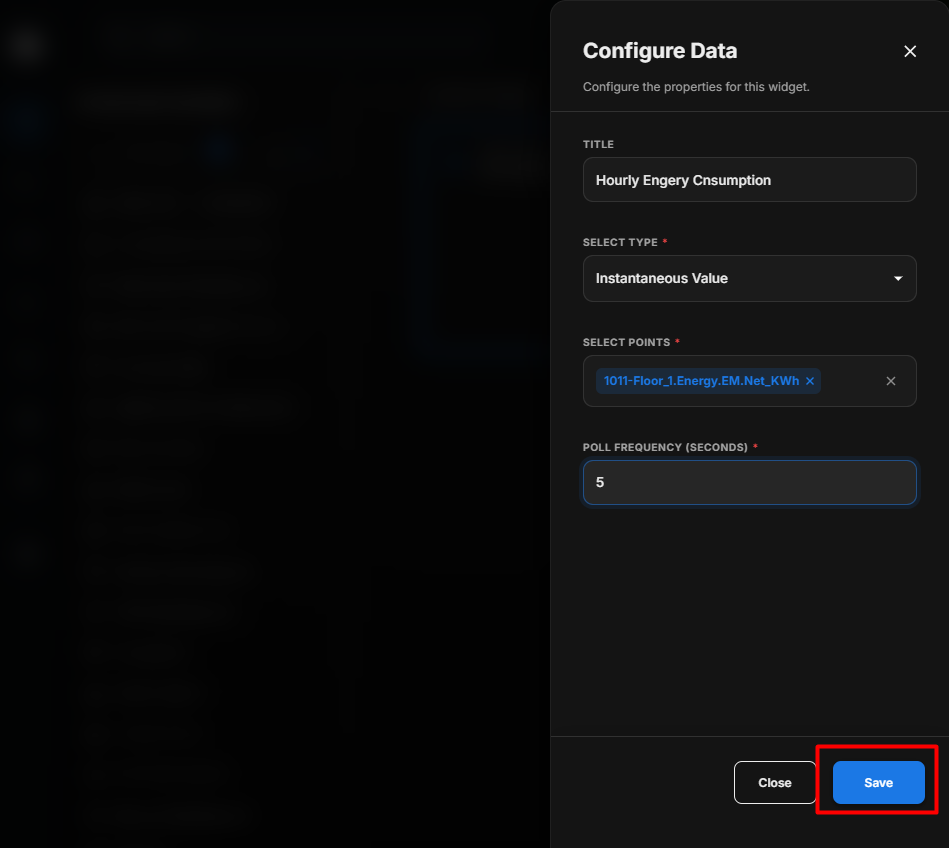 Customizing Display Widget
To customize a display widget within the dashboard canvas, follow these steps:
- Add a Widget
- Drag and drop the desired widget into the canvas area.
- Open Widget Settings
- Click the settings icon located at the top-right corner of the widget.
- Configure the Widget
- A Configure Data dialog box will appear with relevant fields to customize the widget.
- Apply Changes
- Fill in the appropriate details in the configuration fields and click the Save button. The updated values will be immediately reflected in the widget.
- Discard Changes (Optional)
- To discard the changes instead, click the Close button in the dialog box without saving.
Managing Widgets in the Canvas
- Move a Widget
- To reposition a widget, click and drag the move button located at the top-left corner of the widget. Release it at the desired location.
- Delete a Widget
- To remove a widget from the canvas, click the close button (X) at the top-right corner of the widget.
Display Widgets
There are 18 standard widgets available:
Display Widgets Configuration
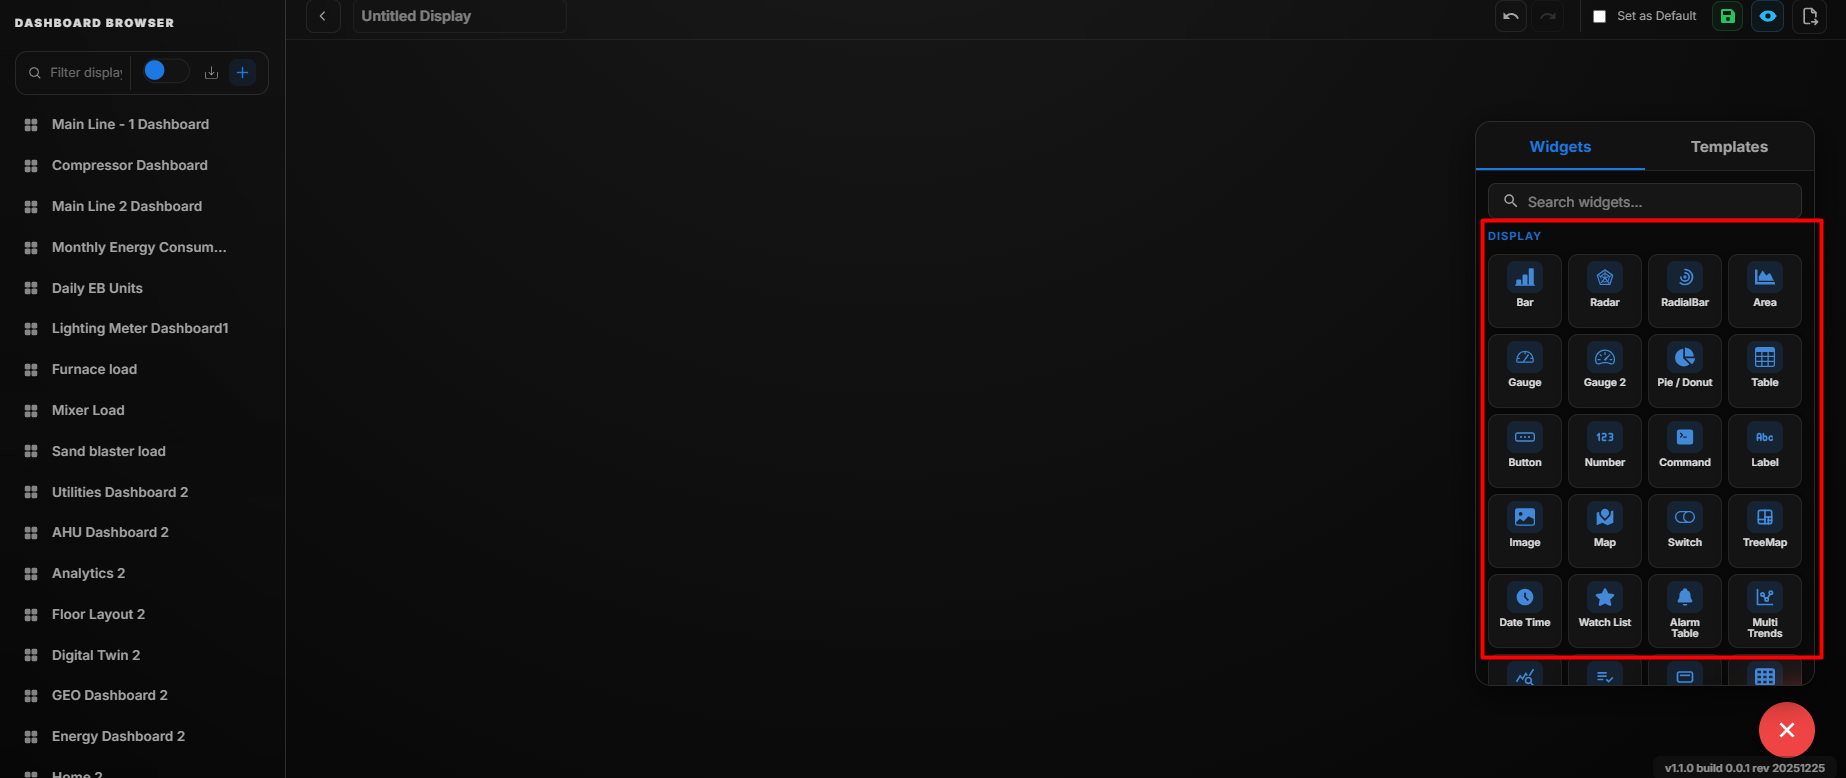 Display Widget
| Display Widget | Description | Fields |
|---|---|---|
| Bar | Displays a bar chart representing live or historical data for multiple points. | Title, Select Type, Select Points (max 5), Poll Frequency |
| Radar | Displays a radar chart comparing multiple data points in a circular layout. | Title, Select Points (max 10), Poll Frequency |
| Radial Bar Chart | Visualizes data in a circular bar format for multiple points. | Title, Select Points (max 10), Poll Frequency |
| Area Chart | Shows trends over time using shaded area under line graphs. | Title, Select Type, Select Points (max 5), Poll Frequency |
| Gauge Chart | Visualizes a single data point on a semi-circular gauge scale. | Title, Select Points (max 1), Poll Frequency |
| Pie Chart | Displays proportionate distribution of values using a pie chart. | Title, Select Points (max 5), Poll Frequency |
| Table | Shows tabular data for multiple points. | Title, Select Points, Poll Frequency, Hide Write Points Fields |
| Button | Navigational button used to switch between displays. | Button/Link Title, Select Display, Choose Button Color |
| Number | Displays a single numeric value with optional formatting. | Title, Select Points (max 1), Poll Frequency, Hide Decimal Value |
| Command | Provides an interface to trigger control commands on a selected point. | Select Points (max 1) |
| Label | Static text label used for annotations or section headings. | Label, Font Size |
| Image | Embeds an image within the dashboard. | Drag and Drop / Browse Image |
| Map | Visualizes device locations on an interactive map. | No configurable fields |
| Switch | Toggle interface used for ON/OFF control of a selected point. | Title, Select Points (max 1), Poll Frequency |
| Tree Map | Represents hierarchical data using nested rectangles. | Title, Select Points (max 20), Poll Frequency |
| Date Time | Displays the current date and time. | Font Size, Poll Frequency |
| Watch List | Shows a list of selected data points for quick monitoring. | Title, Poll Frequency |
| Alarm Table | Displays a table view of system alarms with filtering options. | Title, Select Site, Severity Filter, Status Filter, Poll Frequency |
| Multi Trends | Displays multiple trend lines for comparison over time. | Title, Select Points (max 10), Time Range, Poll Frequency |
| Statistics | Shows aggregated statistical values such as Min, Max, Average, and Total. | Title, Select Points, Aggregation Type, Time Range |
| Select Header | Displays a customizable section header for organizing dashboard content. | Header Title, Font Size, Alignment |
| Heatmap | Visualizes data intensity variations using color gradients. | Title, Select Points, Time Range, Poll Frequency |
| Timeline Chart | Displays events or data points along a time-based horizontal axis. | Title, Select Points, Time Range |
| Bubble Chart | Represents three-dimensional data using bubbles of varying size. | Title, Select Points (max 5), Poll Frequency |
| Reports Card | Displays summarized report information in a card layout. | Title, Select Report, Time Range |
| Value Widget | Displays a key value with optional threshold-based color indication. | Title, Select Points (max 1), Poll Frequency, Threshold Settings |
| IAQ Widget | Displays Indoor Air Quality metrics such as CO₂, temperature, and humidity. | Title, Select IAQ Points, Poll Frequency |
| Polar Chart | Displays data in polar coordinate format for angular comparison. | Title, Select Points (max 10), Poll Frequency |
| Scatter Chart | Displays data distribution using plotted points on X and Y axes. | Title, Select X-Axis Point, Select Y-Axis Point, Poll Frequency |
| Composed Chart | Combines multiple chart types (e.g., bar, line, area) into a single visualization. | Title, Select Points, Chart Type Mix, Poll Frequency |
Field Descriptions
Add and Configure the Bar Widget
The Bar Widget is used to display point values in a bar-style visualization. It allows users to monitor selected points directly from the display and configure how the values are presented.
-
Click the + icon.
-
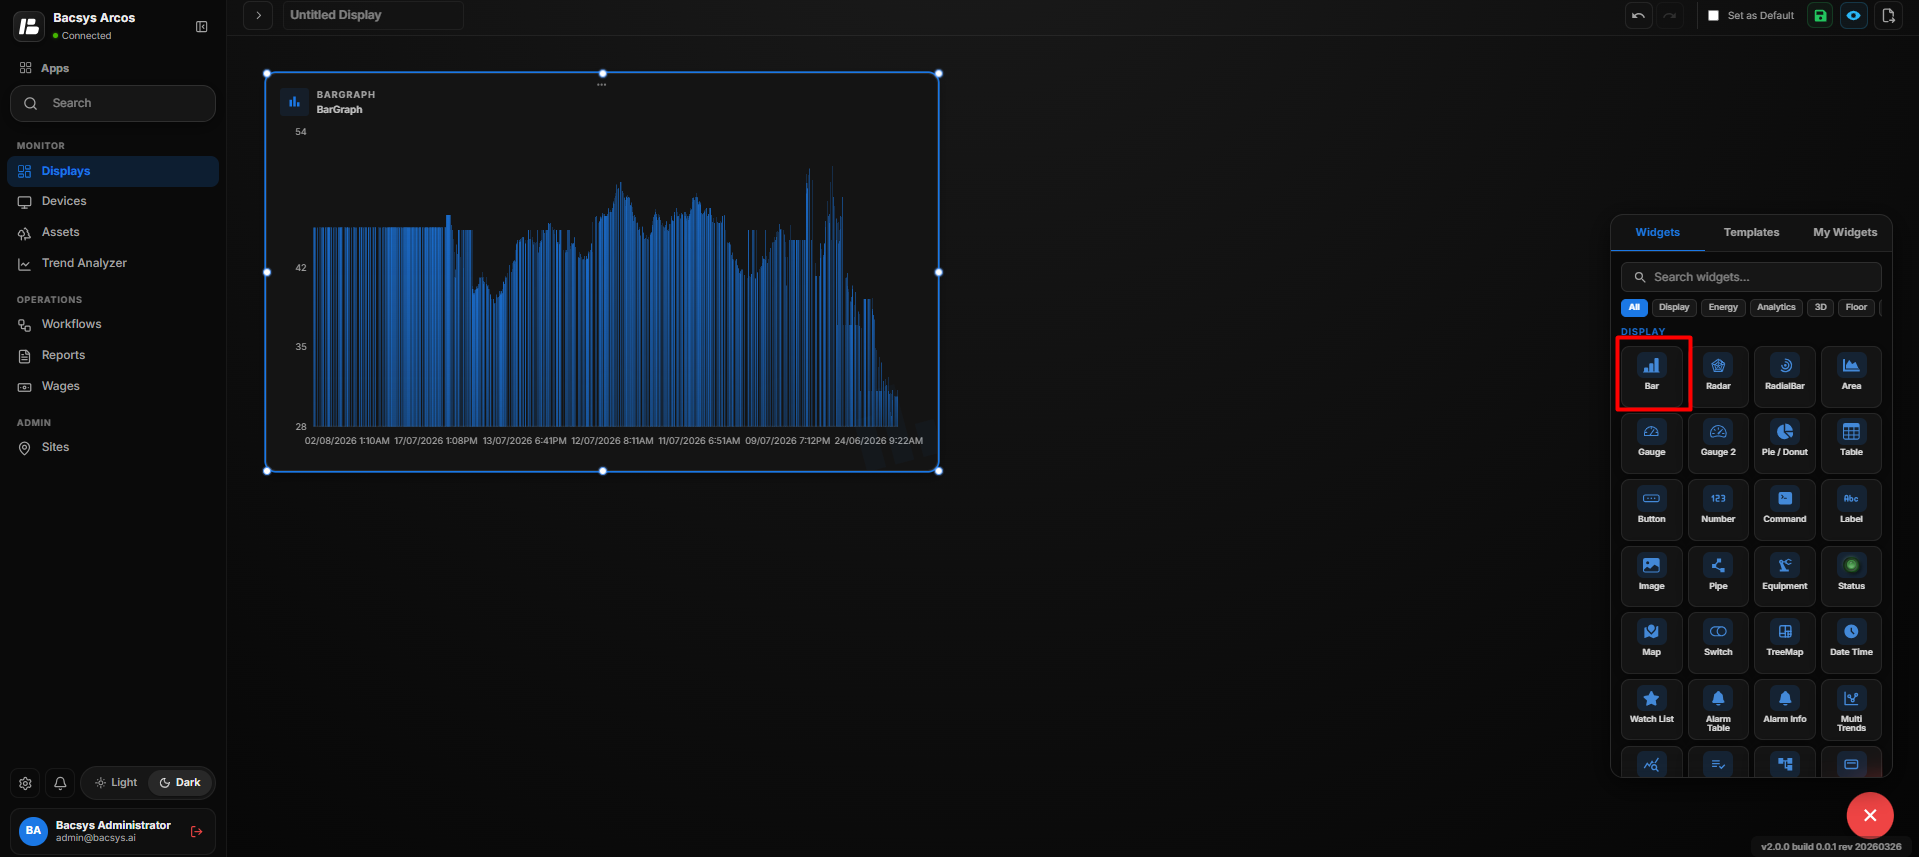
Drag and drop the Bar Widget onto the display.
-
Select the Bar Widget to view the available widget actions:
- Zoom In
- Zoom Out
- Settings
- Remove Widget
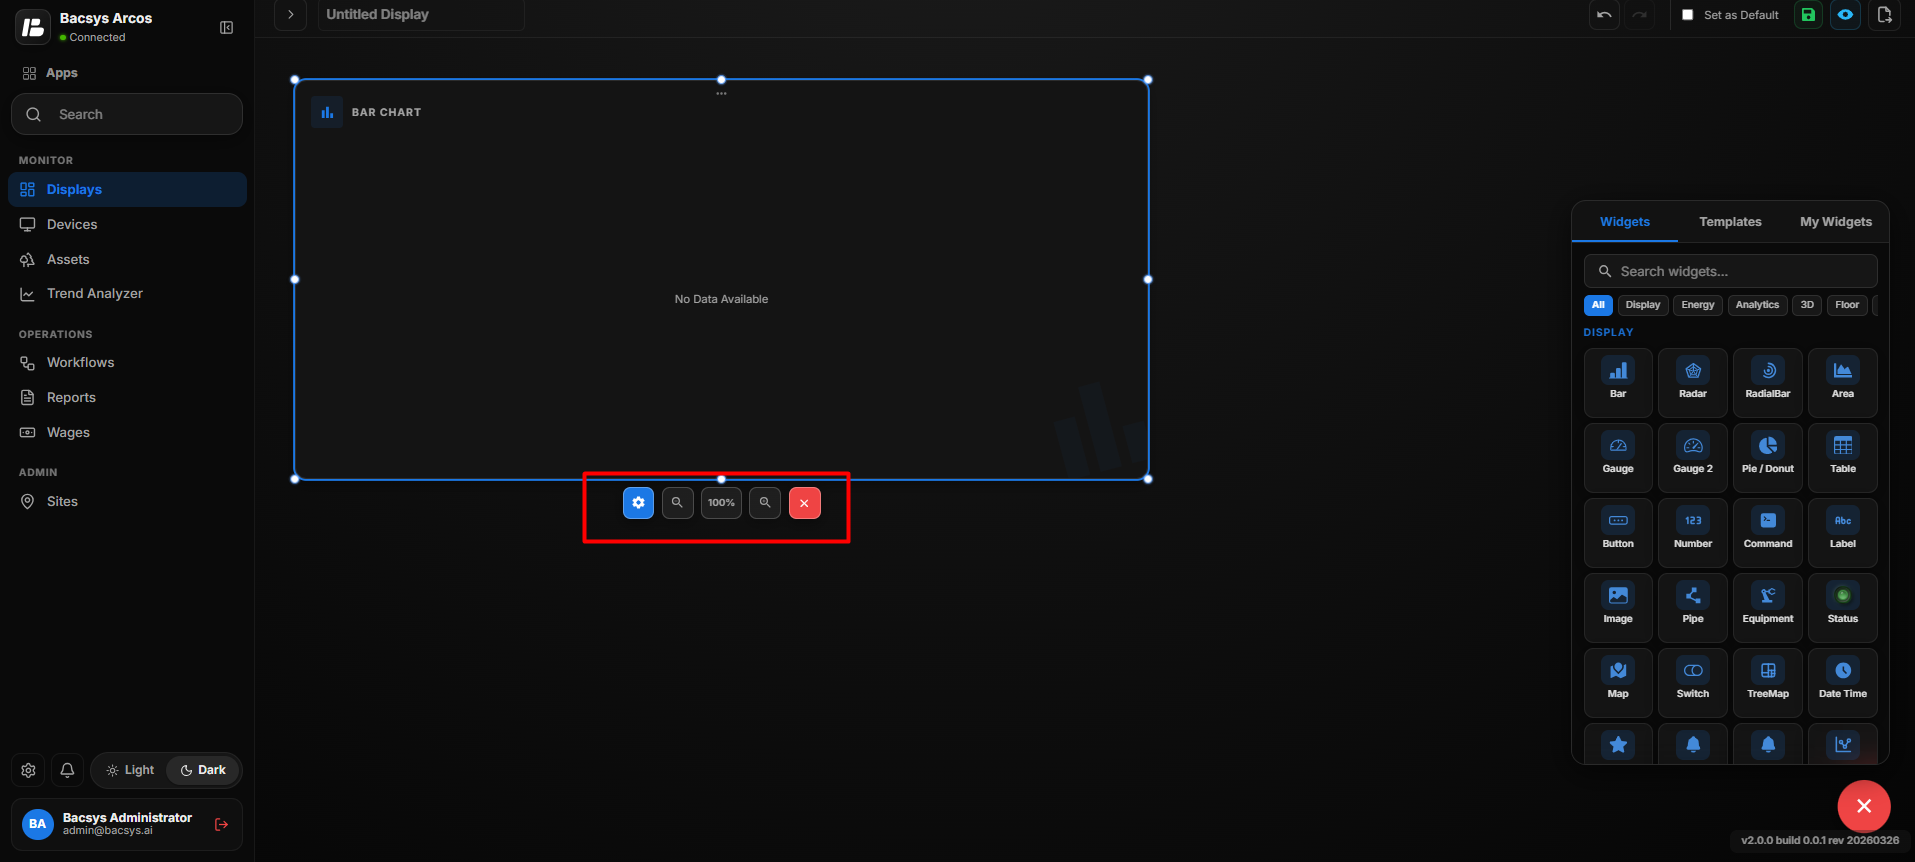
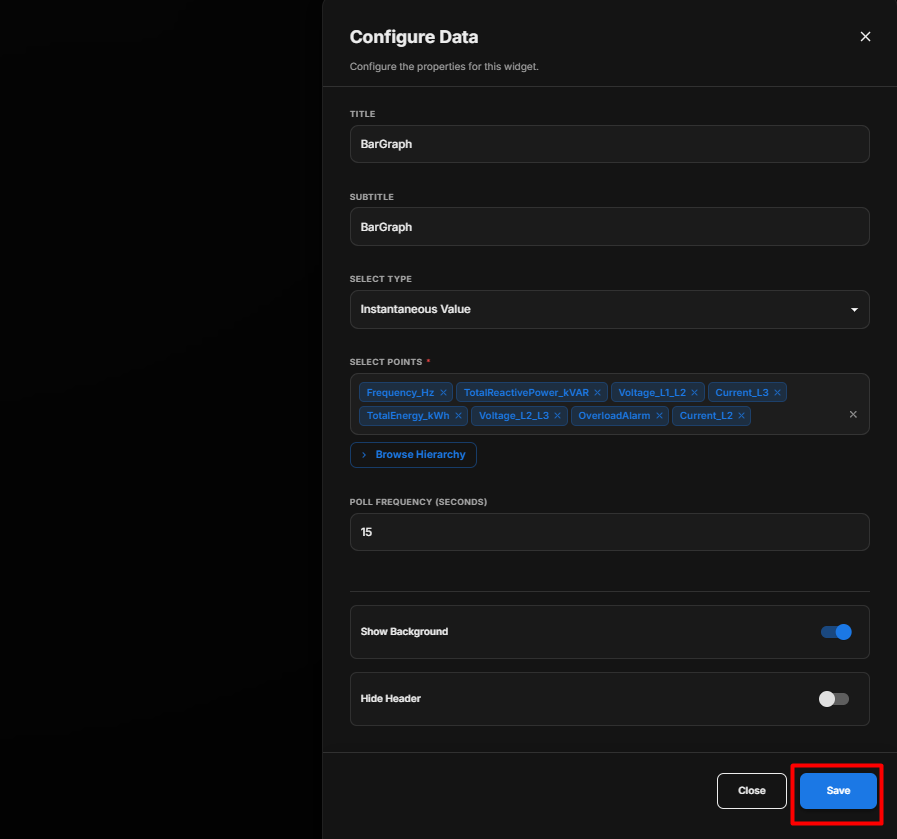
- Click Settings to open the Bar Widget configuration panel.
- Under Select Type, select Instantaneous.
- Configure the available options as described below.
Instantaneous Settings
| Option | Description |
|---|---|
| Title | Enter a title for the Bar Widget. The title is displayed at the top of the widget. |
| Subtitle | Enter a subtitle to provide additional information about the widget. |
| Select Points | Select the required points that should be displayed in the Bar Widget. |
| Poll Frequency | Set how frequently the widget retrieves or refreshes the point values. |
| Show Background | Use the toggle button to show or hide the widget background. |
| Hide Header | Use the toggle button to show or hide the widget header, including the title and subtitle. |
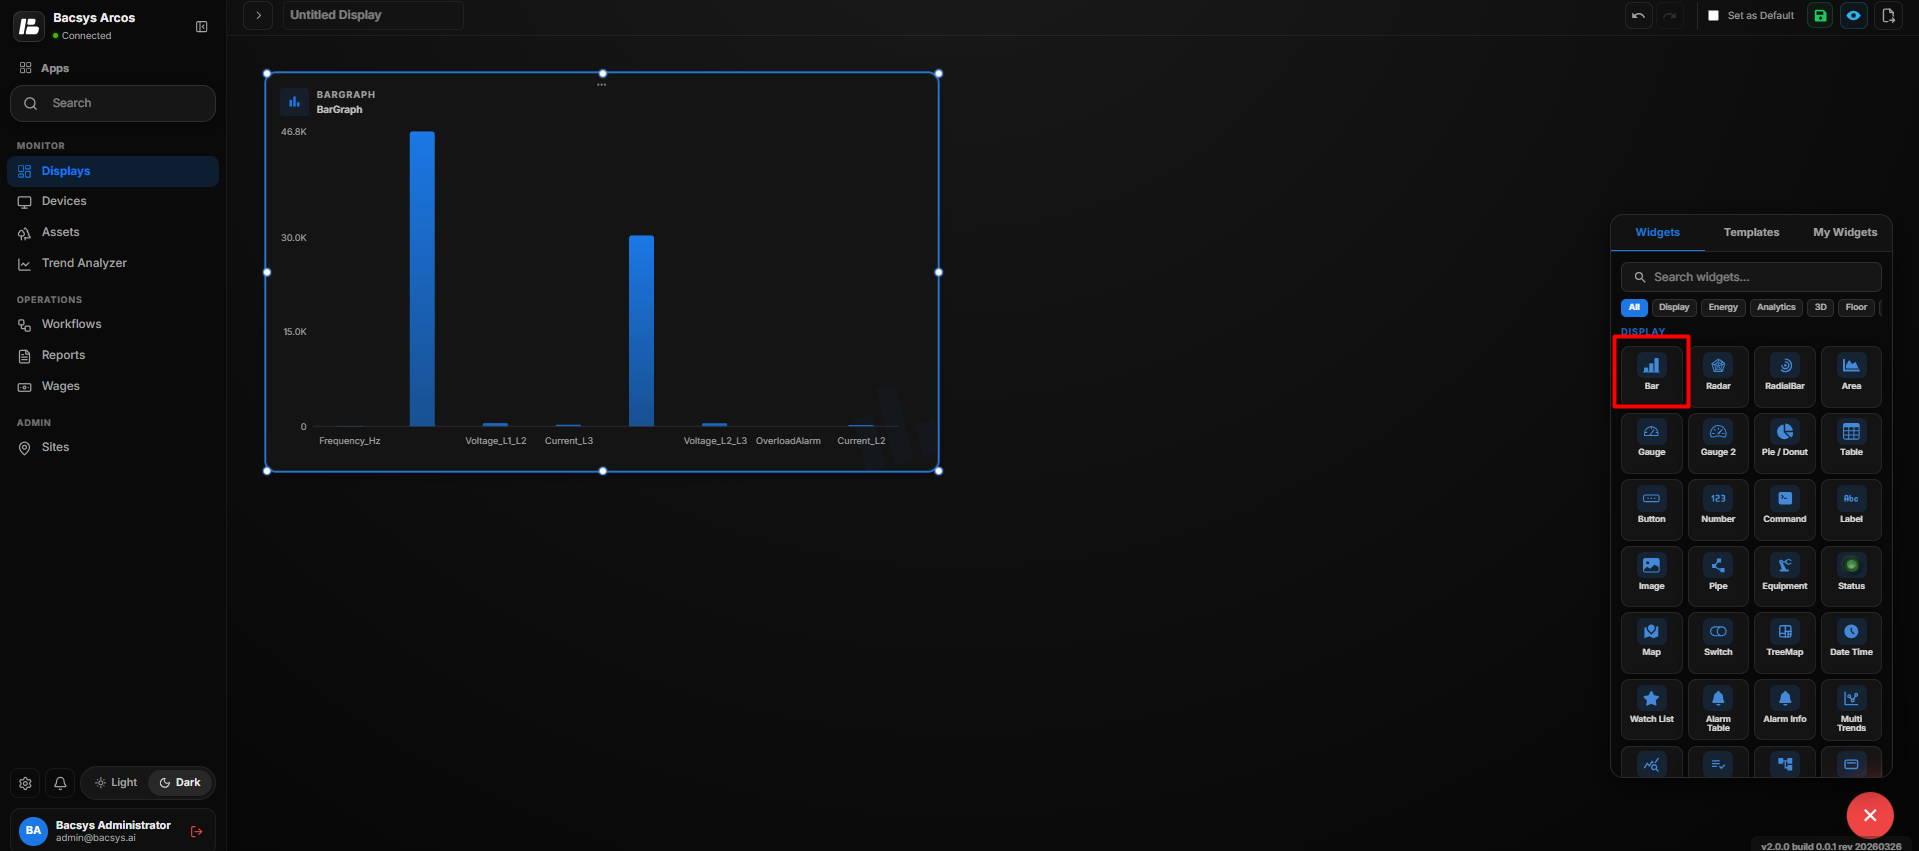
Save the Configuration
After configuring the required settings:
- Review the selected points and configuration options.
- Click Save.
- The Bar Widget is updated with the configured settings.
Configure the Bar Widget for Trends
The Trends view of the Bar Widget is used to visualize the historical values of selected points over a specific time period. Before configuring the widget, make sure that Trend is enabled for every point you want to display.
Configure the Trends View
- Select the Bar Widget.
- Click Settings to open the widget configuration panel.
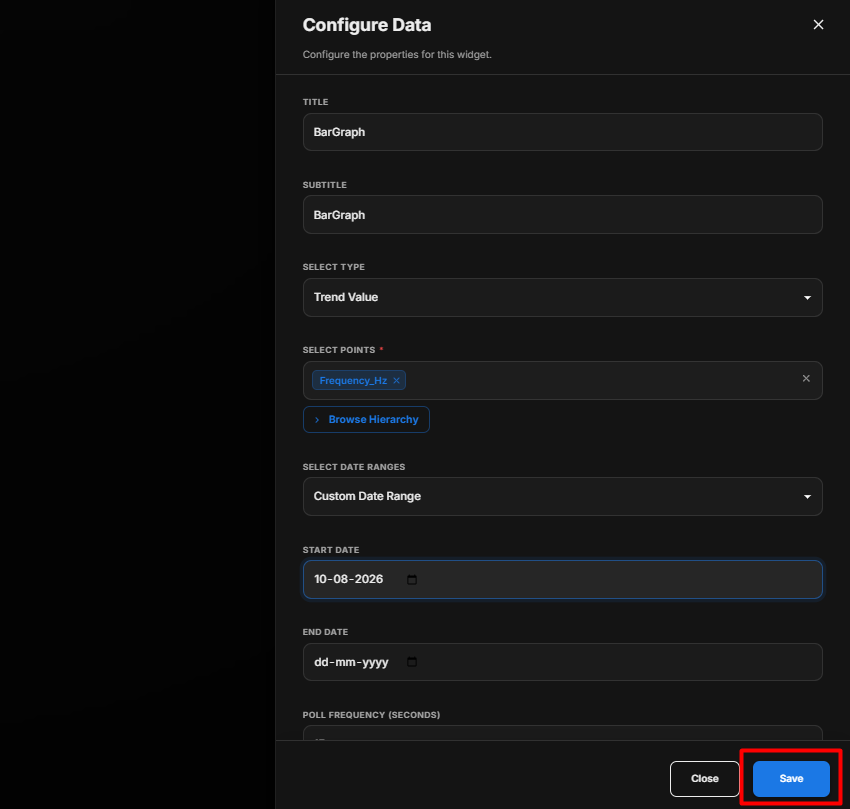
- Under Select Type, select Trends.
- Make sure Trend is enabled for every point that you want to display in the Trends view.
- Configure the available options as described below.
Trends Settings
| Option | Description |
|---|---|
| Title | Enter a title for the Bar Widget. The title identifies the trend data displayed in the widget. |
| Subtitle | Enter a subtitle to provide additional information or context about the trend data. |
| Select Points | Select the required points to display their historical values in the Trends view. |
| Enable Trends | Make sure the Trend option is enabled for every selected point. Trend data is displayed only for points with trends enabled. |
| Value | Make sure the Value option is enabled to display the point values in the Trends view. |
| Select Date Range | Select the time period for which you want to view the trend data. The available options are 1 Day, 2 Days, and Custom Date. |
| 1 Day | Displays trend data for the previous 1 day. |
| 2 Days | Displays trend data for the previous 2 days. |
| Custom Date | Allows you to specify a custom date range using a Start Date and End Date. |
| Start Date | Select the beginning date for the custom trend period. This option is available when Custom Date is selected. |
| End Date | Select the ending date for the custom trend period. This option is available when Custom Date is selected. |
| Show Background | Use the toggle button to show or hide the background of the Bar Widget. |
| Hide Header | Use the toggle button to show or hide the widget header, including the title and subtitle. |
Select a Date Range
Under Select Date Range, choose one of the following options:
- 1 Day – Displays trend data for one day.
- 2 Days – Displays trend data for two days.
- Custom Date – Allows you to select a specific date range.
When Custom Date is selected:
- Select the Start Date.
- Select the End Date.
- Make sure the selected date range is valid.
Save the Configuration
After configuring the Trends view:
- Verify that Trend is enabled for every required point.
- Make sure Value is enabled.
- Review the selected Date Range.
- If Custom Date is selected, verify the Start Date and End Date.
- Review the Show Background and Hide Header settings.
- Click Save.
- The Bar Widget displays the trend data for the selected points and configured date range.
Add and Configure the Radar Widget
The Radar Widget is used to display selected point values in a radar-style visualization. It helps users compare multiple point values within a single widget.
Add the Radar Widget
- Click the + icon.
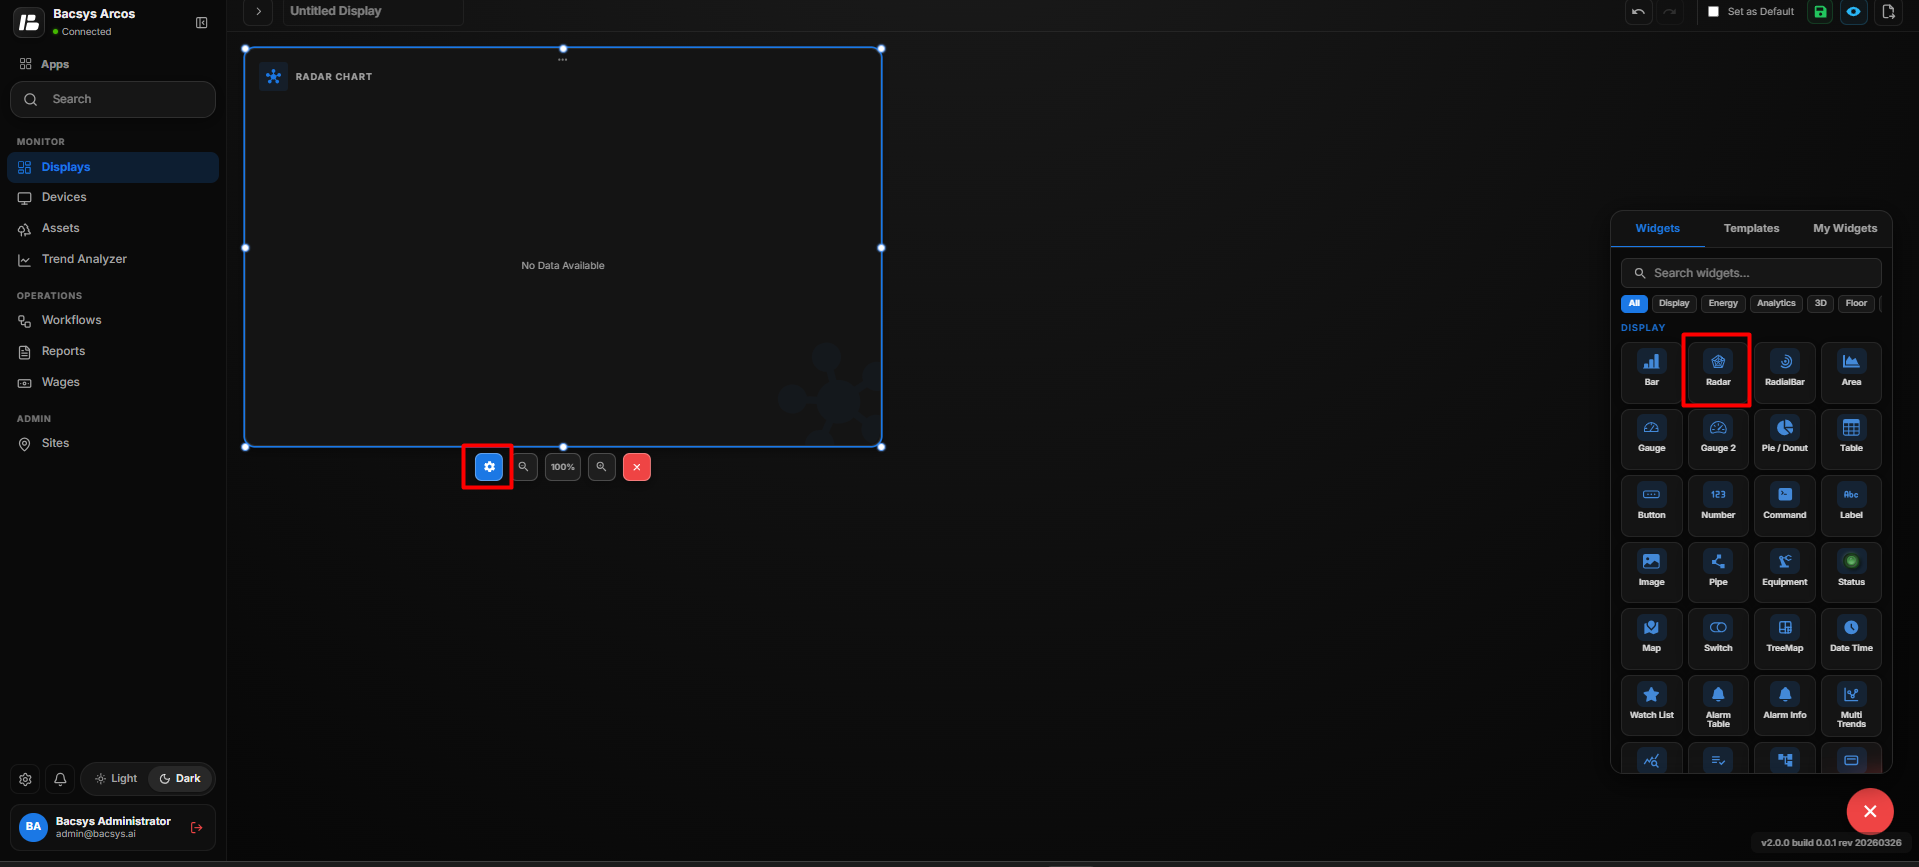
- Drag and drop the Radar Widget onto the display.
- Select the Radar Widget to view the available widget actions:
- Zoom In – Enlarges the widget.
- Zoom Out – Reduces the widget size.
- Settings – Opens the widget configuration options.
- Remove Widget – Removes the widget from the display.
Configure the Radar Widget
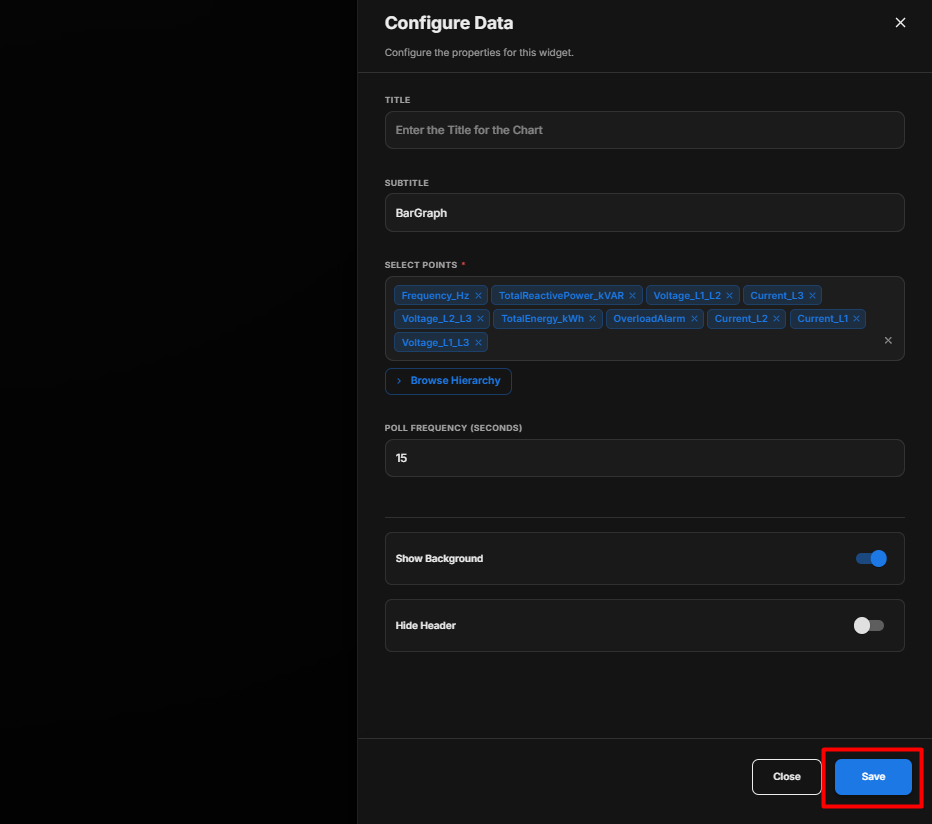
- Click Settings to open the Radar Widget configuration panel.
- Configure the available options as described below.
Radar Widget Settings
| Option | Description |
|---|---|
| Title | Enter a title for the Radar Widget. The title identifies the information displayed in the widget. |
| Subtitle | Enter a subtitle to provide additional information or context about the displayed values. |
| Select Points | Select the required points that you want to display in the Radar Widget. |
| Poll Frequency | Set how frequently the widget retrieves or refreshes the values of the selected points. |
| Show Background | Use the toggle button to show or hide the background of the Radar Widget. |
| Hide Header | Use the toggle button to show or hide the widget header, including the title and subtitle. |
Save the Configuration
After configuring the Radar Widget:
- Enter the required Title and Subtitle.
- Select the required Points.
- Set the required Poll Frequency.
- Configure the Show Background and Hide Header toggle buttons as required.
- Review the configuration.
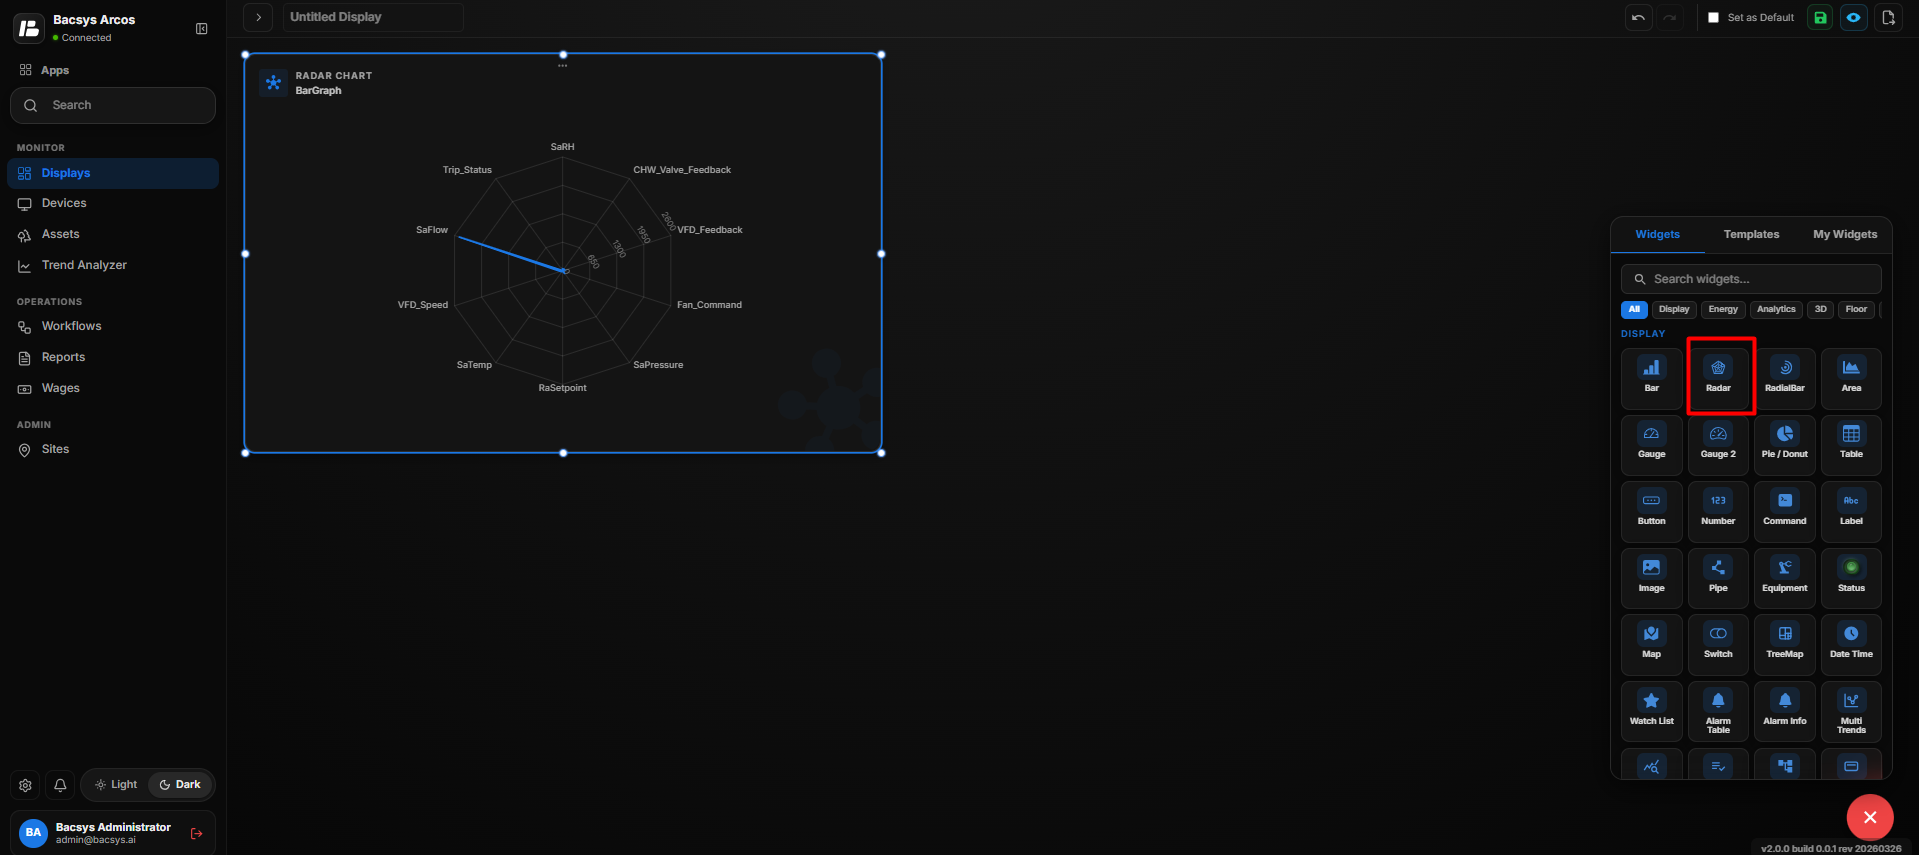
- Click Save.
- The Radar Widget is updated with the configured settings and selected point values.
Add and Configure the Radial Bar Widget
The Radial Bar Widget is used to display selected point values in a radial bar visualization. It allows users to configure the displayed points, refresh frequency, and widget appearance.
Add the Radial Bar Widget
- Click the + icon.
- Drag and drop the Radial Bar Widget onto the display.
- Select the Radial Bar Widget to view the available widget actions:
- Zoom In
- Zoom Out
- Settings
- Remove Widget
- Click Settings to open the Configure Data panel.
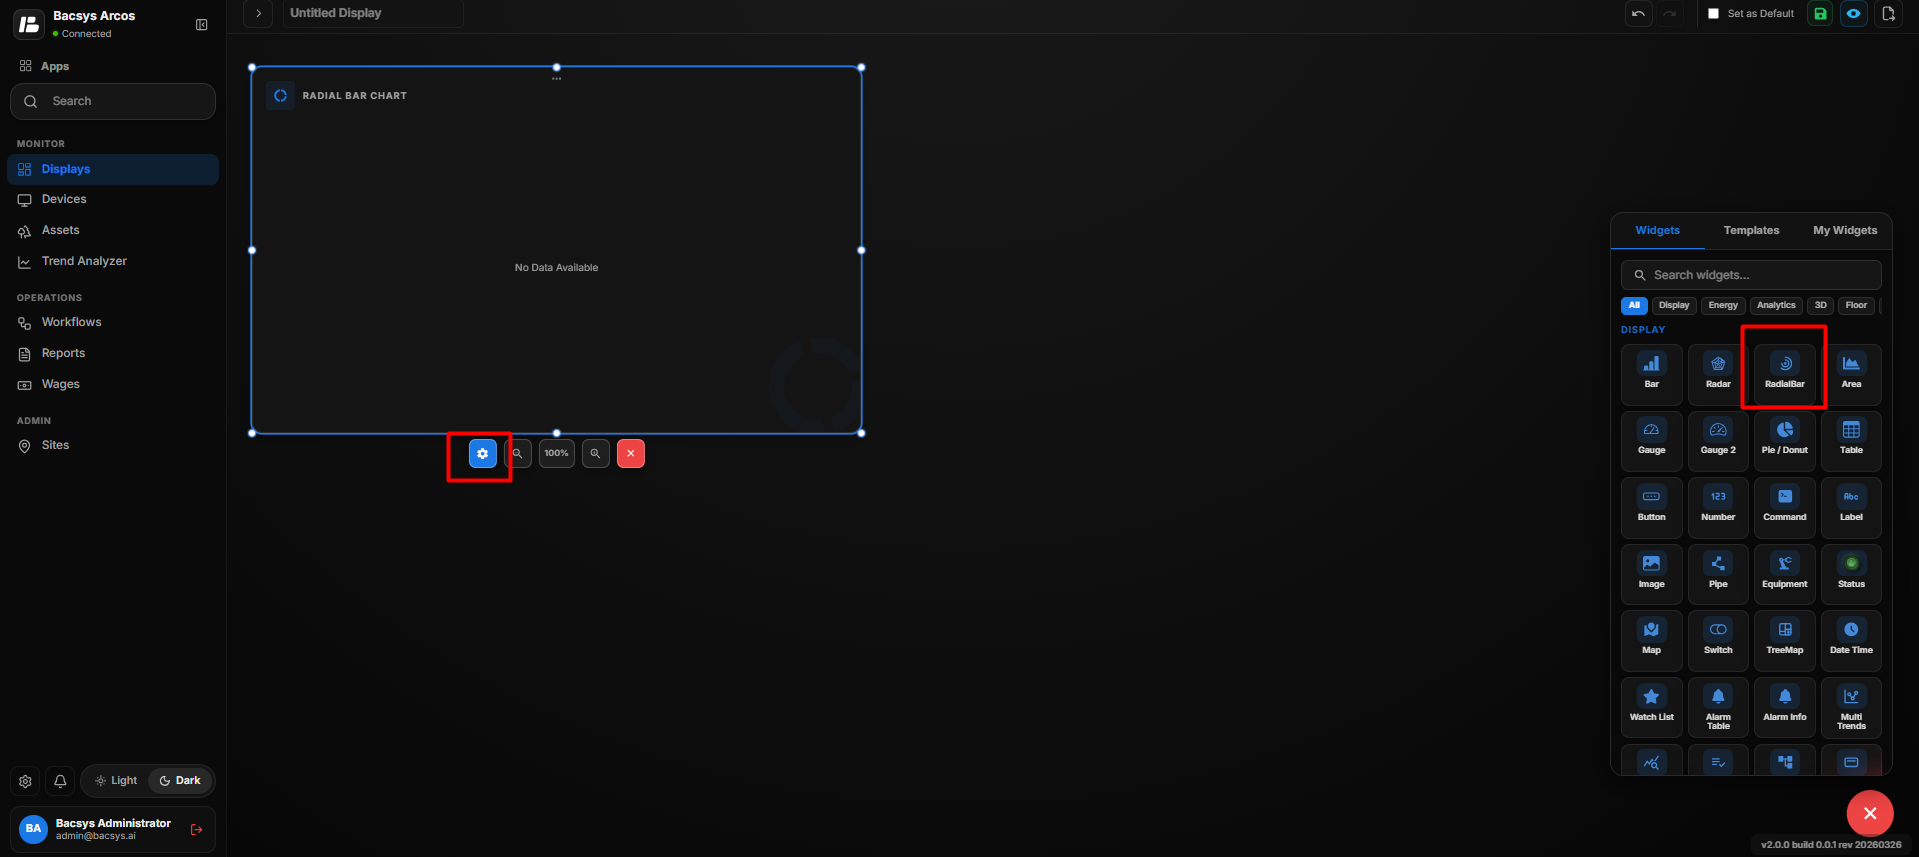
Radial Bar Widget Settings
| Option | Description |
|---|---|
| Title | Enter a title for the Radial Bar Widget. |
| Subtitle | Enter a subtitle to provide additional information about the widget. |
| Select Points | Select up to 10 points from the hierarchy to display in the widget. Click Browse Hierarchy to select the required points. |
| Poll Frequency (Seconds) | Specify how frequently the widget retrieves or refreshes the selected point values. |
| Show Background | Use the toggle button to show or hide the widget background. |
| Hide Header | Use the toggle button to show or hide the widget header, including the title and subtitle. |
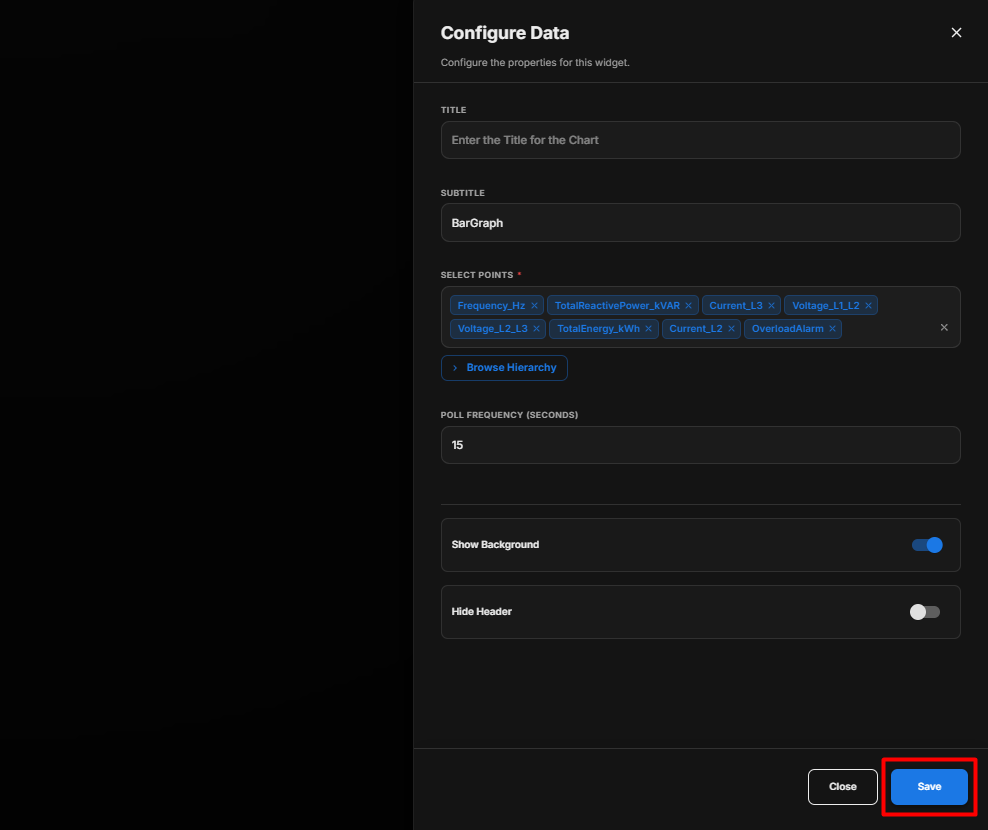
Configure the Radial Bar Widget
- Enter the required Title.
- Enter the Subtitle.
- Under Select Points, click Browse Hierarchy.
- Select the required points from the hierarchy.
- You can select up to 10 points.
- Enter the required Poll Frequency (Seconds).
- Configure the Show Background toggle as required.
- Configure the Hide Header toggle as required.
- Review all the configured settings.
- Click Save to apply the configuration.
Save the Configuration
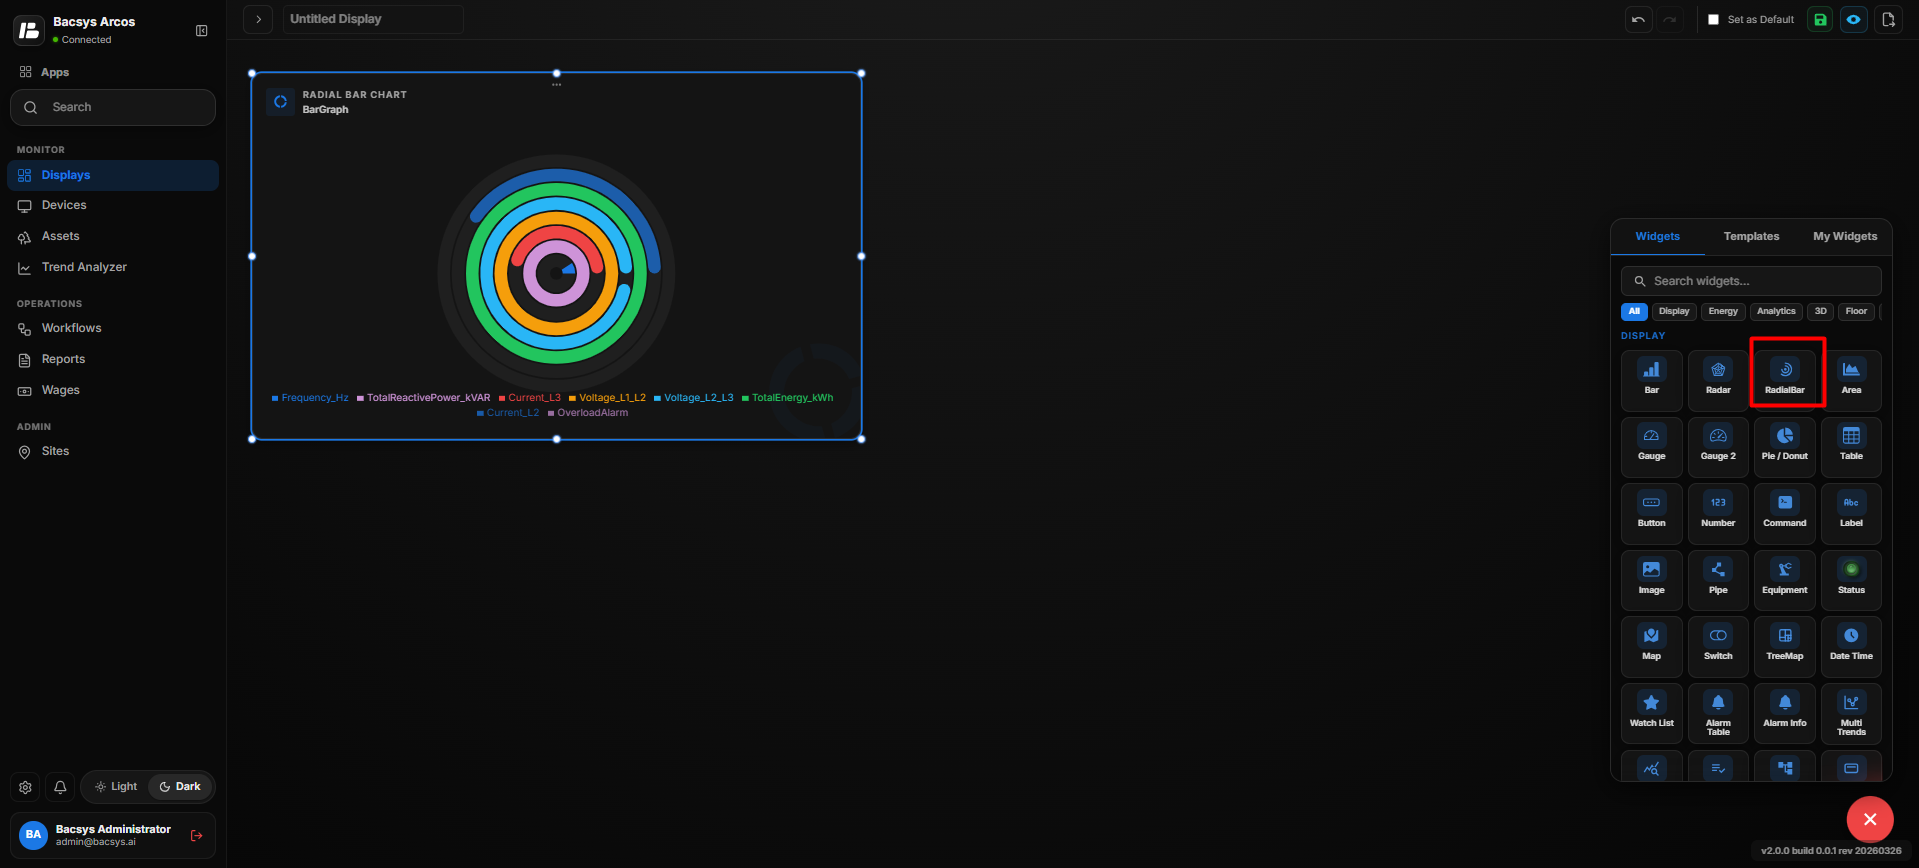
After clicking Save, the Radial Bar Widget is added to the display with the selected points and configured settings.
Add and Configure the Area Chart Widget
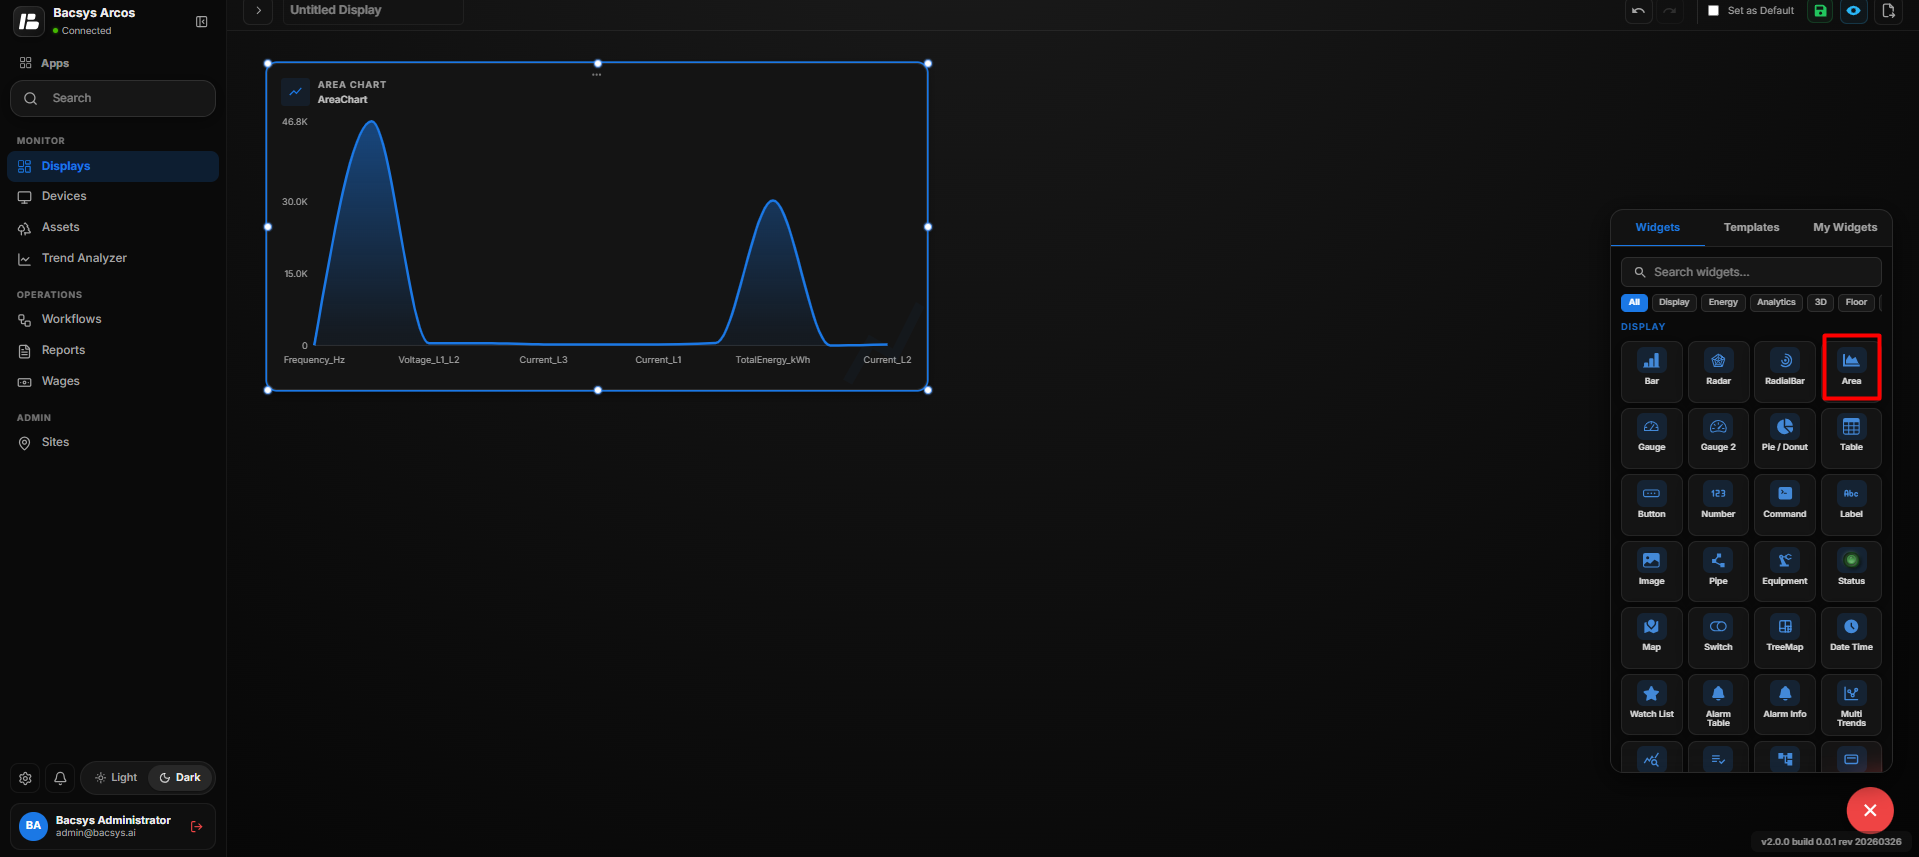
The Area Chart Widget is used to display point values as an area chart. It helps users visualize point data and monitor changes over time or based on the selected data type.
Add the Area Chart Widget
- Click the + icon.
- Drag and drop the Area Chart Widget onto the display.
- Select the Area Chart Widget to view the available widget actions:
- Zoom In
- Zoom Out
- Settings
- Remove Widget
- Click Settings to open the Configure Data panel.
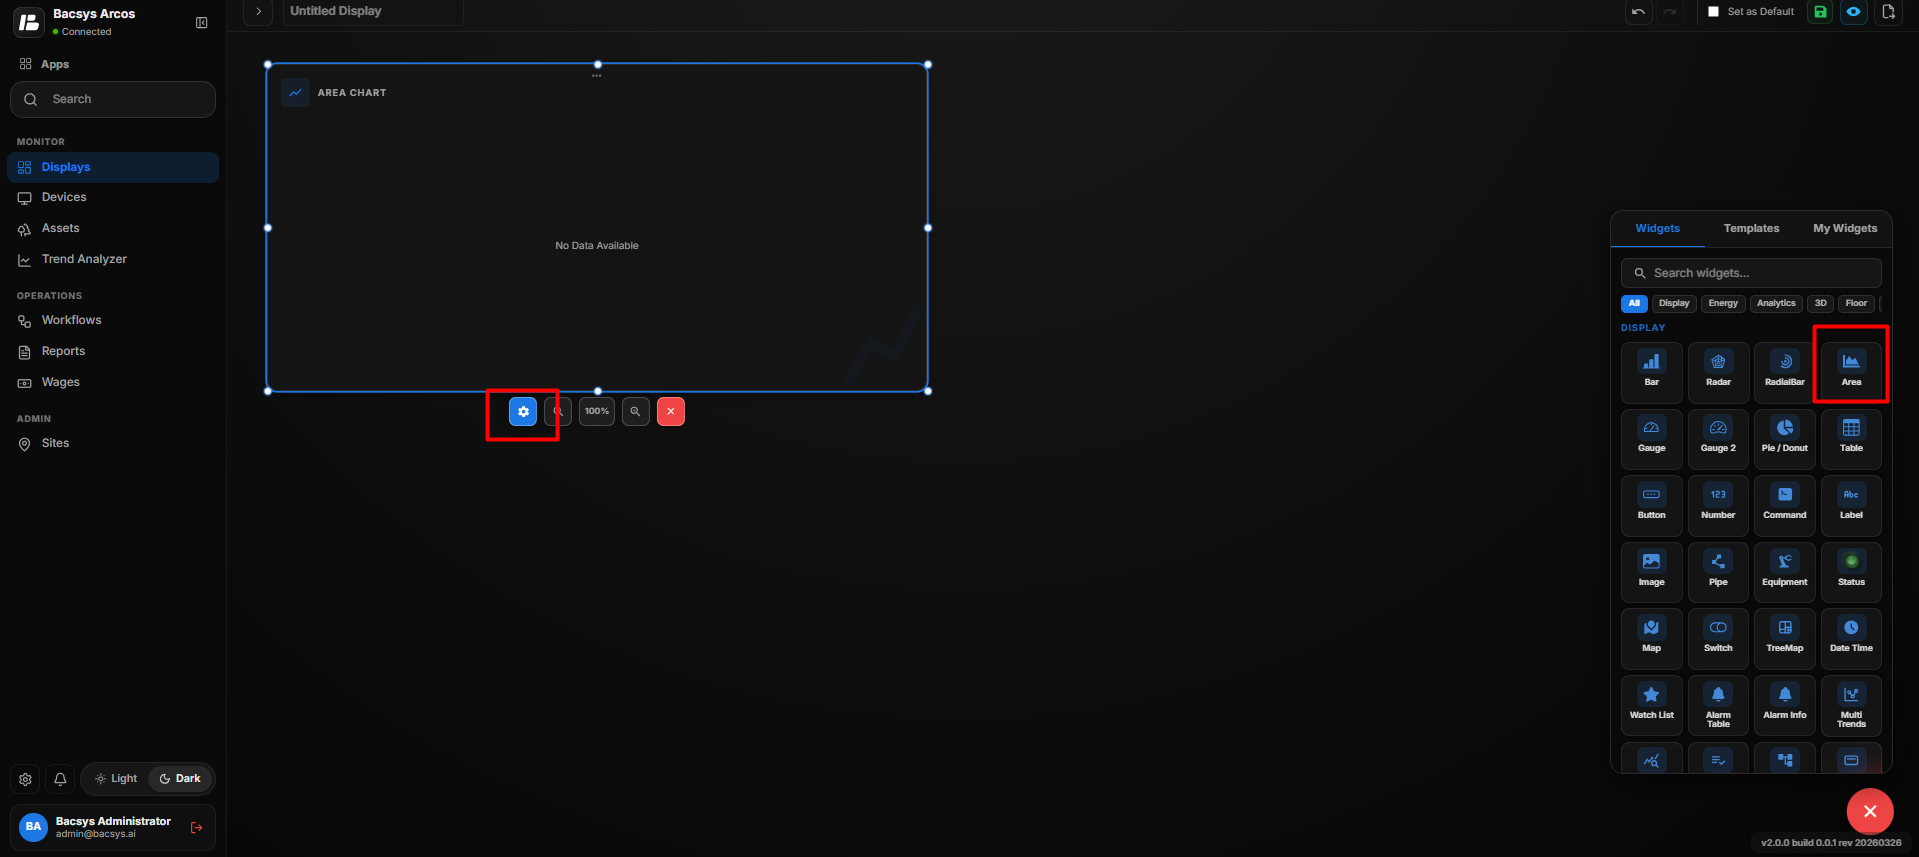
Area Chart Settings
| Option | Description |
|---|---|
| Title | Enter a title for the Area Chart Widget. The title identifies the information displayed in the chart. |
| Subtitle | Enter a subtitle to provide additional information or context about the chart. |
| Select Type | Select the type of data to display. The available option shown is Instantaneous Value. |
| Select Points | Select the required points to display in the Area Chart. Click Browse Hierarchy to browse through Network → Device → Point and select the required points. |
| Poll Frequency (Seconds) | Specify how frequently the widget retrieves or refreshes the selected point values. |
| Show Background | Use the toggle button to show or hide the chart background. |
| Hide Header | Use the toggle button to show or hide the widget header, including the title and subtitle. |
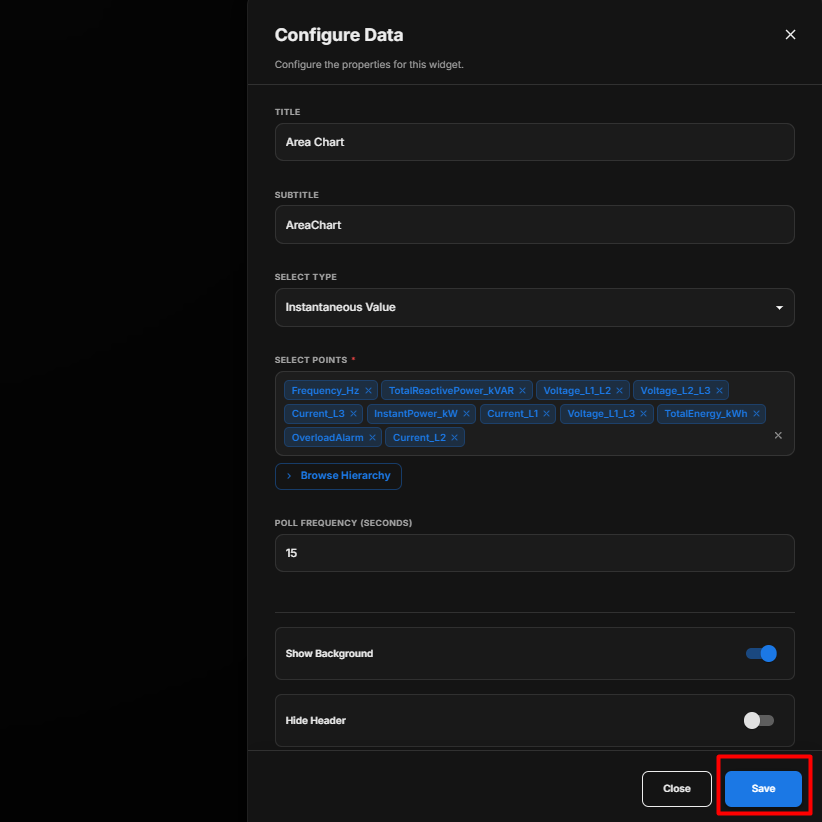
Configure the Area Chart
- Enter the required Title.
- Enter the Subtitle.
- Under Select Type, select Instantaneous Value.
- Under Select Points, click Browse Hierarchy.
- Navigate through Network → Device → Point.
- Select the required points.
- Set the required Poll Frequency (Seconds).
- Configure the Show Background toggle according to your requirement.
- Configure the Hide Header toggle according to your requirement.
- Review all the configured settings.
- Click Save.
Save the Configuration
After clicking Save, the Area Chart Widget is updated on the display with the selected points and configured settings.
Add and Configure the Area Chart Widget for Trends
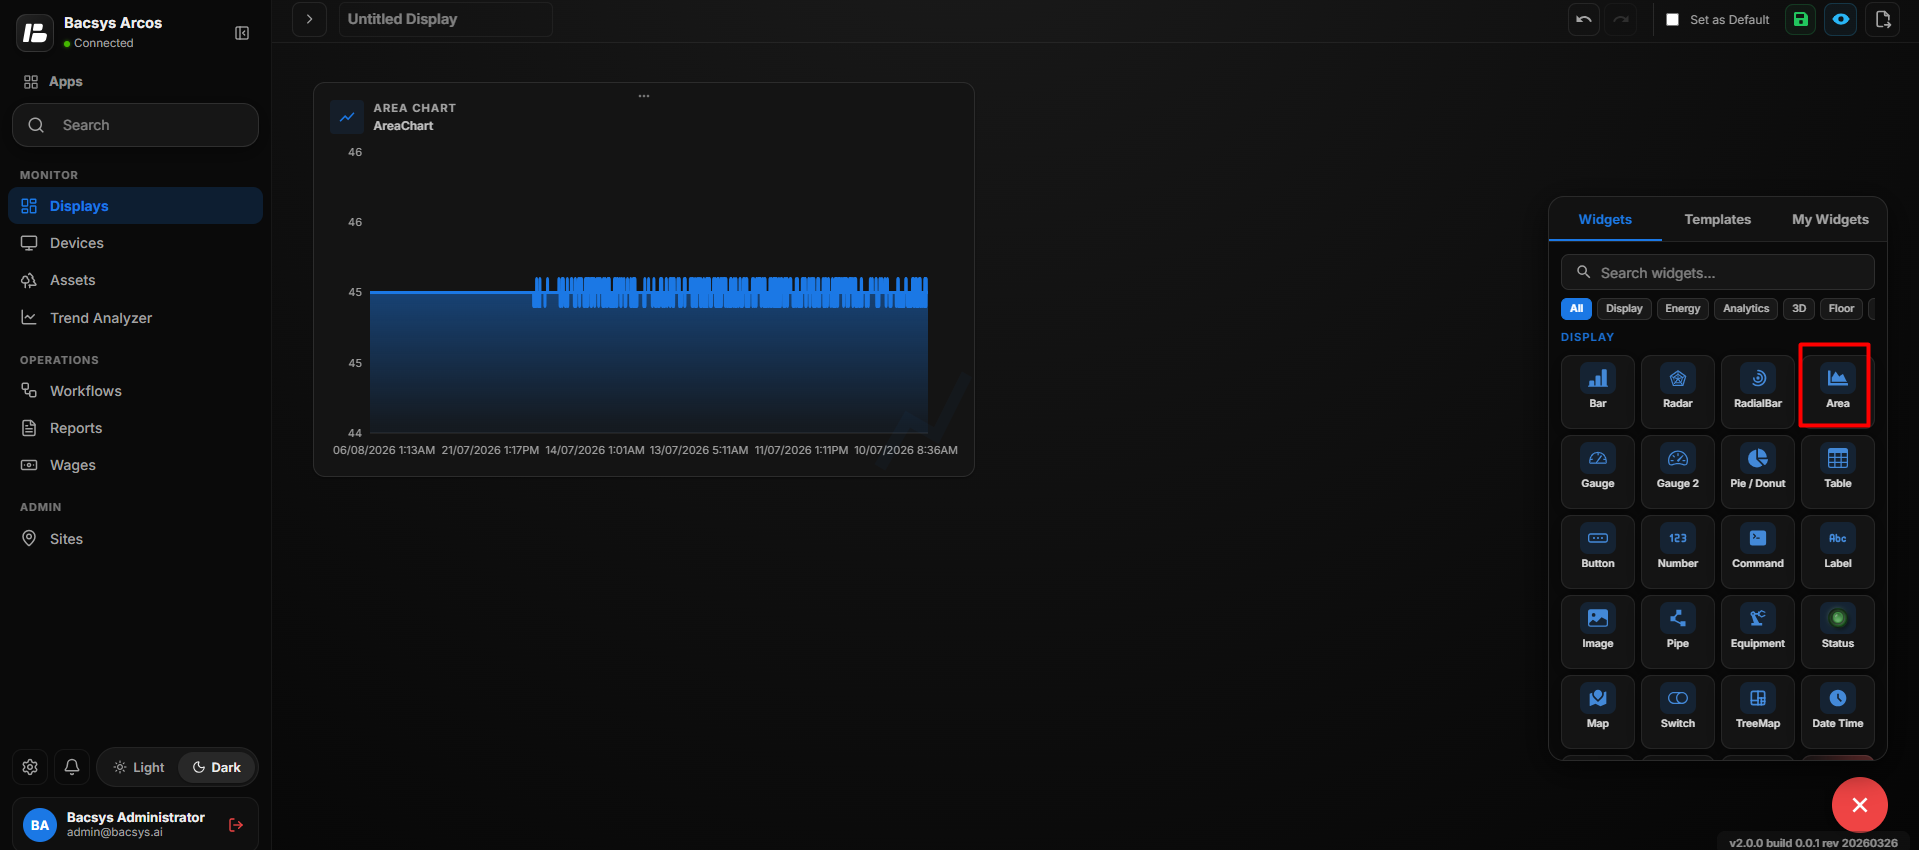
The Area Chart Widget – Trends is used to visualize historical trend data for selected points over a specific date range. It helps users analyze how point values change over time.
Add the Area Chart Widget
- Click the + icon.
- Drag and drop the Area Chart Widget onto the display.
- Select the Area Chart Widget to view the available widget actions:
- Zoom In
- Zoom Out
- Settings
- Remove Widget
- Click Settings to open the Configure Data panel.
- Under Select Type, select Trend Value.
Trends Settings
| Option | Description |
|---|---|
| Title | Enter a title for the Area Chart. The title identifies the trend information displayed in the chart. |
| Subtitle | Enter a subtitle to provide additional information or context about the trend data. |
| Select Type | Select Trend Value to display historical trend data. |
| Select Points | Select the required trend points from the hierarchy. Click Browse Hierarchy to find and select the required points. |
| Select Date Ranges | Select the date range for which the trend data should be displayed. |
| Poll Frequency (Seconds) | Specify how frequently the widget retrieves or refreshes the selected trend data. |
| Show Background | Use the toggle button to show or hide the chart background. |
| Hide Header | Use the toggle button to show or hide the widget header, including the title and subtitle. |
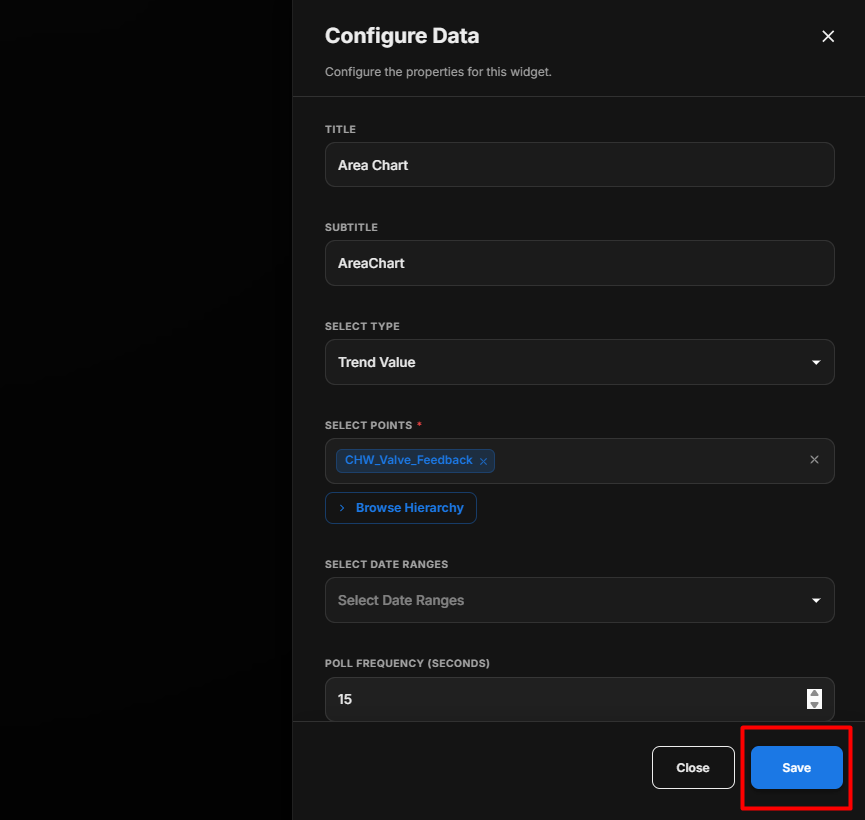
Configure the Trends View
- Enter the required Title.
- Enter the Subtitle.
- Under Select Type, select Trend Value.
- Under Select Points, click Browse Hierarchy.
- Select the required Trend Point(s) from the hierarchy.
- Under Select Date Ranges, select the required date range.
- Set the required Poll Frequency (Seconds).
- Configure the Show Background toggle according to your requirement.
- Configure the Hide Header toggle according to your requirement.
- Review all the configured settings.
- Click Save.
Save the Configuration
After clicking Save, the Area Chart Widget is updated on the display and shows the selected points' trend values for the configured date range.
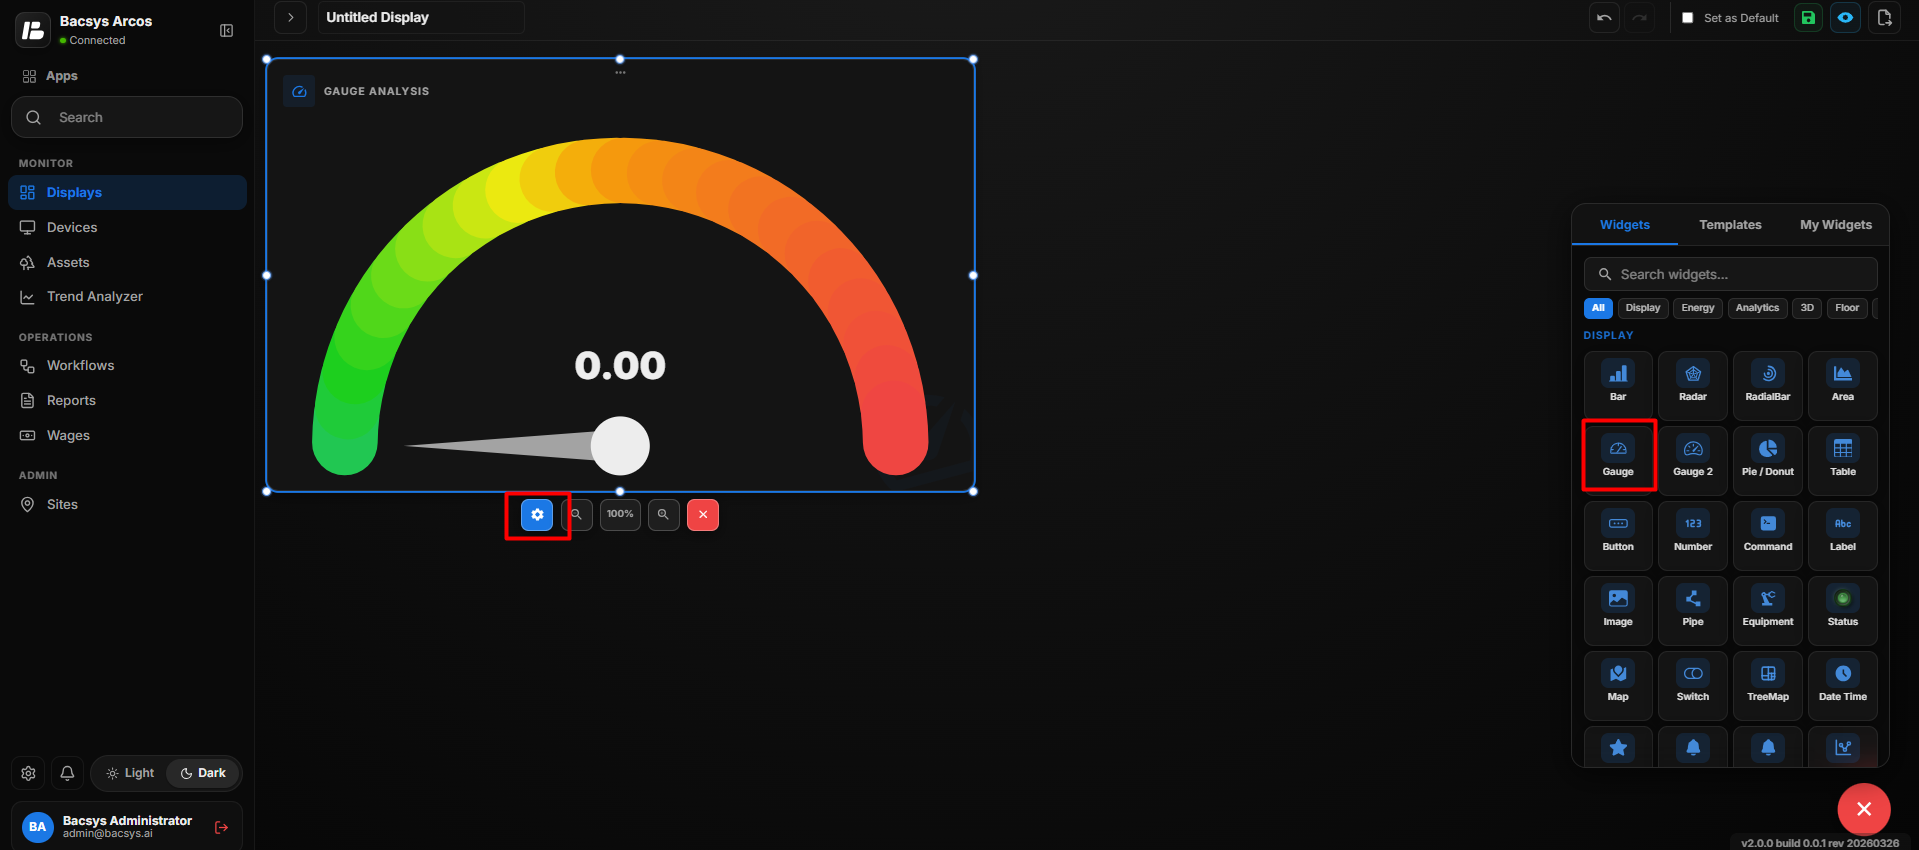
Add and Configure the Gauge Chart Widget
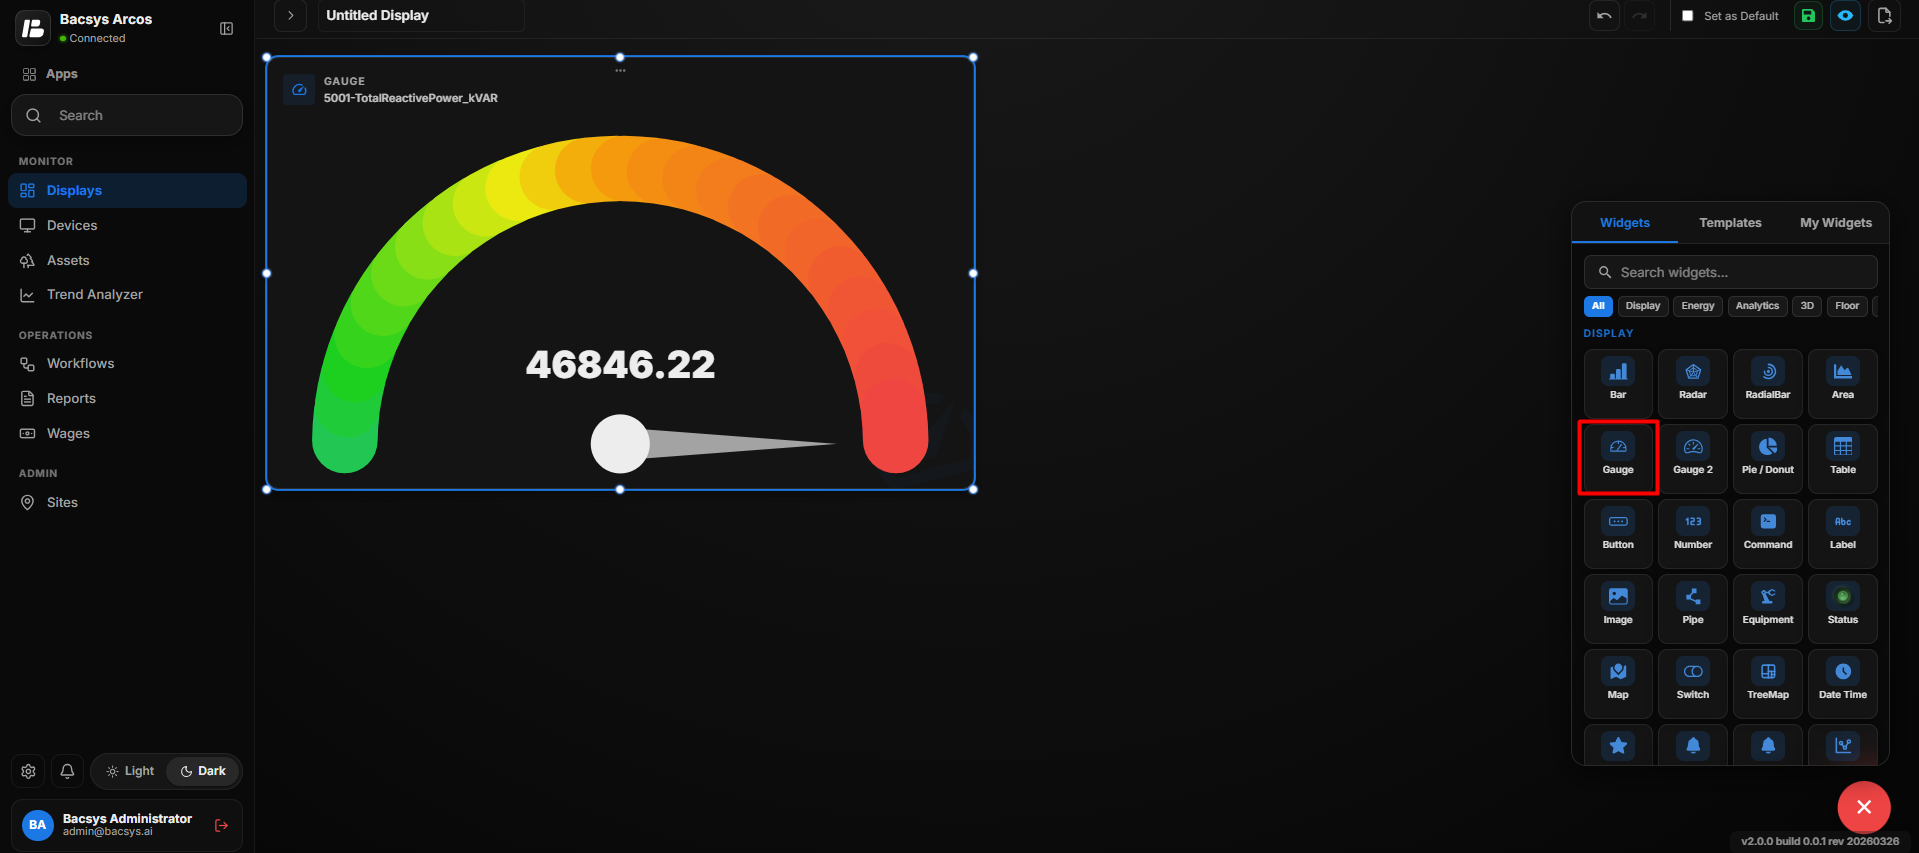
The Gauge Chart Widget is used to display the current value of a selected point in a gauge-style visualization. It provides a simple way to monitor a point value directly from the display.
Add the Gauge Chart Widget
- Click the + icon.
- Drag and drop the Gauge Chart Widget onto the display.
- Select the Gauge Chart Widget to view the available widget actions:
- Zoom In
- Zoom Out
- Settings
- Remove Widget
- Click Settings to open the Configure Data panel.
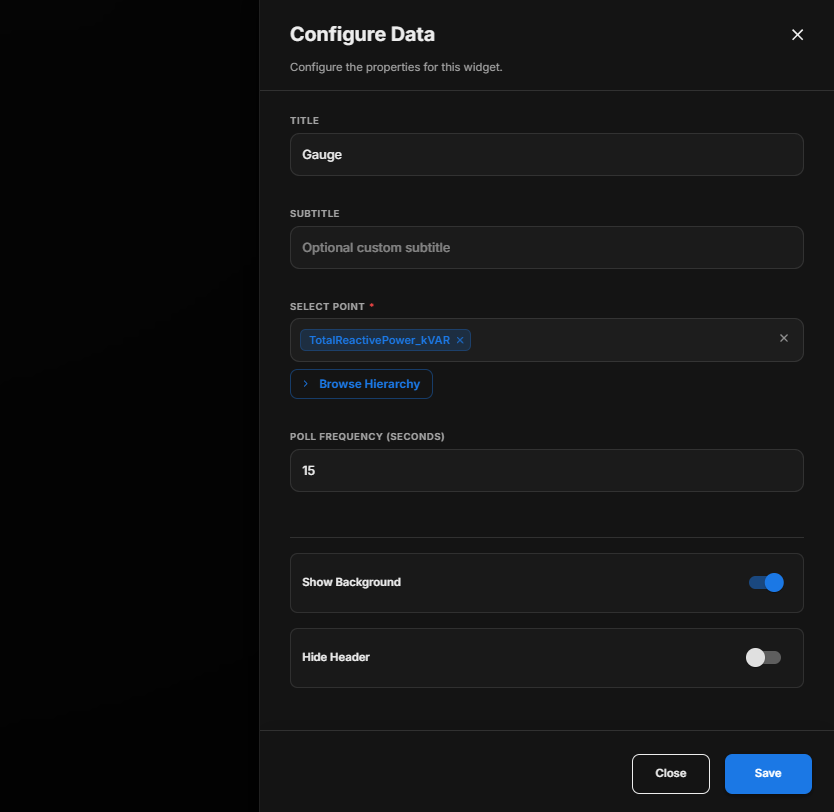
Gauge Chart Settings
| Option | Description |
|---|---|
| Title | Enter a title for the Gauge Chart. The title identifies the information displayed by the gauge. |
| Subtitle | Enter an optional subtitle to provide additional information or context about the displayed value. |
| Select Point | Select the point whose value should be displayed in the Gauge Chart. Click Browse Hierarchy to browse through Network → Device → Point and select the required point. |
| Poll Frequency (Seconds) | Specify how frequently the Gauge Chart retrieves or refreshes the selected point value. |
| Show Background | Use the toggle button to show or hide the widget background. |
| Hide Header | Use the toggle button to show or hide the widget header, including the title and subtitle. |
Configure the Gauge Chart
- Enter the required Title.
- Enter an optional Subtitle.
- Under Select Point, click Browse Hierarchy.
- Navigate through Network → Device → Point.
- Select the required point.
- Enter the required Poll Frequency (Seconds).
- Configure the Show Background toggle according to your requirement.
- Configure the Hide Header toggle according to your requirement.
- Review all the configured settings.
- Click Save.
Save the Configuration
After clicking Save, the Gauge Chart Widget is updated on the display and displays the selected point value according to the configured settings.
Add and Configure the Gauge 2 Widget
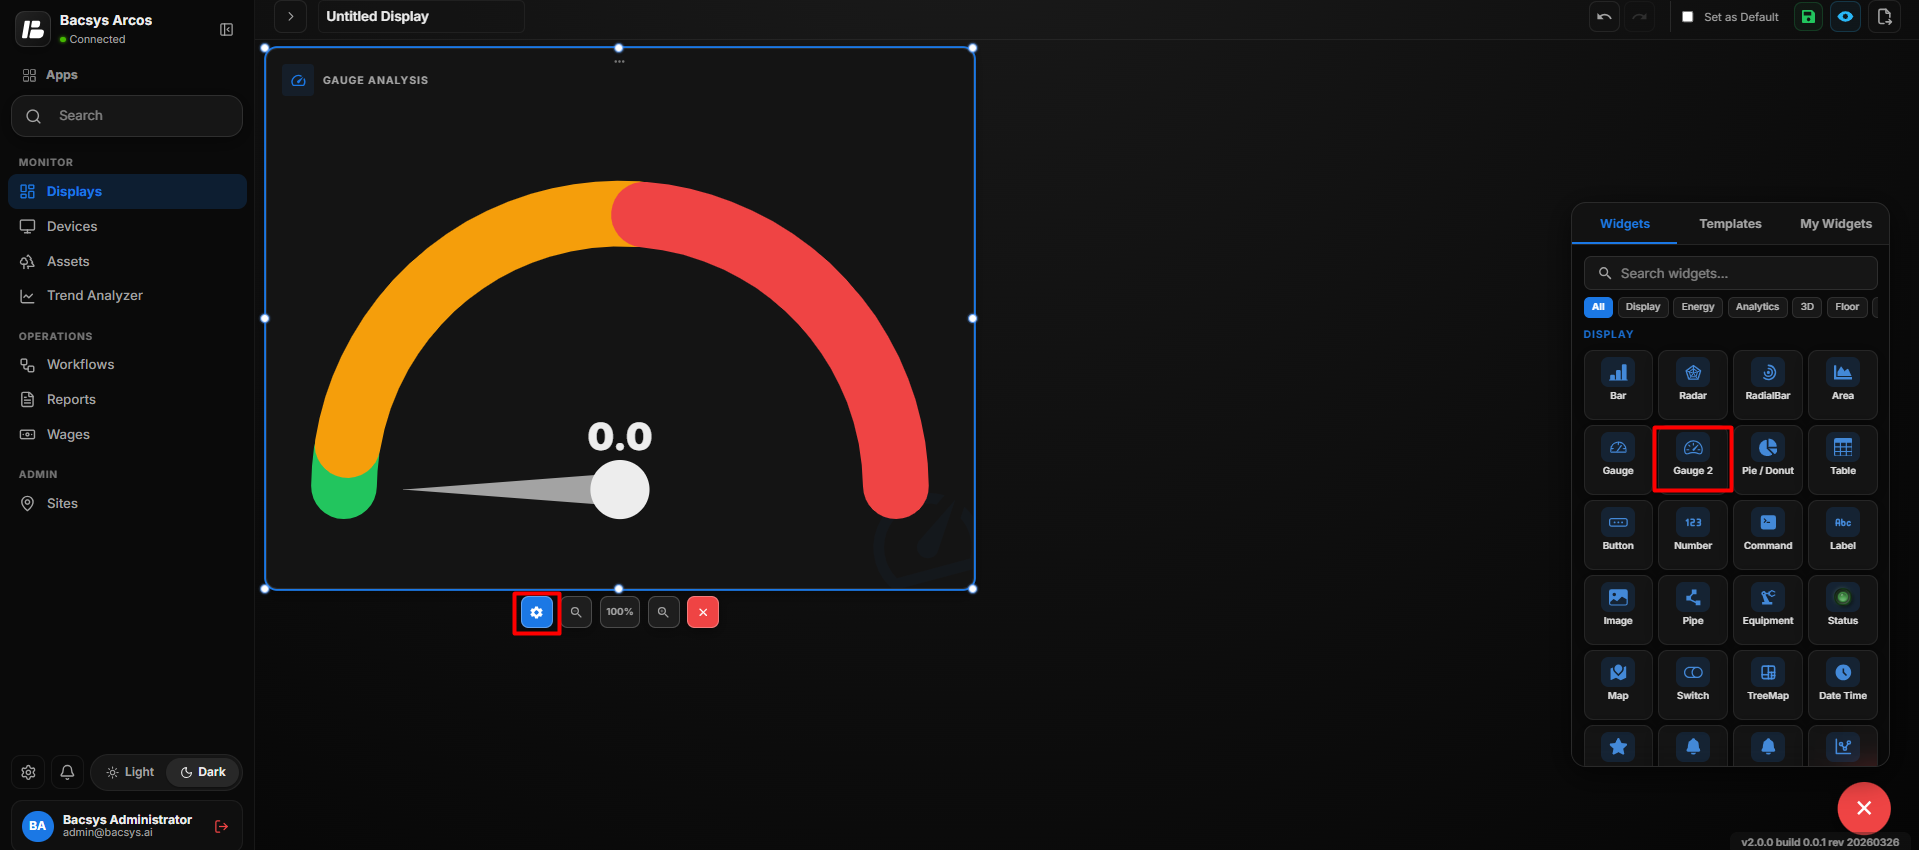
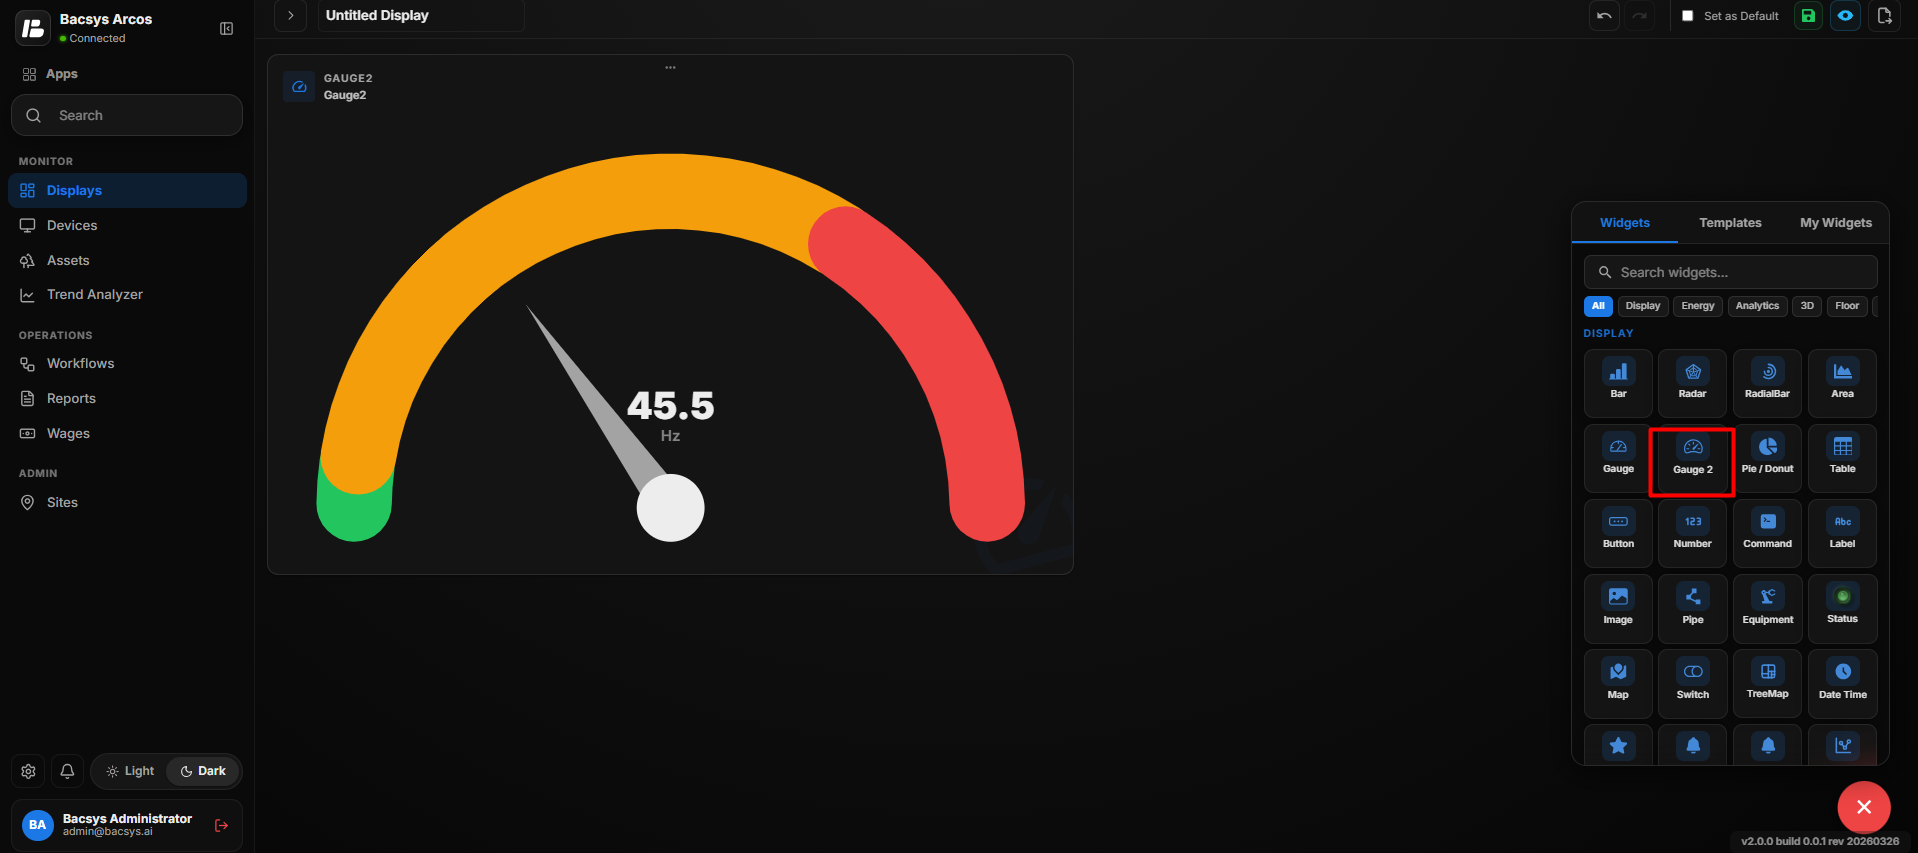
The Gauge 2 Widget is used to display the value of a selected point using a gauge visualization with configurable minimum, maximum, and critical value ranges. Users can also customize the colors associated with these value ranges.
Add the Gauge 2 Widget
- Click the + icon.
- Drag and drop the Gauge 2 Widget onto the display.
- Select the Gauge 2 Widget to view the available widget actions:
- Zoom In
- Zoom Out
- Settings
- Remove Widget
- Click Settings to open the Configure Data panel.
Gauge 2 Settings
| Option | Description |
|---|---|
| Title | Enter a title for the Gauge 2 Widget. The title identifies the information displayed by the gauge. |
| Subtitle | Enter an optional subtitle to provide additional information or context about the displayed value. |
| Select Point | Select the point whose value should be displayed in the Gauge 2 Widget. Click Browse Hierarchy to browse through Network → Device → Point and select the required point. |
| Poll Frequency (Seconds) | Specify how frequently the widget retrieves or refreshes the selected point value. |
| Min Value | Enter the minimum value for the gauge range. |
| Min Value Color | Select a color to represent the minimum value range. |
| Max Value | Enter the maximum value for the gauge range. |
| Max Value Color | Select a color to represent the maximum value range. |
| Critical Value | Enter the value at which the gauge should indicate a critical condition. |
| Critical Value Color | Select a color to represent the critical value or critical range. |
| Show Background | Use the toggle button to show or hide the widget background. |
| Hide Header | Use the toggle button to show or hide the widget header, including the title and subtitle. |
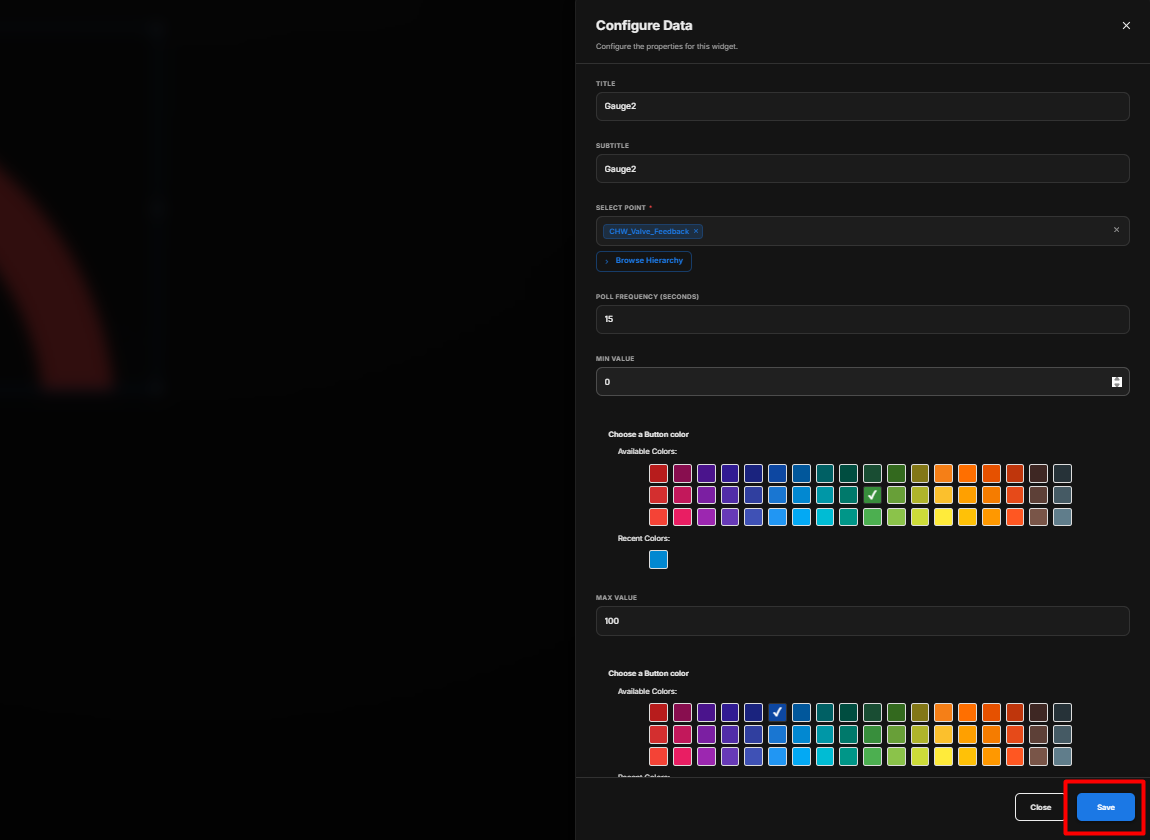
Configure the Gauge 2 Widget
- Enter the required Title.
- Enter an optional Subtitle.
- Under Select Point, click Browse Hierarchy.
- Navigate through Network → Device → Point.
- Select the required point.
- Set the required Poll Frequency (Seconds).
- Enter the required Min Value.
- Select a color for the Min Value.
- Enter the required Max Value.
- Select a color for the Max Value.
- Enter the required Critical Value.
- Select a color for the Critical Value.
- Configure the Show Background toggle according to your requirement.
- Configure the Hide Header toggle according to your requirement.
- Review all the configured settings.
- Click Save.
Save the Configuration
After clicking Save, the Gauge 2 Widget is updated on the display with the selected point, configured value ranges, threshold colors, and display settings.
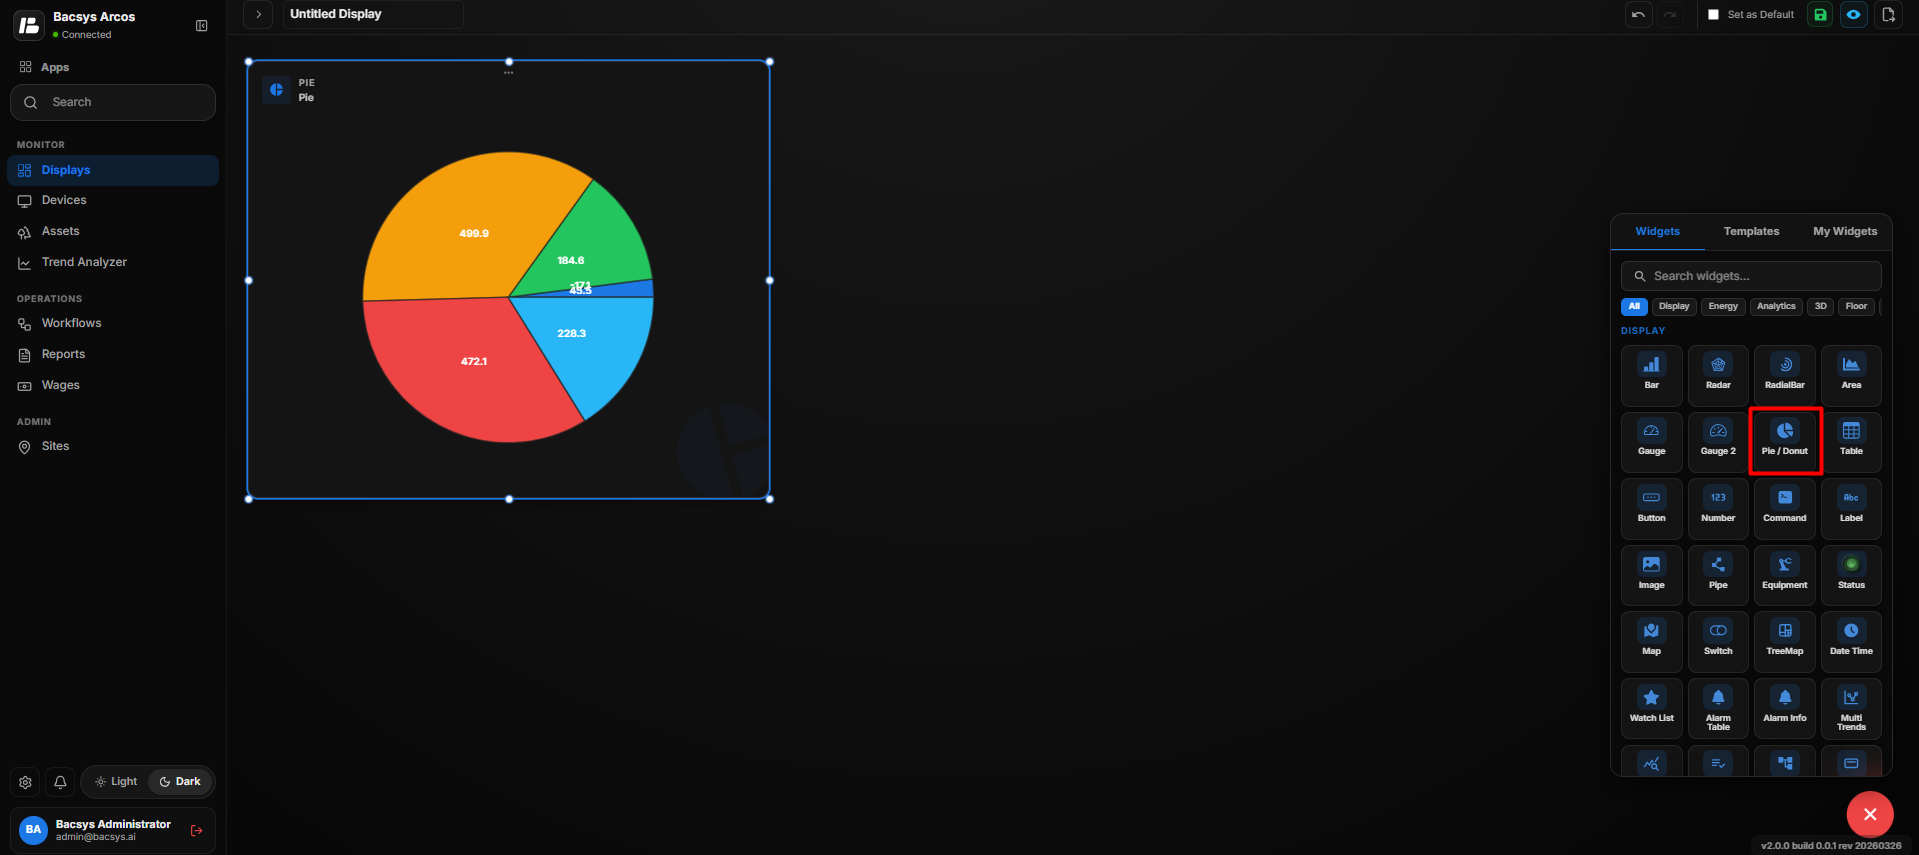
Add and Configure the Pie/Donut Chart Widget
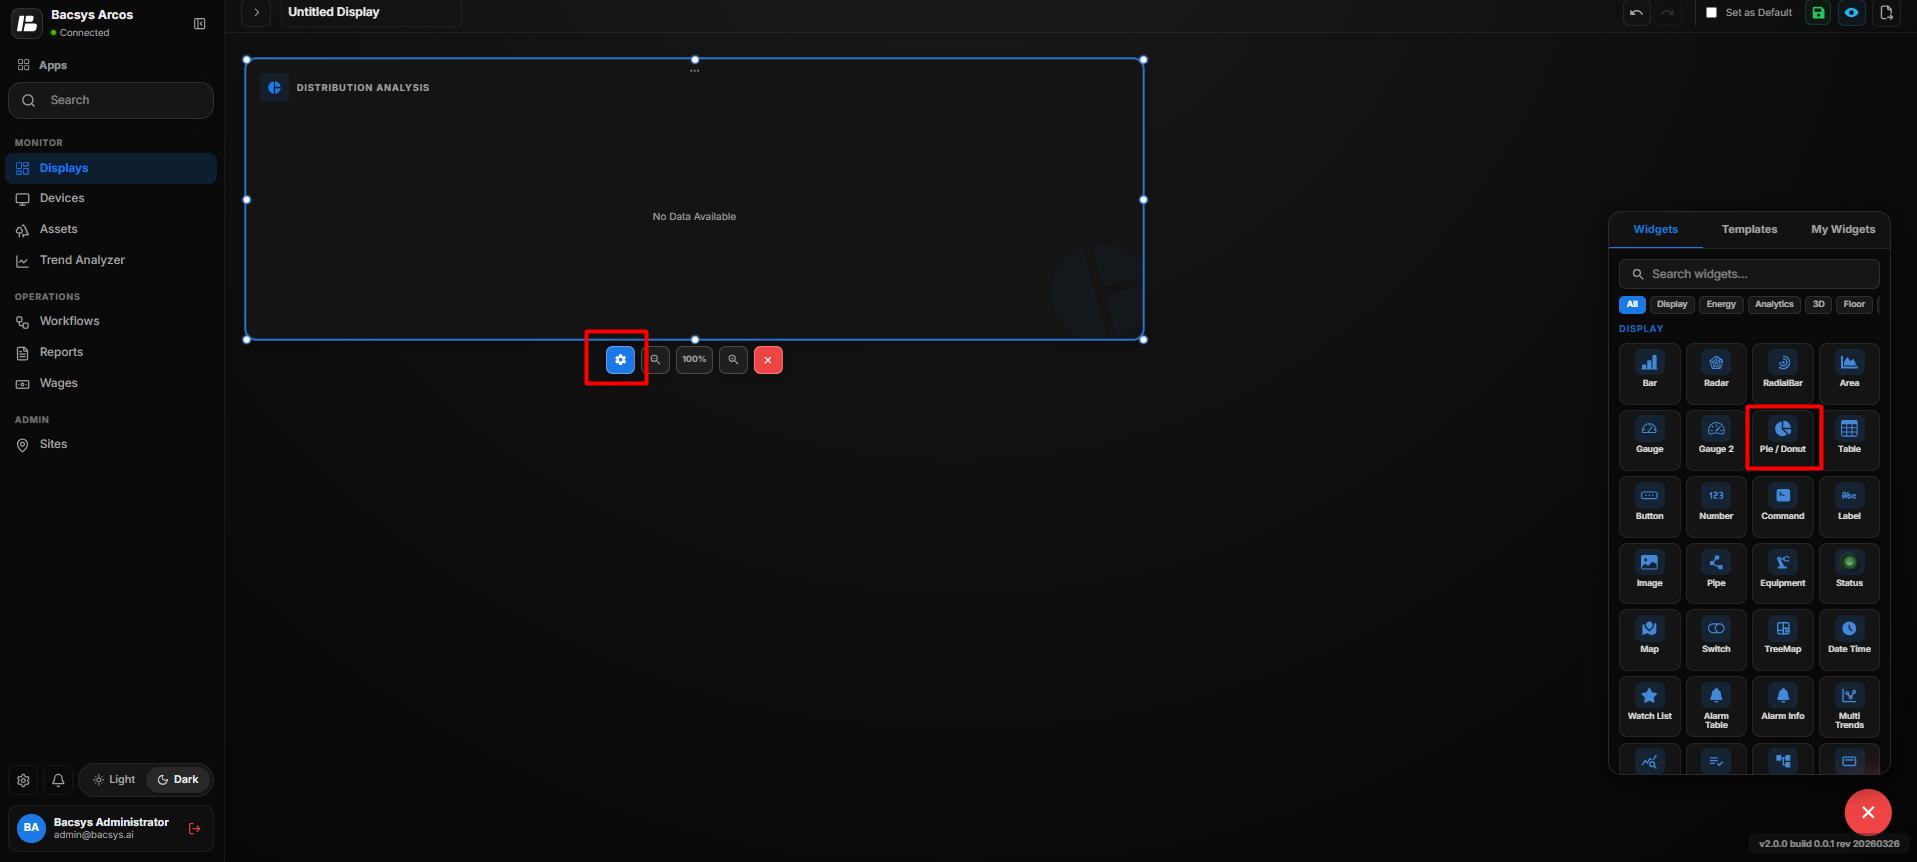
The Pie/Donut Chart Widget is used to display selected point values as sections of a circular chart. It helps users compare the relative values of multiple points in a simple visual format. The widget can be configured as either a Pie Chart or a Donut Chart.
Add the Pie/Donut Chart Widget
- Click the + icon.
- Drag and drop the Pie/Donut Chart Widget onto the display.
- Select the widget to view the available widget actions:
- Zoom In
- Zoom Out
- Settings
- Remove Widget
- Click Settings to open the Configure Data panel.
Pie/Donut Chart Settings
| Option | Description |
|---|---|
| Title | Enter a title for the Pie/Donut Chart. The title identifies the information displayed by the chart. |
| Subtitle | Enter an optional subtitle to provide additional information or context about the displayed values. |
| Select Points | Select the required points to display in the Pie/Donut Chart. Click Browse Hierarchy to browse through Network → Device → Point and select the required points. |
| Poll Frequency (Seconds) | Specify how frequently the widget retrieves or refreshes the selected point values. |
| Represent as Donut Chart | Use the toggle button to change the chart from a Pie Chart to a Donut Chart. |
| Show Background | Use the toggle button to show or hide the widget background. |
| Hide Header | Use the toggle button to show or hide the widget header, including the title and subtitle. |
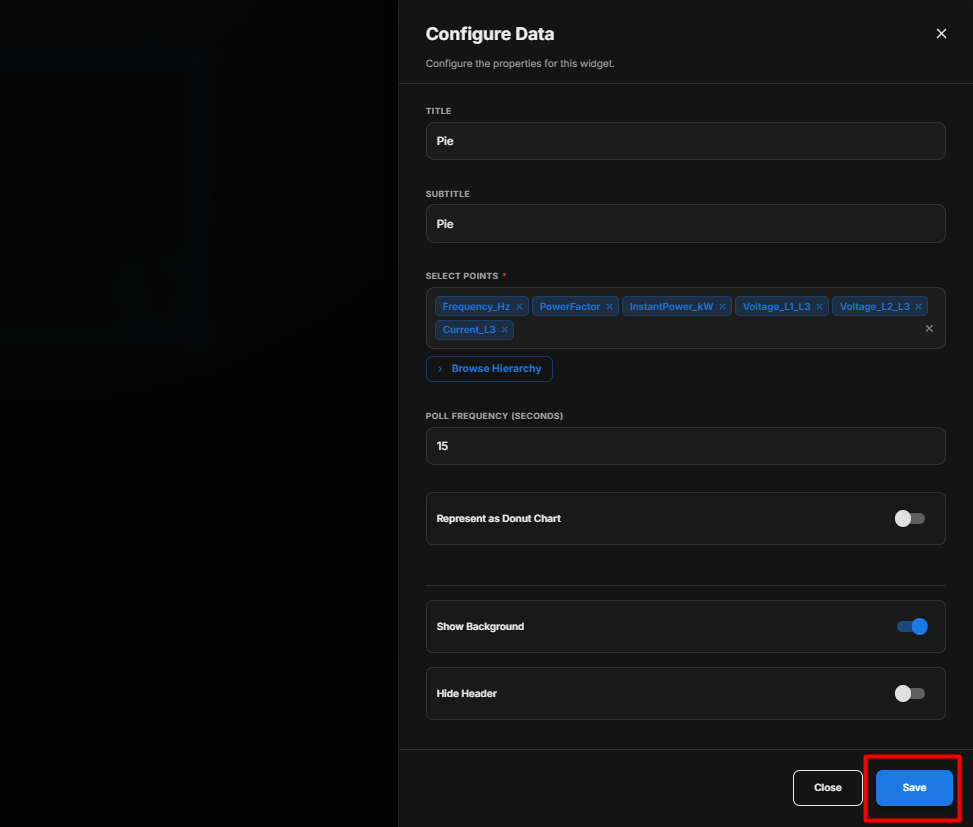
Configure the Pie/Donut Chart
- Enter the required Title.
- Enter an optional Subtitle.
- Under Select Points, click Browse Hierarchy.
- Navigate through Network → Device → Point.
- Select the required points.
- Set the required Poll Frequency (Seconds).
- To display the chart as a donut, enable the Represent as Donut Chart toggle.
- To keep the chart as a pie chart, leave the Represent as Donut Chart toggle disabled.
- Configure the Show Background toggle according to your requirement.
- Configure the Hide Header toggle according to your requirement.
- Review all the configured settings.
- Click Save.
Save the Configuration
After clicking Save, the Pie/Donut Chart Widget is updated on the display with the selected points and configured settings.
Note: By default, the widget is displayed as a Pie Chart. Enable Represent as Donut Chart to display it as a Donut Chart.
Add and Configure the Table Widget
The Table Widget is used to display selected point information in a tabular format. It allows users to view point values in rows and columns and customize how the table is displayed.
Add the Table Widget
- Click the + icon.
- Drag and drop the Table Widget onto the display.
- Select the Table Widget to view the available widget actions:
- Zoom In
- Zoom Out
- Settings
- Remove Widget
- Click Settings to open the Configure Data panel.
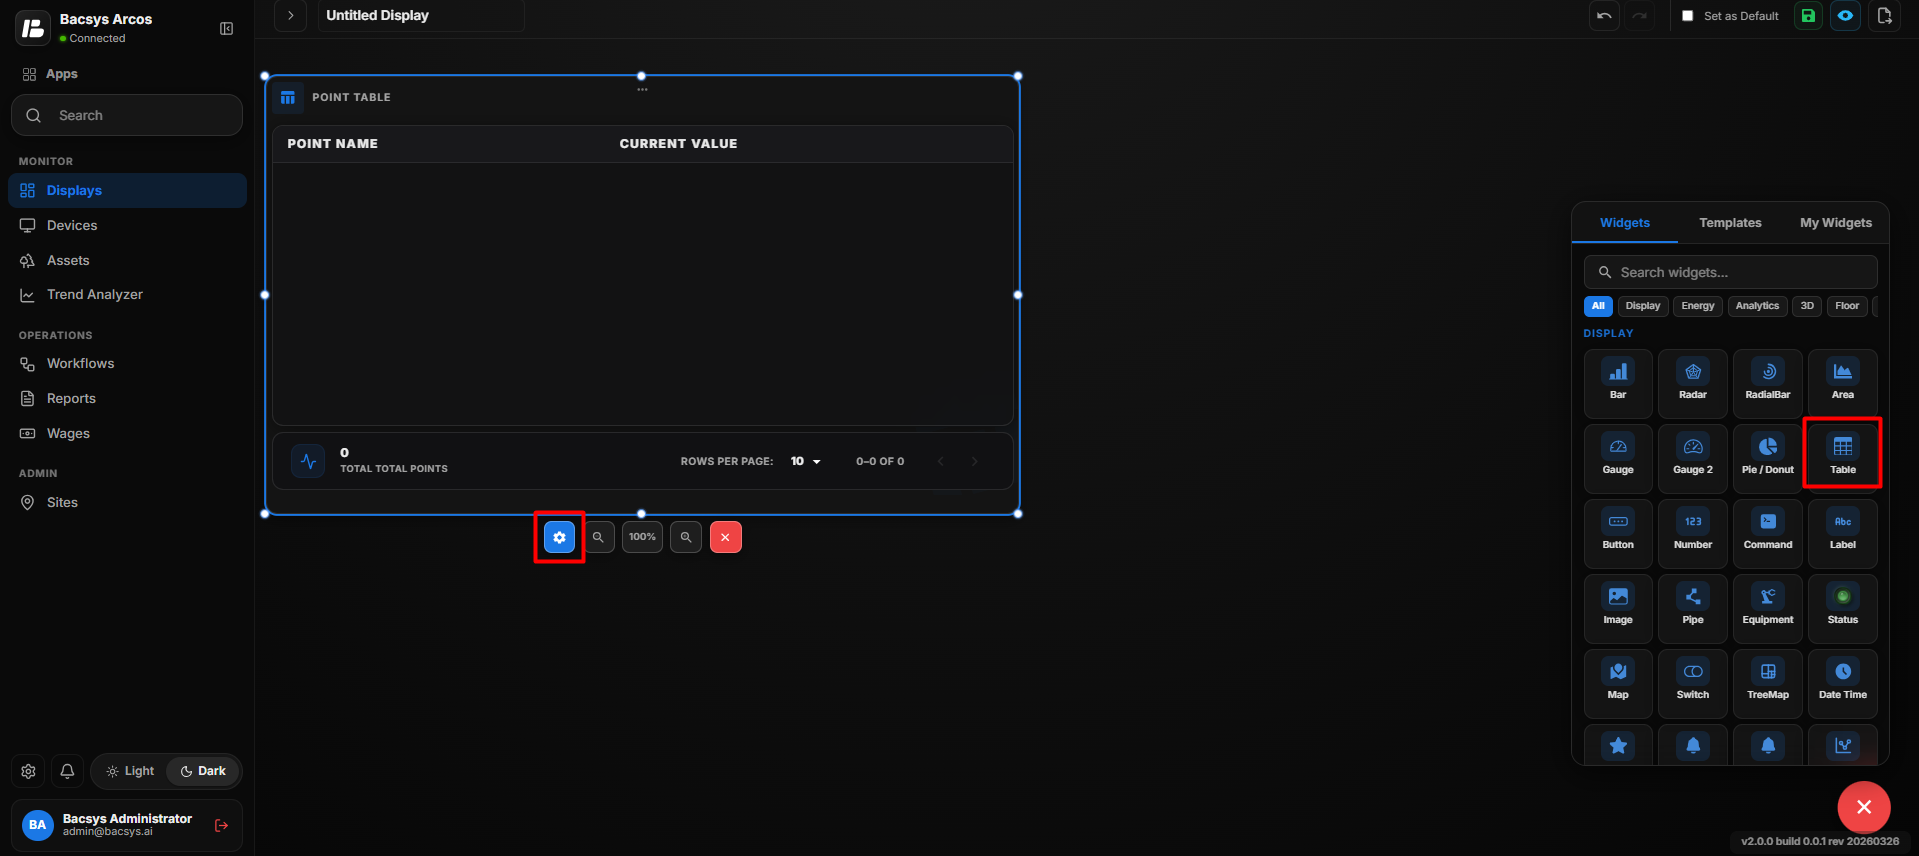
Table Widget Settings
| Option | Description |
|---|---|
| Title | Enter a title for the Table Widget. The title identifies the information displayed in the table. |
| Subtitle | Enter an optional subtitle to provide additional information or context about the table. |
| Select Points | Select the required points to display in the table. Click Browse Hierarchy to browse through Network → Device → Point and select the required points. |
| Poll Frequency (Seconds) | Specify how frequently the widget retrieves or refreshes the selected point values. |
| Enable Write Value | Use the toggle button to enable or disable the ability to write or modify point values directly from the table. |
| Bold Text | Use the toggle button to display the table text in bold. |
| Font Size | Enter the required font size for the text displayed in the table. |
| Show Background | Use the toggle button to show or hide the widget background. |
| Hide Header | Use the toggle button to show or hide the widget header, including the title and subtitle. |
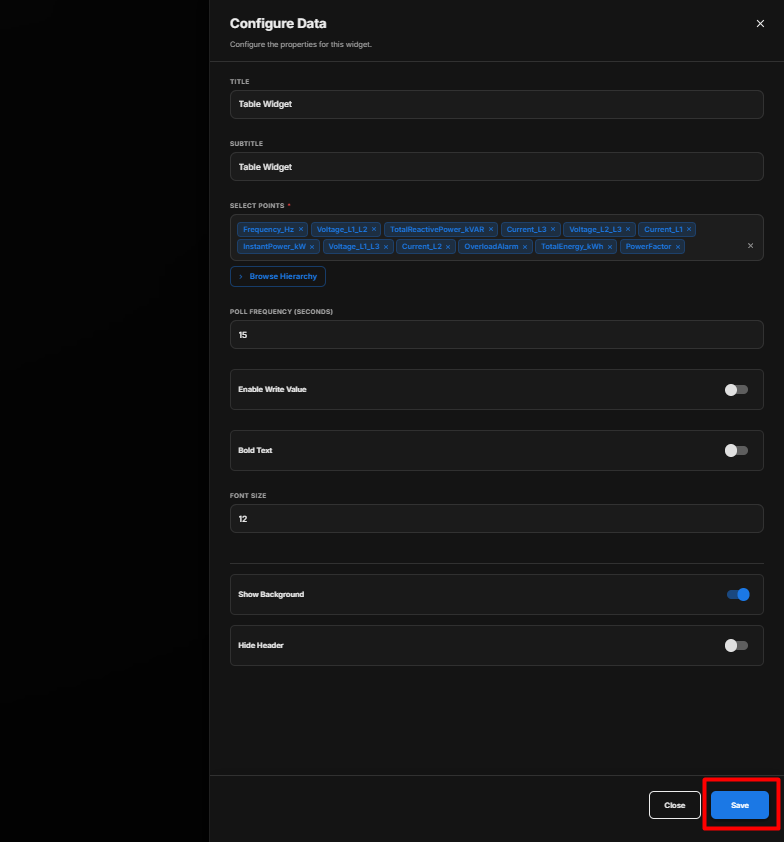
Configure the Table Widget
- Enter the required Title.
- Enter an optional Subtitle.
- Under Select Points, click Browse Hierarchy.
- Navigate through Network → Device → Point.
- Select the required points.
- Set the required Poll Frequency (Seconds).
- If required, enable Enable Write Value to allow point values to be modified from the table.
- If required, enable Bold Text to display the table text in bold.
- Enter the required Font Size.
- Configure the Show Background toggle according to your requirement.
- Configure the Hide Header toggle according to your requirement.
- Review all the configured settings.
- Click Save.
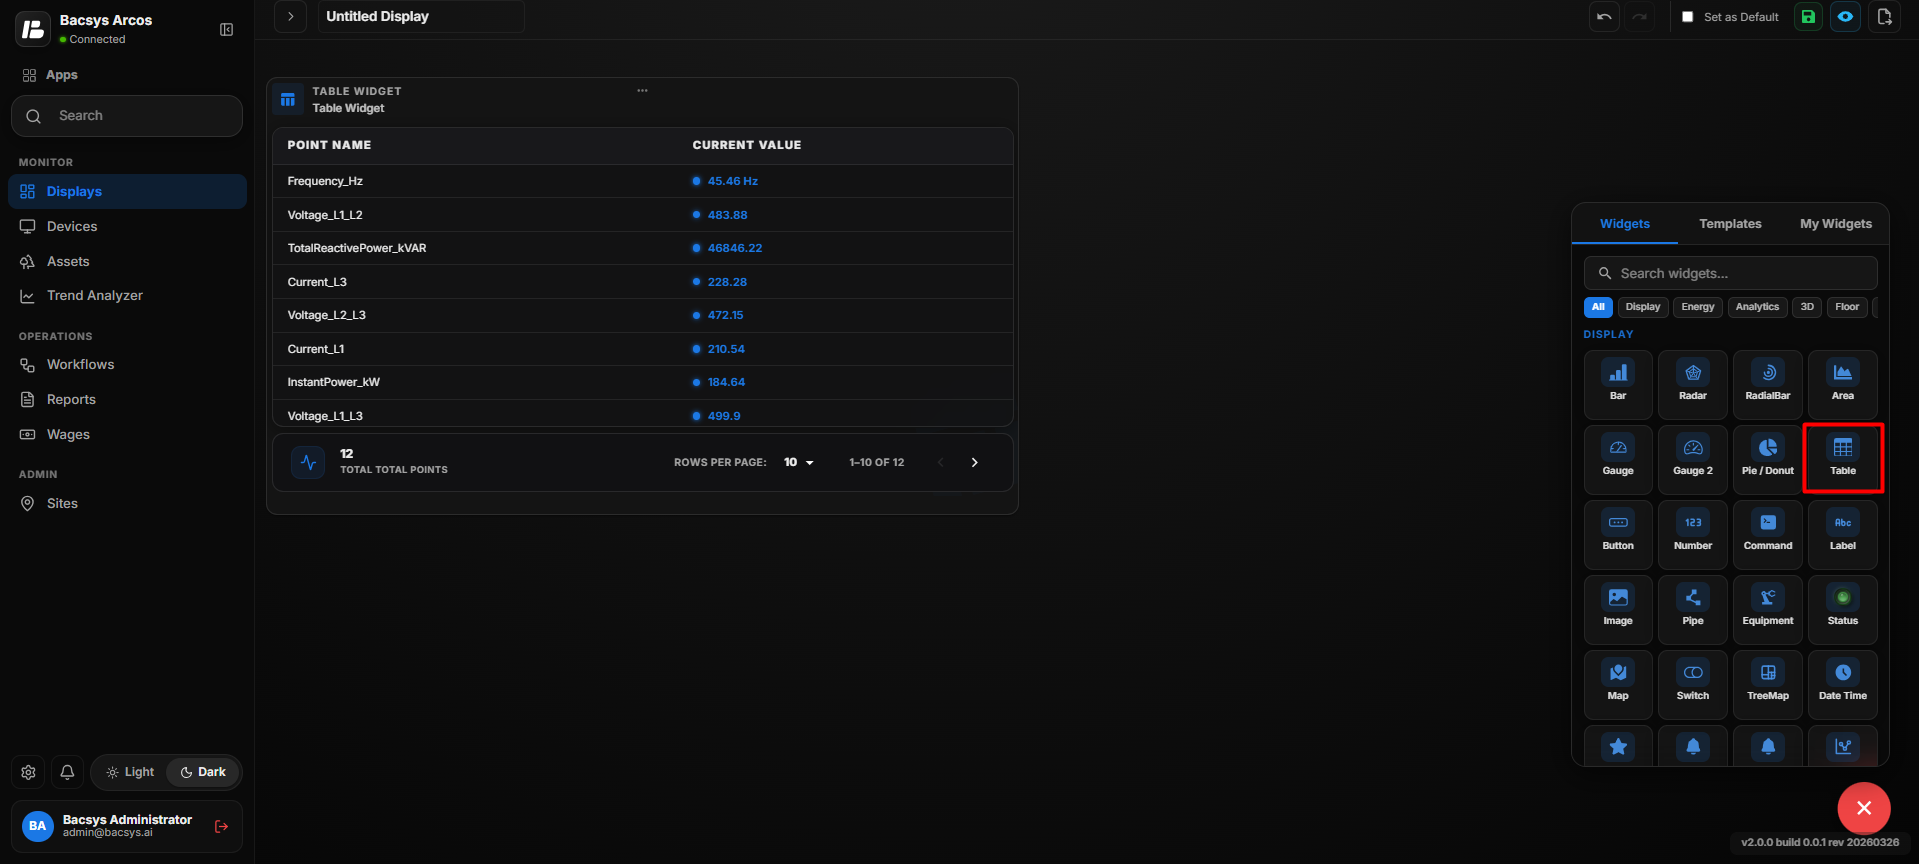
Save the Configuration
After clicking Save, the Table Widget is updated on the display and shows the selected point values according to the configured settings.
Add and Configure the Button Widget
The Button Widget is used to create an interactive button on the display. Users can configure the button text, font size, link, colors, associated display, and appearance settings. The button can also be configured to open a linked page in a new browser tab.
Add the Button Widget
- Click the + icon.
- Drag and drop the Button Widget onto the display.
- Select the Button Widget to view the available widget actions:
- Zoom In
- Zoom Out
- Settings
- Remove Widget
- Click Settings to open the Configure Data panel.
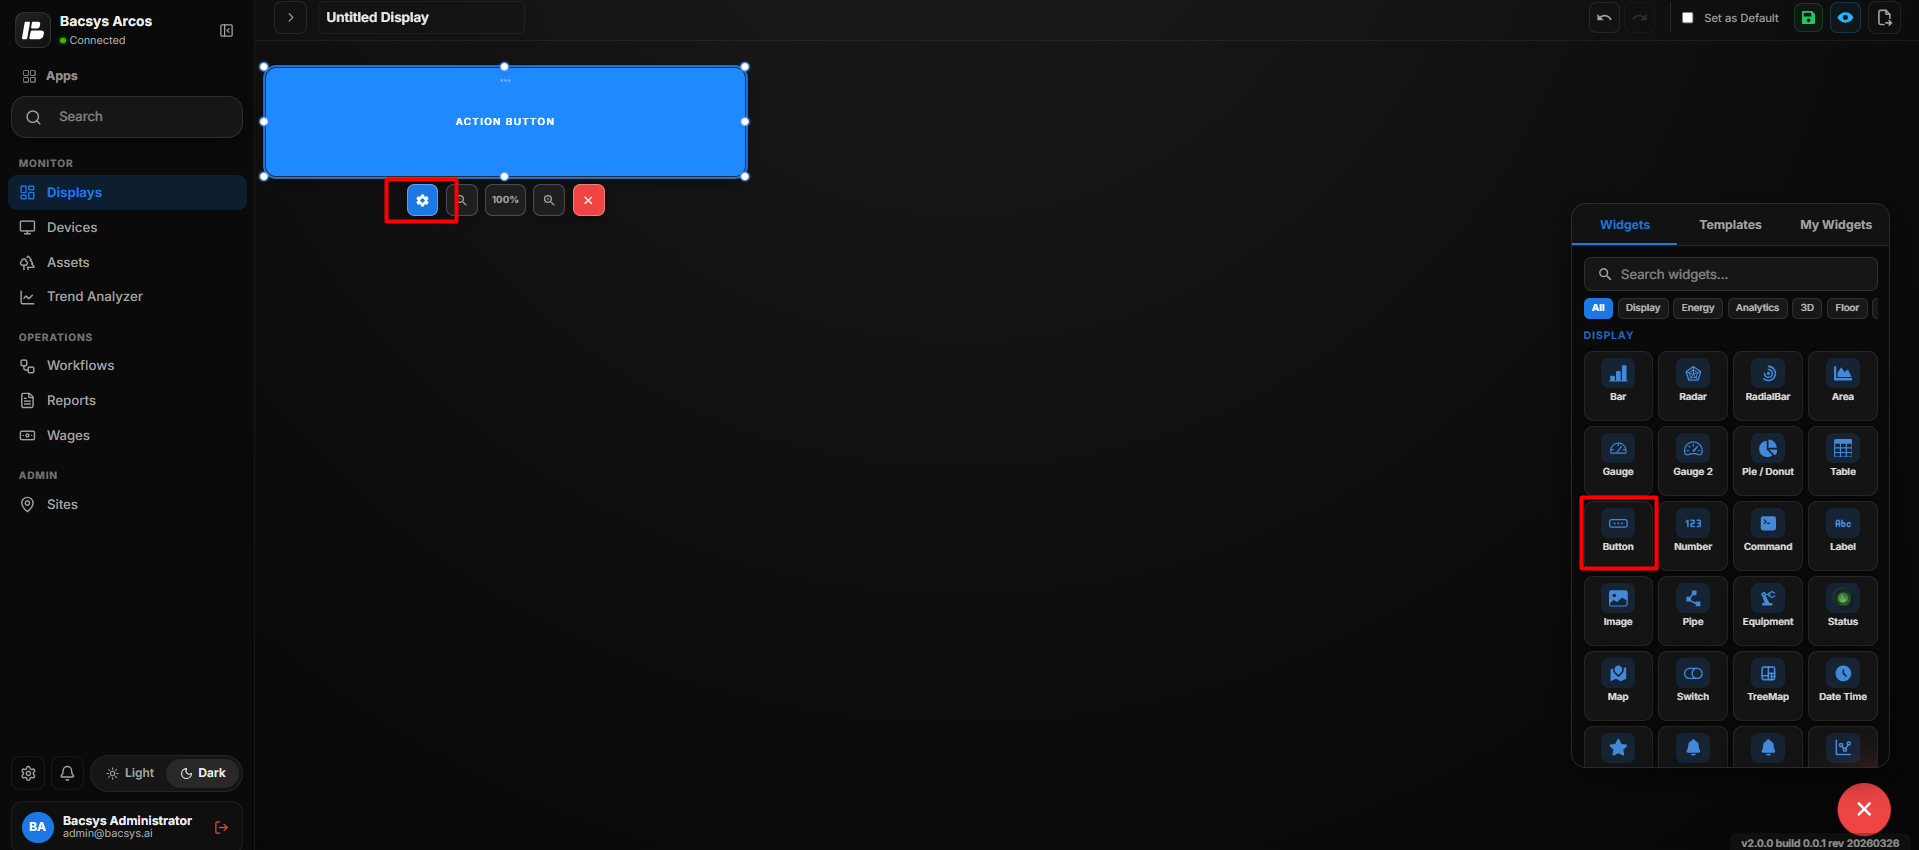
Button Widget Settings
| Option | Description |
|---|---|
| Button Name | Enter the text that should be displayed on the button. |
| Font Size | Enter the required font size for the button text. |
| URL Link | Enter the URL of the page or website that should open when the button is selected. This field is optional. |
| Open URL in New Tab | Enable the toggle to open the configured URL in a new browser tab. |
| Select Display | Select the display that should be associated with the button. Use the search field to find the required display and select it from the available list. |
| Choose a Background Color | Select the background color of the button from the available colors. |
| Choose a Text Color | Select the text color of the button from the available colors. |
| Bold Text | Enable the toggle to display the button text in bold. |
| Italic Text | Enable the toggle to display the button text in italic style. |
| Fill Caps | Enable the toggle to display the button text in capital letters. |
| Image | Upload an image to use with the button. You can drag and drop an image into the upload area or click Browse Files to select an image. |
| Show Background | Enable or disable the widget background using the toggle button. |
| Hide Header | Enable the toggle to hide the widget header. |
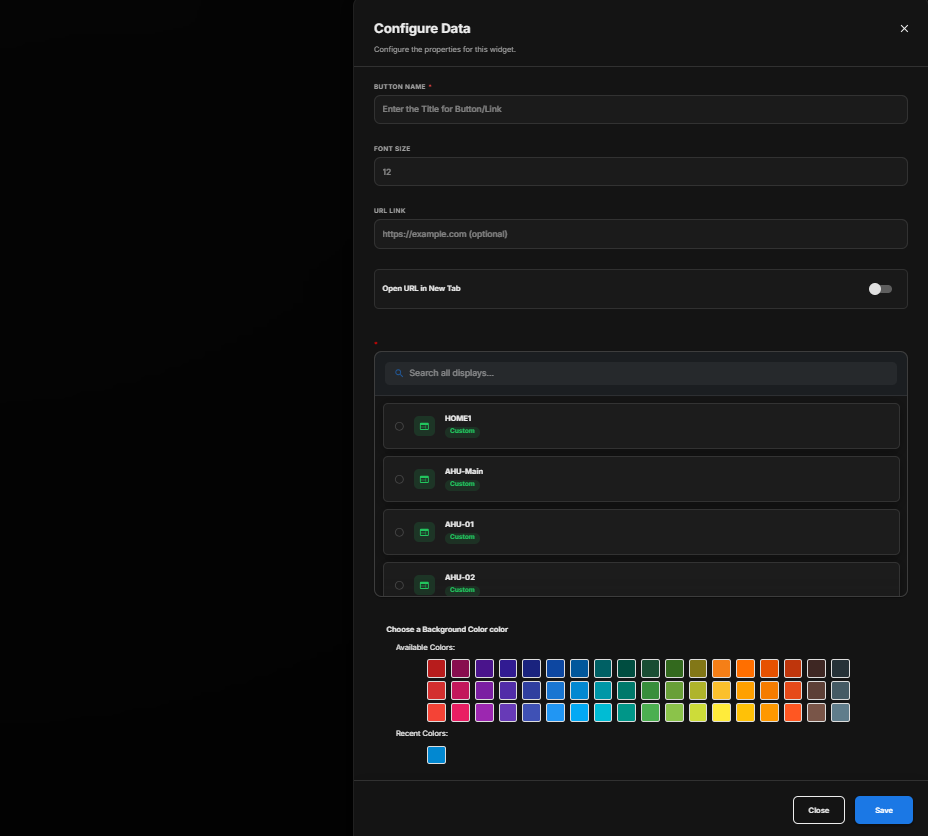
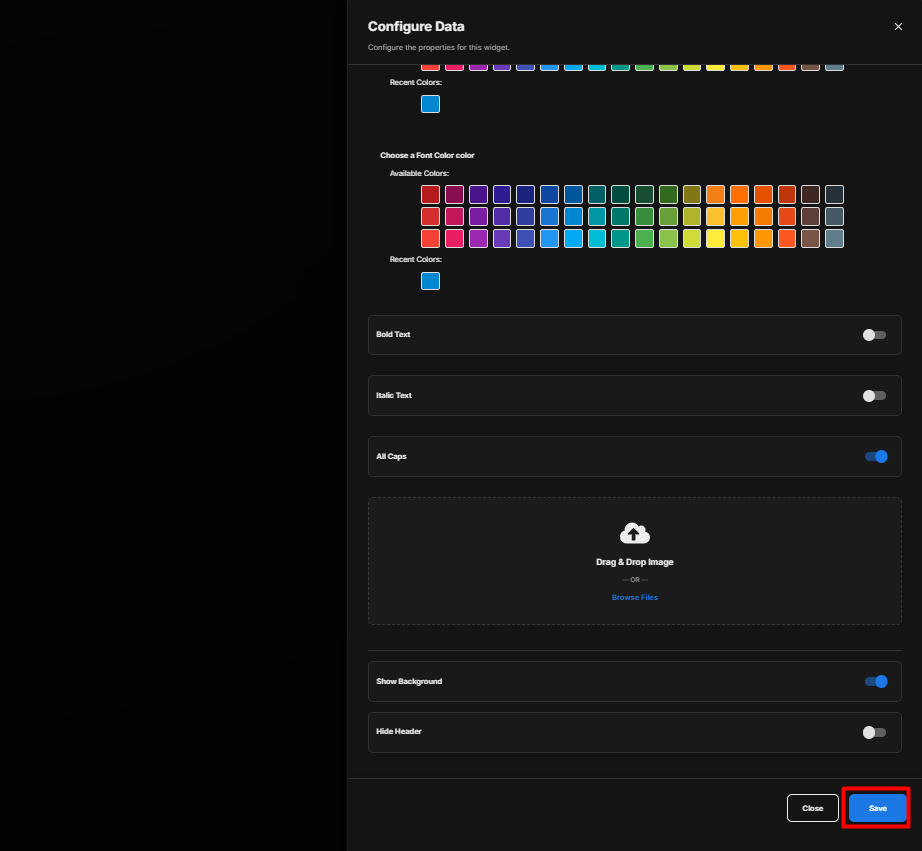
Configure the Button Widget
- Enter the required Button Name.
- Set the required Font Size.
- If required, enter a URL Link.
- Enable Open URL in New Tab if the URL should open in a new browser tab.
- Select the required Display from the available displays.
- Select a Background Color for the button.
- Select a Text Color for the button.
- Enable Bold Text if the button text should appear in bold.
- Enable Italic Text if the button text should appear in italic style.
- Enable Fill Caps if the button text should be displayed in capital letters.
- If required, upload an Image by dragging and dropping the image or clicking Browse Files.
- Configure Show Background according to your requirement.
- Configure Hide Header according to your requirement.
- Review all the configured settings.
- Click Save.
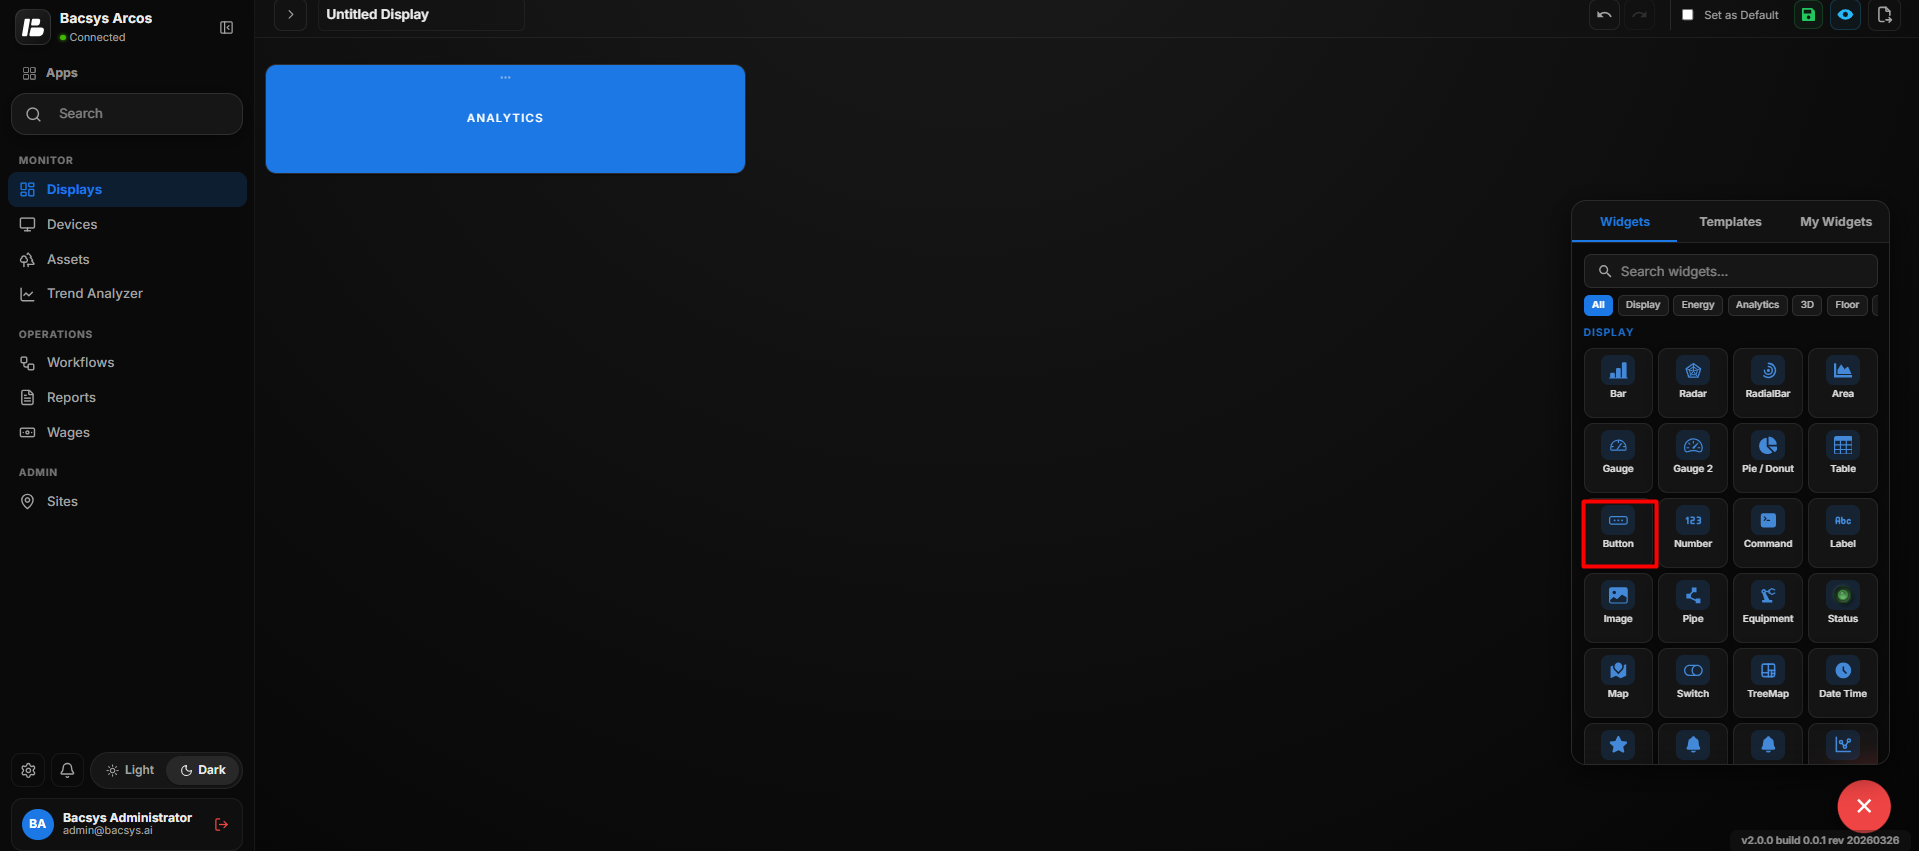
Save the Configuration
After clicking Save, the Button Widget is updated on the display with the configured text, colors, formatting, associated display or URL, and appearance settings.
Button Navigation
When a display is selected under Select Display, clicking the configured button navigates directly to that display.
For example, if the Floor 1 display is selected for a button named Floor 1, clicking the button takes the user directly to the Floor 1 display.
Add and Configure the Number Widget
The Number Widget is used to display the current value of a selected point as a number on the display. It provides a simple way to monitor a specific point value and can be configured to control how the value is displayed.
Add the Number Widget
- Click the + icon.
- Drag and drop the Number Widget onto the display.
- Select the Number Widget to view the available widget actions:
- Zoom In
- Zoom Out
- Settings
- Remove Widget
- Click Settings to open the Configure Data panel.
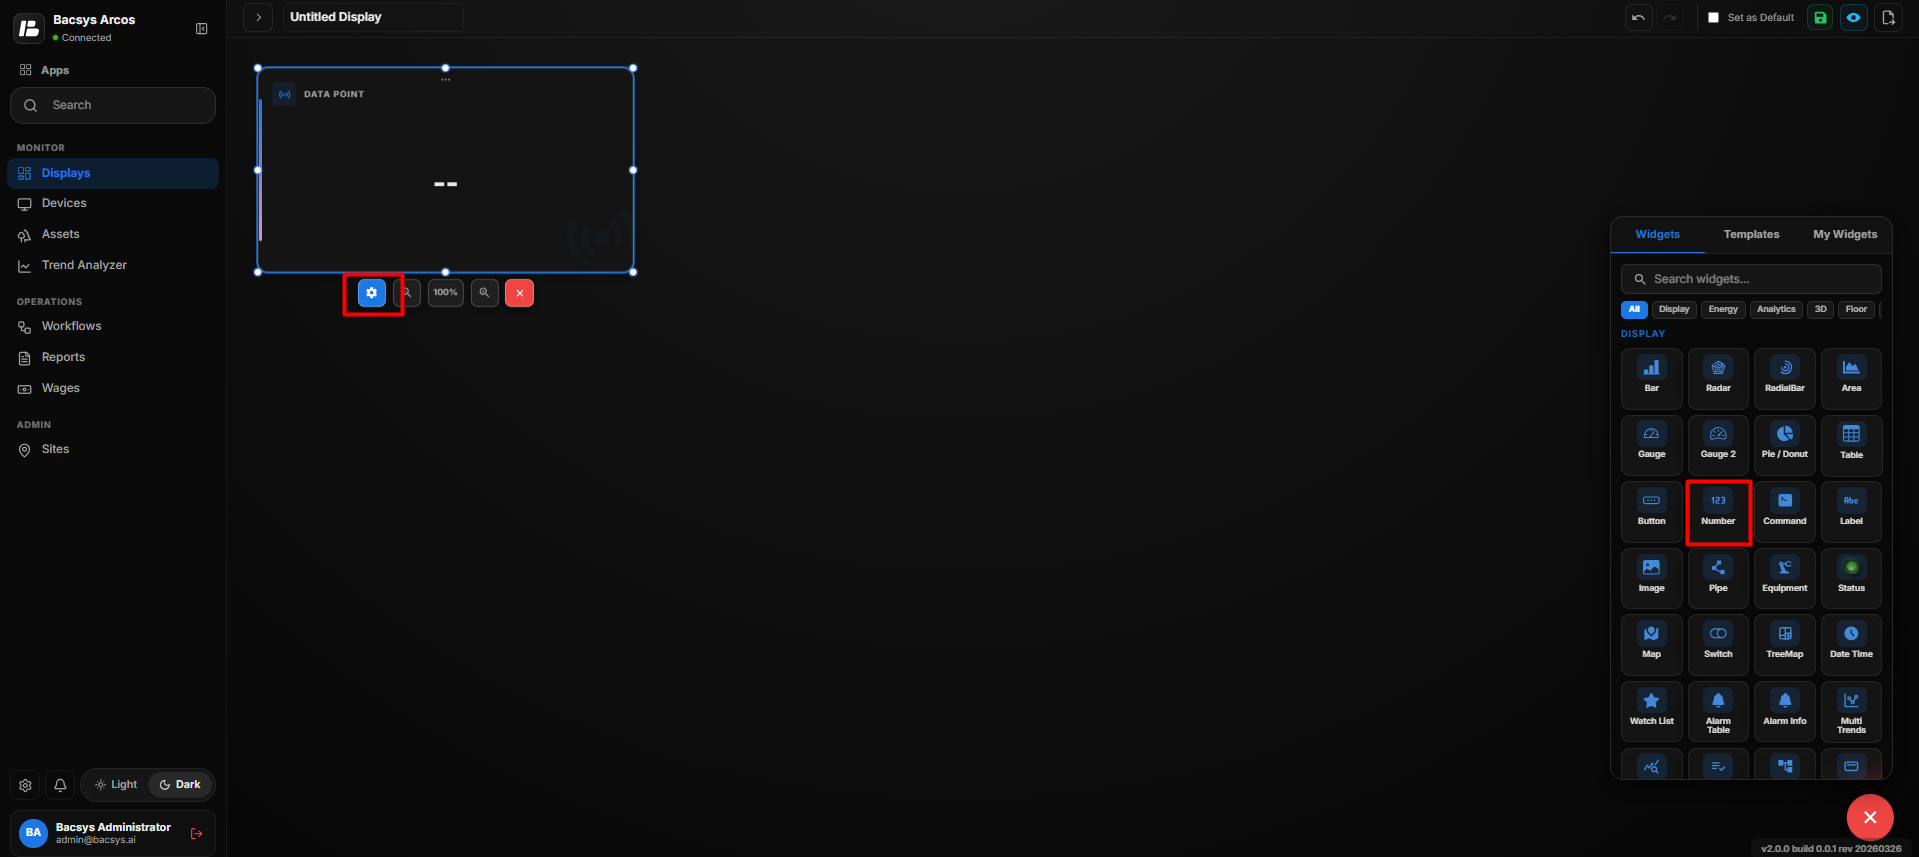
Number Widget Settings
| Option | Description |
|---|---|
| Title | Enter a title for the Number Widget. The title identifies the information displayed by the widget. |
| Subtitle | Enter an optional subtitle to provide additional information or context about the displayed value. |
| Select Point | Select the point whose current value should be displayed. Click Browse Hierarchy to browse through Network → Device → Point and select the required point. |
| Poll Frequency (Seconds) | Specify how frequently the widget retrieves or refreshes the selected point value. |
| Hide Decimal Value | Enable the toggle to hide the decimal portion of the displayed value. Disable it to display the decimal value. |
| Show Background | Use the toggle button to show or hide the widget background. |
| Hide Header | Use the toggle button to show or hide the widget header, including the title and subtitle. |
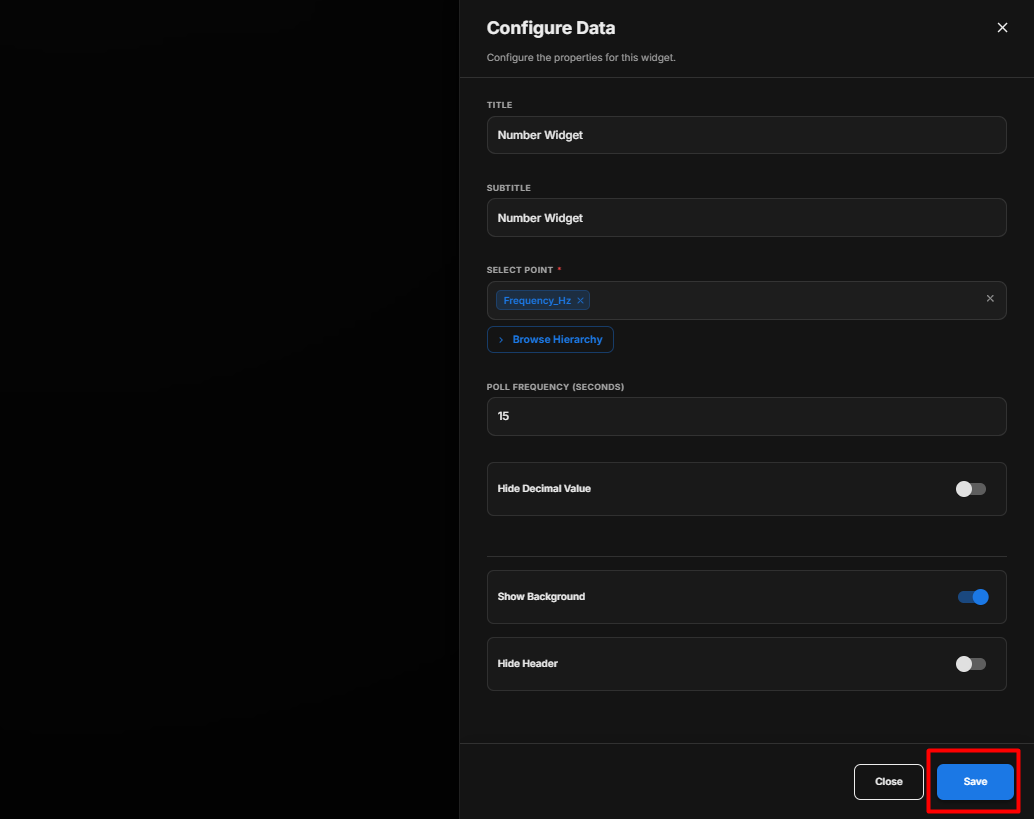
Configure the Number Widget
- Enter the required Title.
- Enter an optional Subtitle.
- Under Select Point, click Browse Hierarchy.
- Navigate through Network → Device → Point.
- Select the required point.
- Set the required Poll Frequency (Seconds).
- Enable Hide Decimal Value if you want to display only the whole-number portion of the point value.
- Configure Show Background according to your requirement.
- Configure Hide Header according to your requirement.
- Review all the configured settings.
- Click Save.
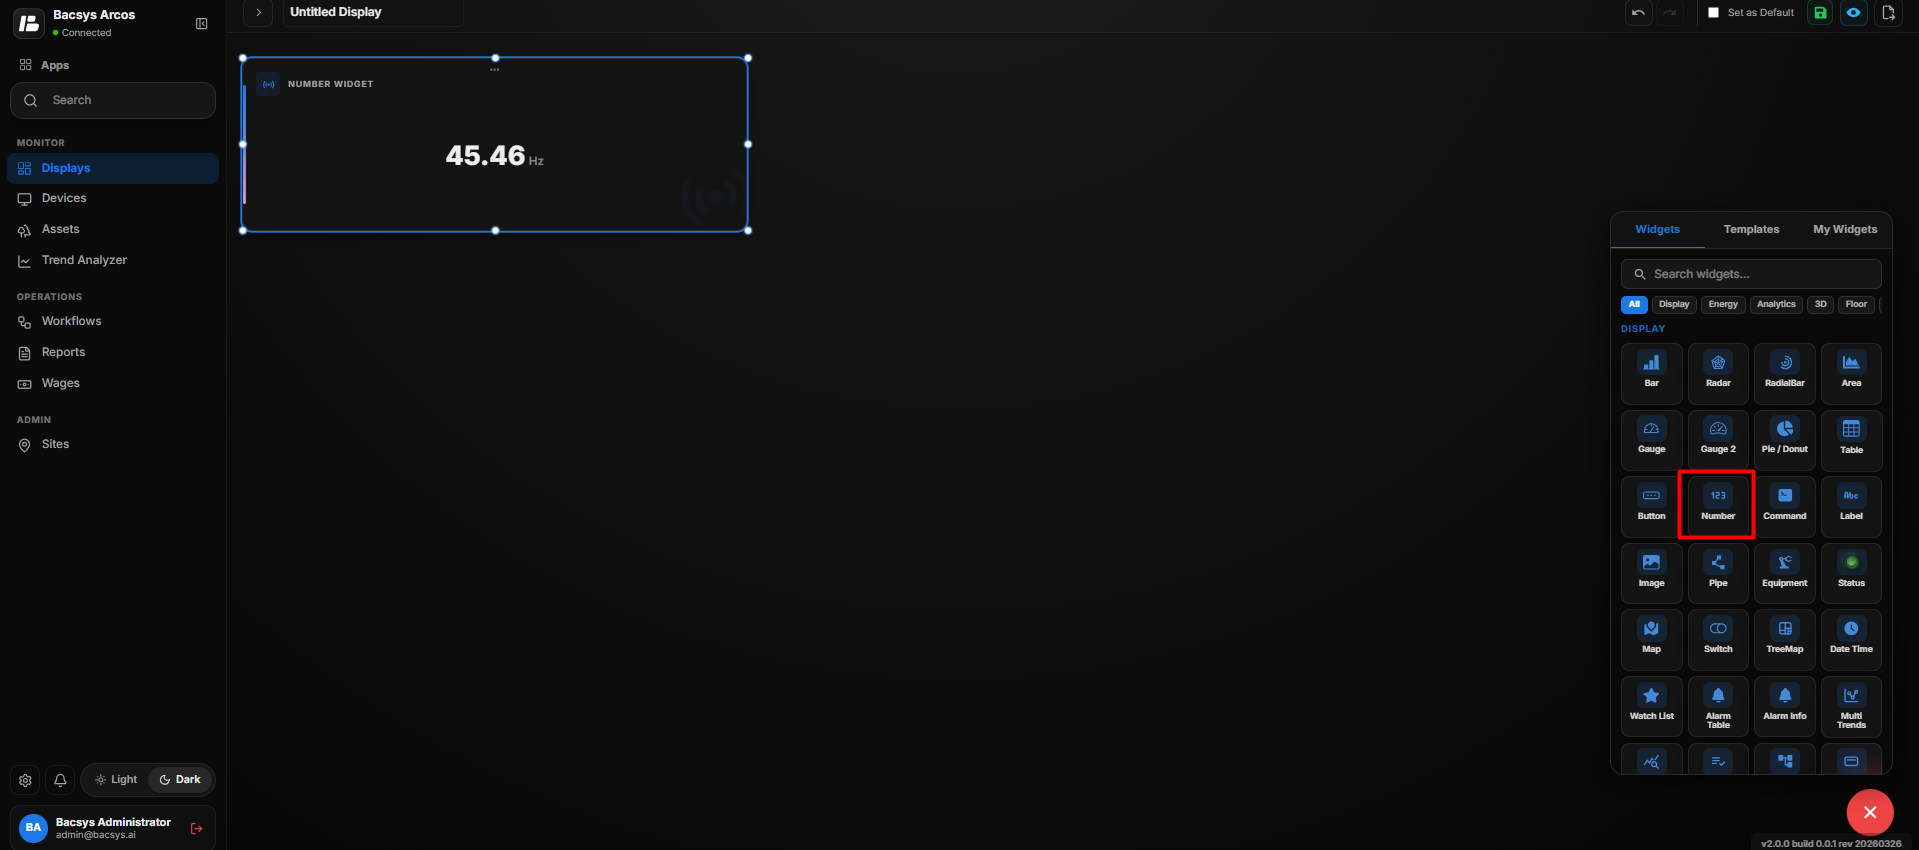
Save the Configuration
After clicking Save, the Number Widget is updated on the display and shows the selected point's current value according to the configured settings.
Add and Configure the Command Widget
The Command Widget is used to display a selected point and provide a command or control interface for that point. It allows users to select a point, customize the font size, and control how the widget is displayed.
Add the Command Widget
- Click the + icon.
- Drag and drop the Command Widget onto the display.
- Select the Command Widget to view the available widget actions:
- Zoom In
- Zoom Out
- Settings
- Remove Widget
- Click Settings to open the Configure Data panel.
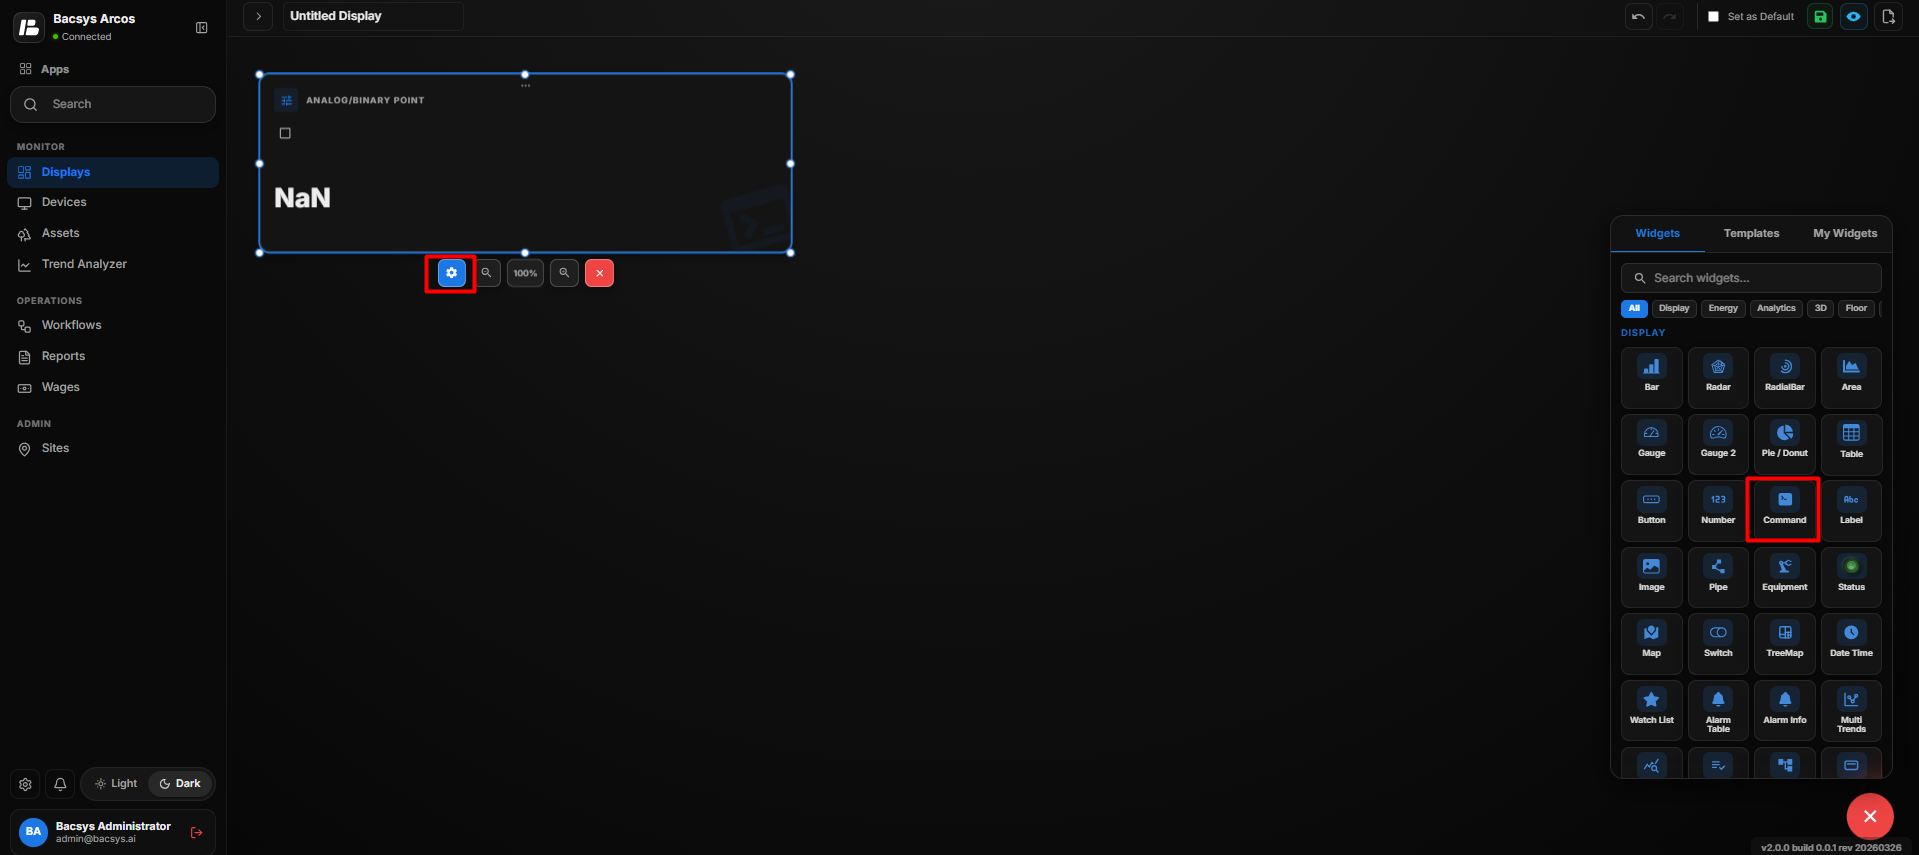
Command Widget Settings
| Option | Description |
|---|---|
| Title | Enter a title for the Command Widget. The title identifies the information or command displayed by the widget. |
| Select Point | Select the point that the Command Widget should control or display. Click Browse Hierarchy to browse through Network → Device → Point and select the required point. |
| Font Size | Enter the required font size for the text displayed in the Command Widget. |
| Hide Auto Manual | Use the toggle button to show or hide the Auto/Manual control for the selected point. |
| Show Background | Use the toggle button to show or hide the widget background. |
| Hide Header | Use the toggle button to show or hide the widget header, including the title. |
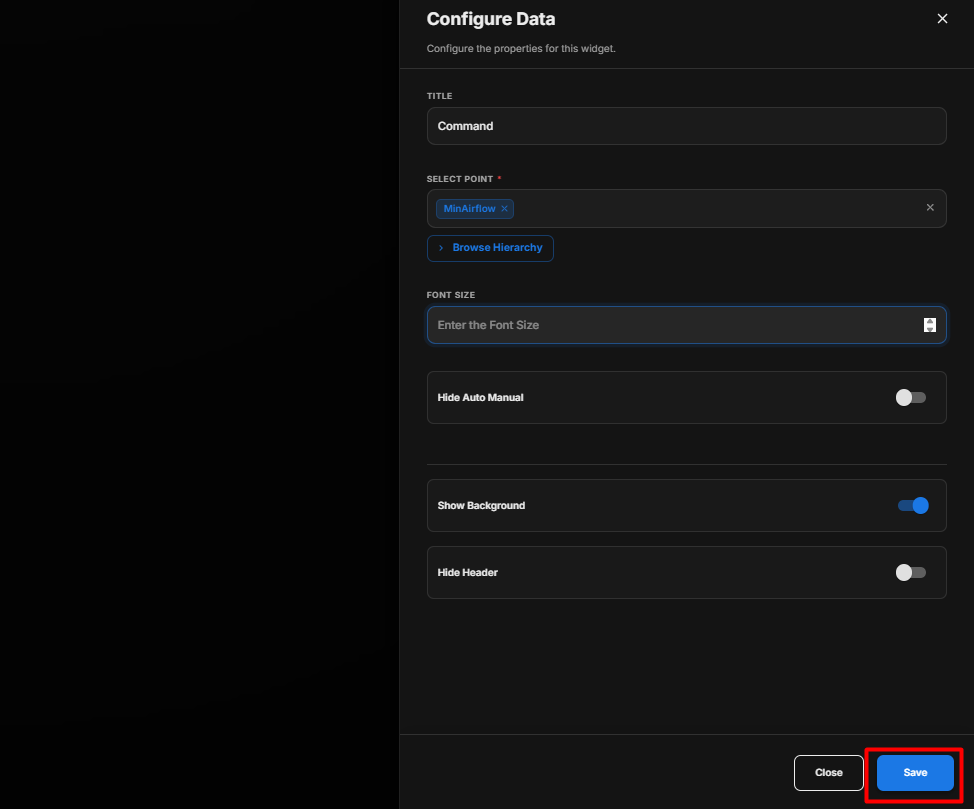
Configure the Command Widget
- Enter the required Title.
- Under Select Point, click Browse Hierarchy.
- Navigate through Network → Device → Point.
- Select the required point.
- Enter the required Font Size.
- Configure Hide Auto Manual according to your requirement.
- Configure Show Background according to your requirement.
- Configure Hide Header according to your requirement.
- Review all the configured settings.
- Click Save.
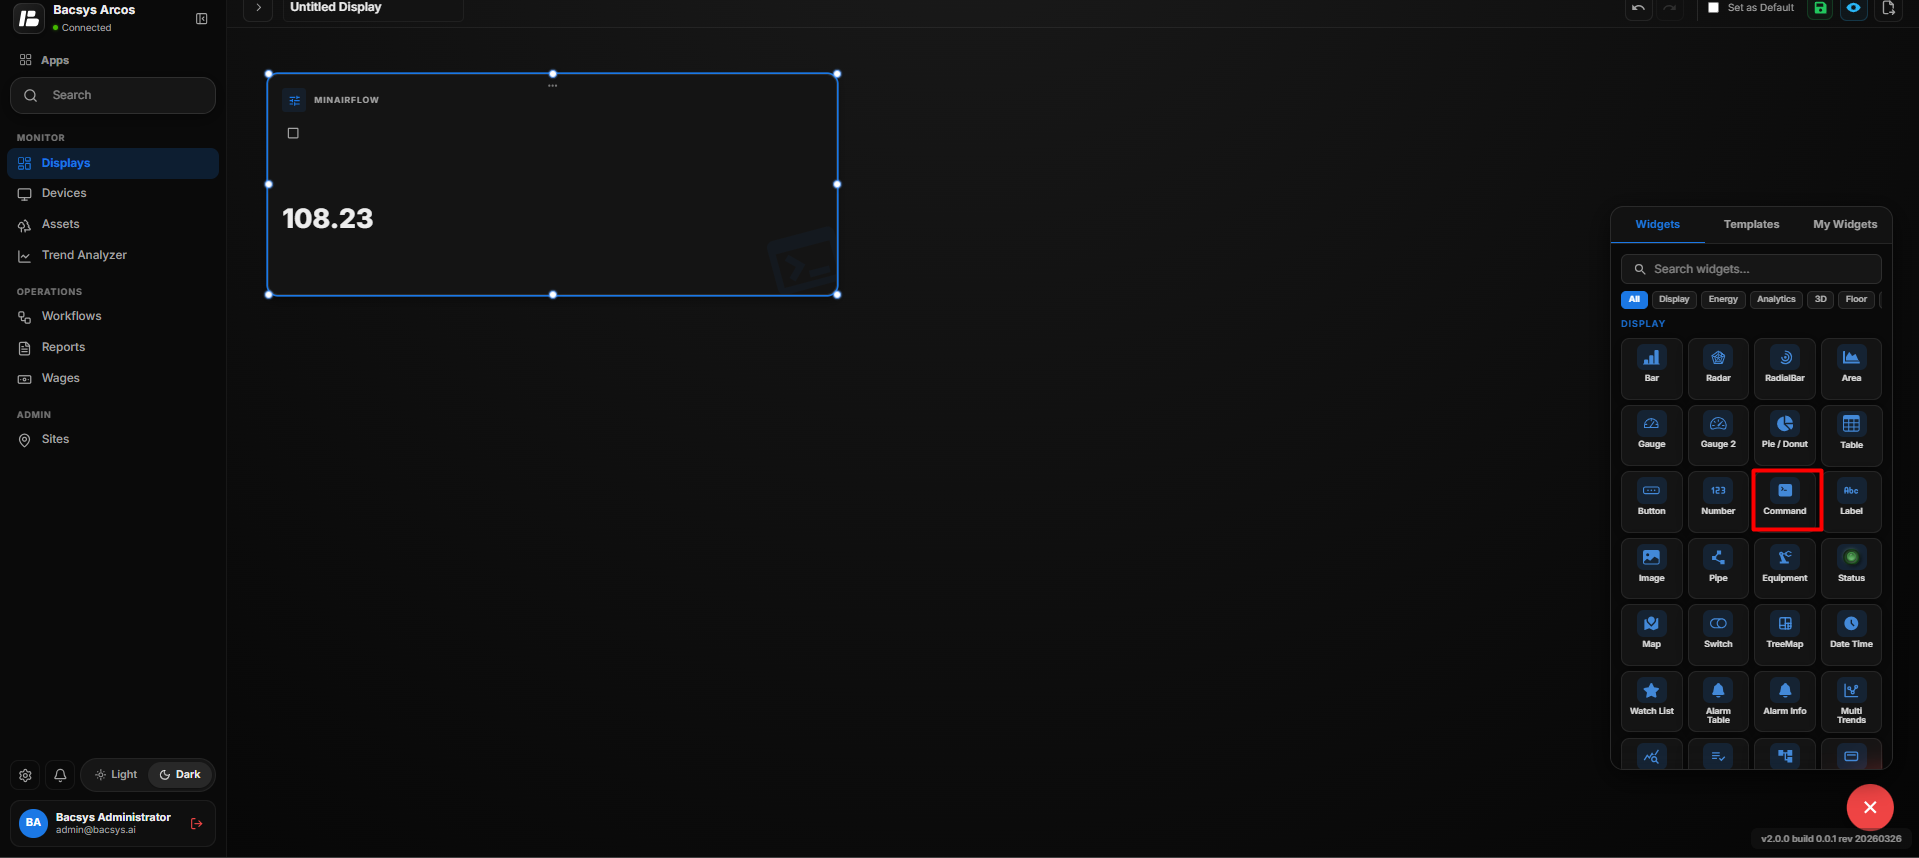
Save the Configuration
After clicking Save, the Command Widget is updated on the display with the selected point and configured display settings.
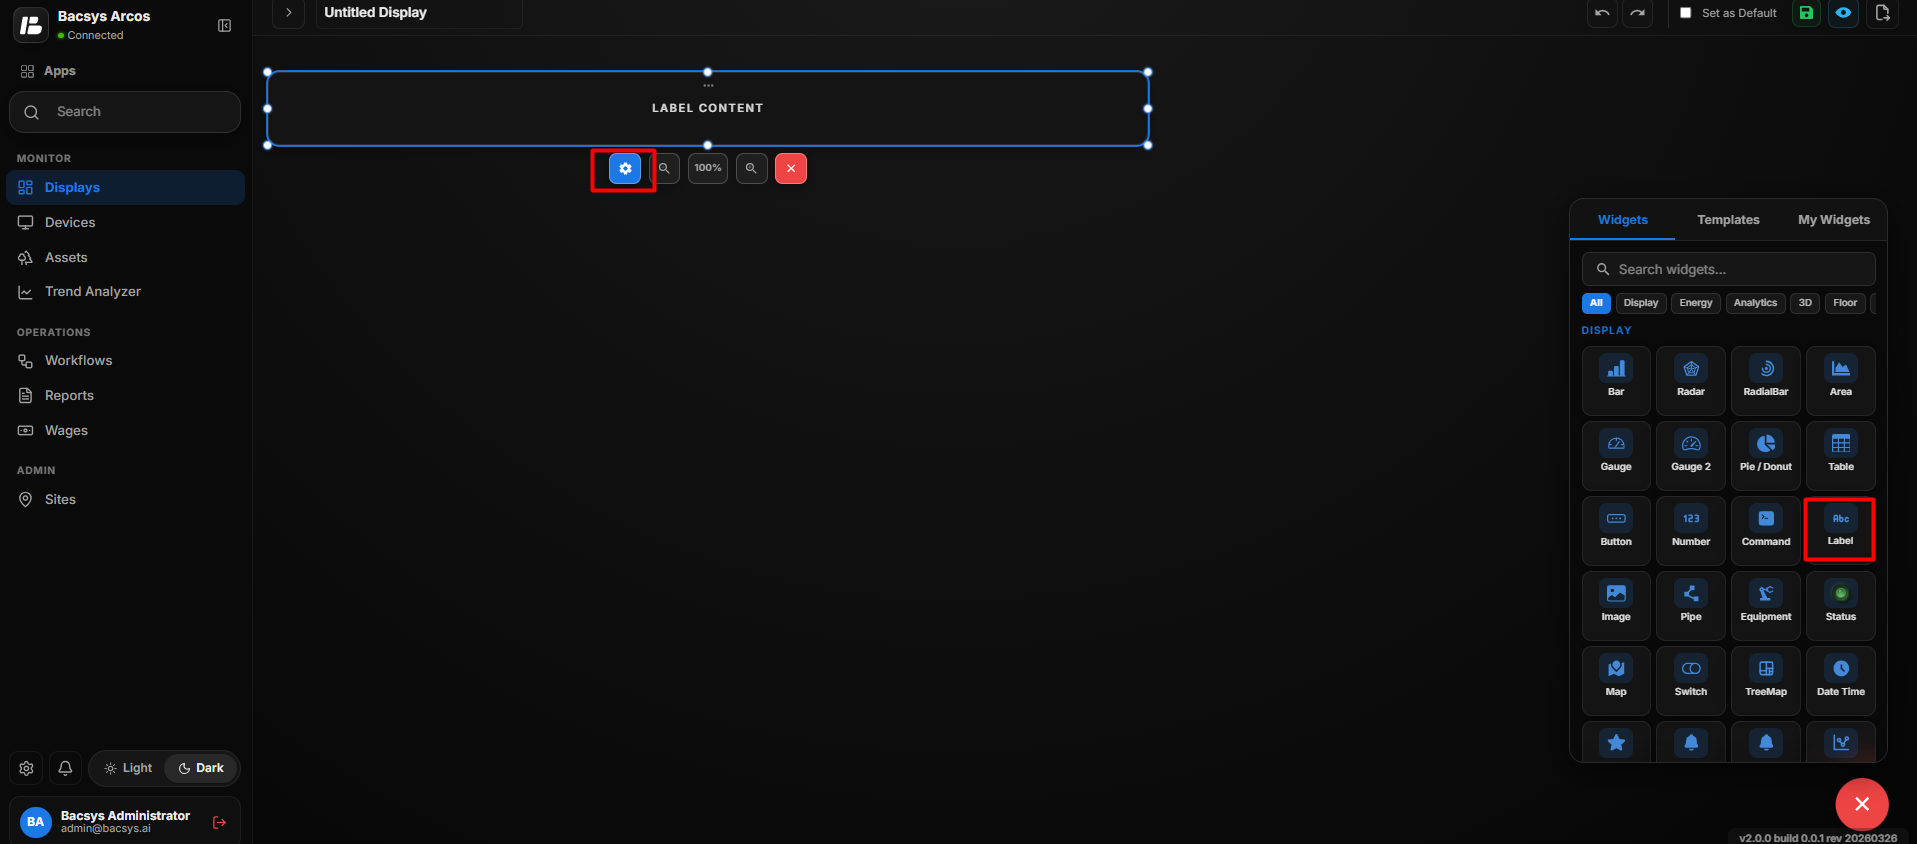
Add and Configure the Label Widget
The Label Widget is used to display text labels on the display. It allows users to customize the label text, font size, colors, and text formatting to match the display requirements.
Add the Label Widget
- Click the + icon.
- Drag and drop the Label Widget onto the display.
- Select the Label Widget to view the available widget actions:
- Zoom In
- Zoom Out
- Settings
- Remove Widget
- Click Settings to open the Configure Data panel.
Label Widget Settings
| Option | Description |
|---|---|
| Label | Enter the text that should be displayed in the Label Widget. |
| Font Size | Enter the required font size for the label text. |
| Show Status Indicator | Use the toggle button to show or hide the status indicator associated with the label. |
| Choose a Background Color | Select the required background color for the label from the available colors. |
| Choose a Font Color | Select the required font color for the label from the available colors. |
| Bold Text | Enable the toggle to display the label text in bold. |
| Italic Text | Enable the toggle to display the label text in italic style. |
| All Caps | Enable the toggle to display the label text entirely in capital letters. |
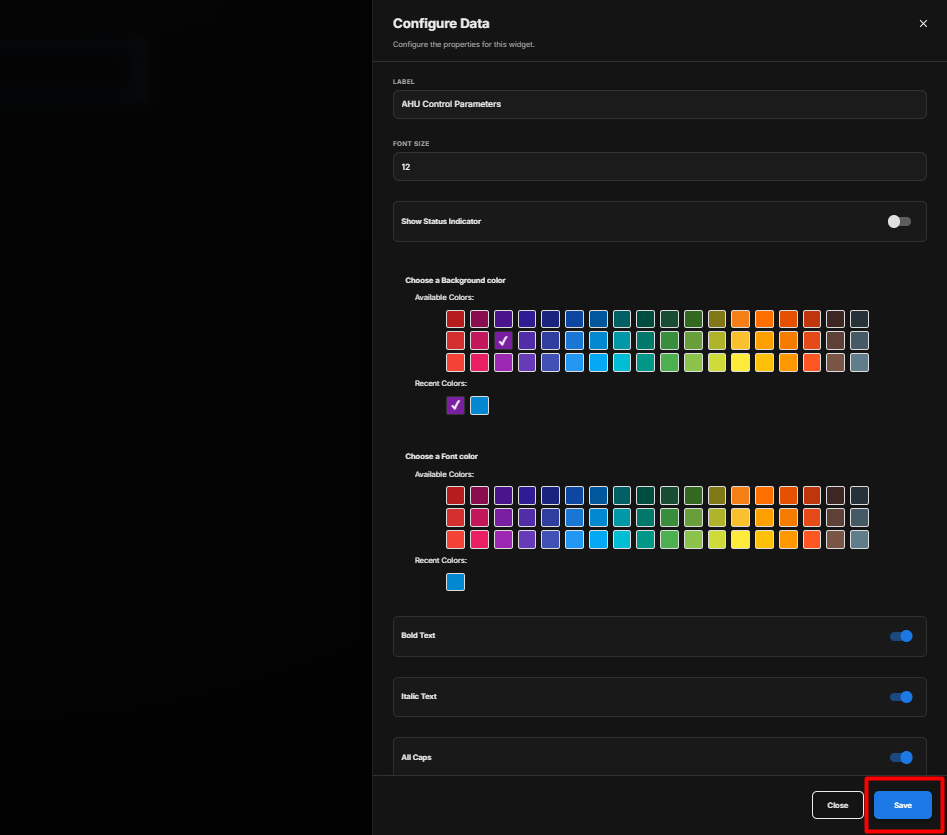
Configure the Label Widget
- Enter the required text in the Label field.
- Enter the required Font Size.
- Enable Show Status Indicator if a status indicator should be displayed with the label.
- Select the required Background Color.
- Select the required Font Color.
- Enable Bold Text if the label should appear in bold.
- Enable Italic Text if the label should appear in italic style.
- Enable All Caps if the label should be displayed in capital letters.
- Review all the configured settings.
- Click Save.
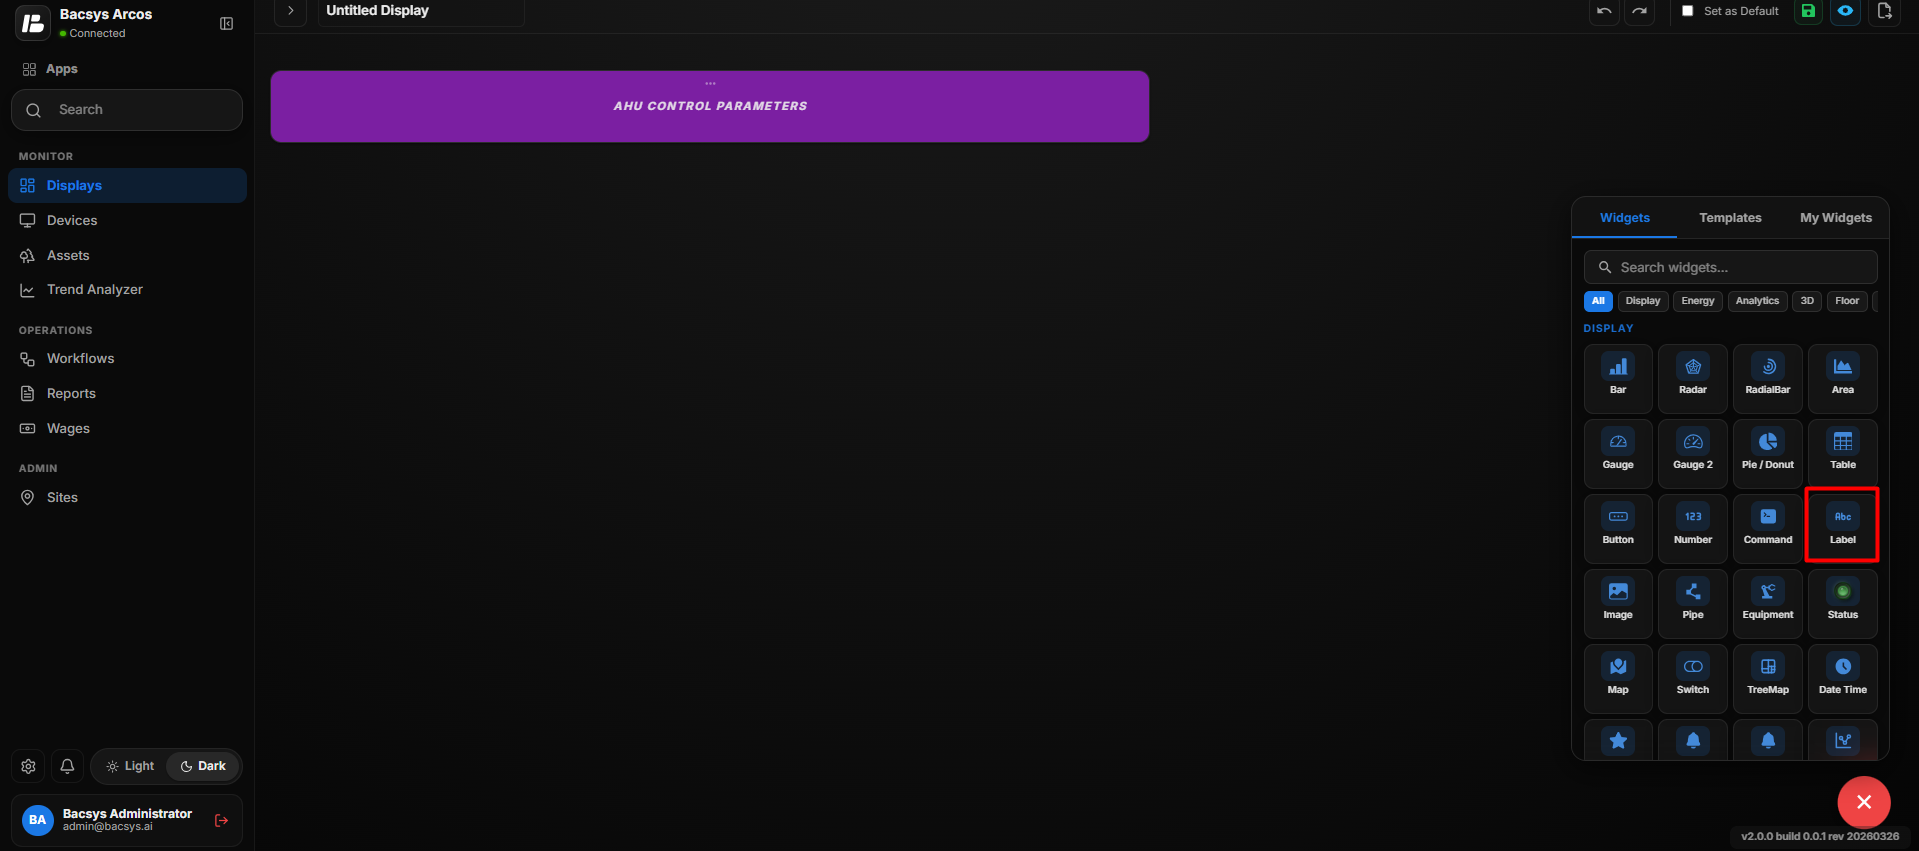
Save the Configuration
After clicking Save, the Label Widget is updated on the display with the configured label text, font, colors, and formatting settings.
Add and Configure the Image Widget
The Image Widget is used to display an image on the display. Users can upload an image, adjust its appearance, associate it with another display page, and configure background and header settings.
Add the Image Widget
- Click the + icon.
- Drag and drop the Image Widget onto the display.
- Select the Image Widget to view the available widget actions:
- Zoom In
- Zoom Out
- Settings
- Remove Widget
- Click Settings to open the Configure Data panel.
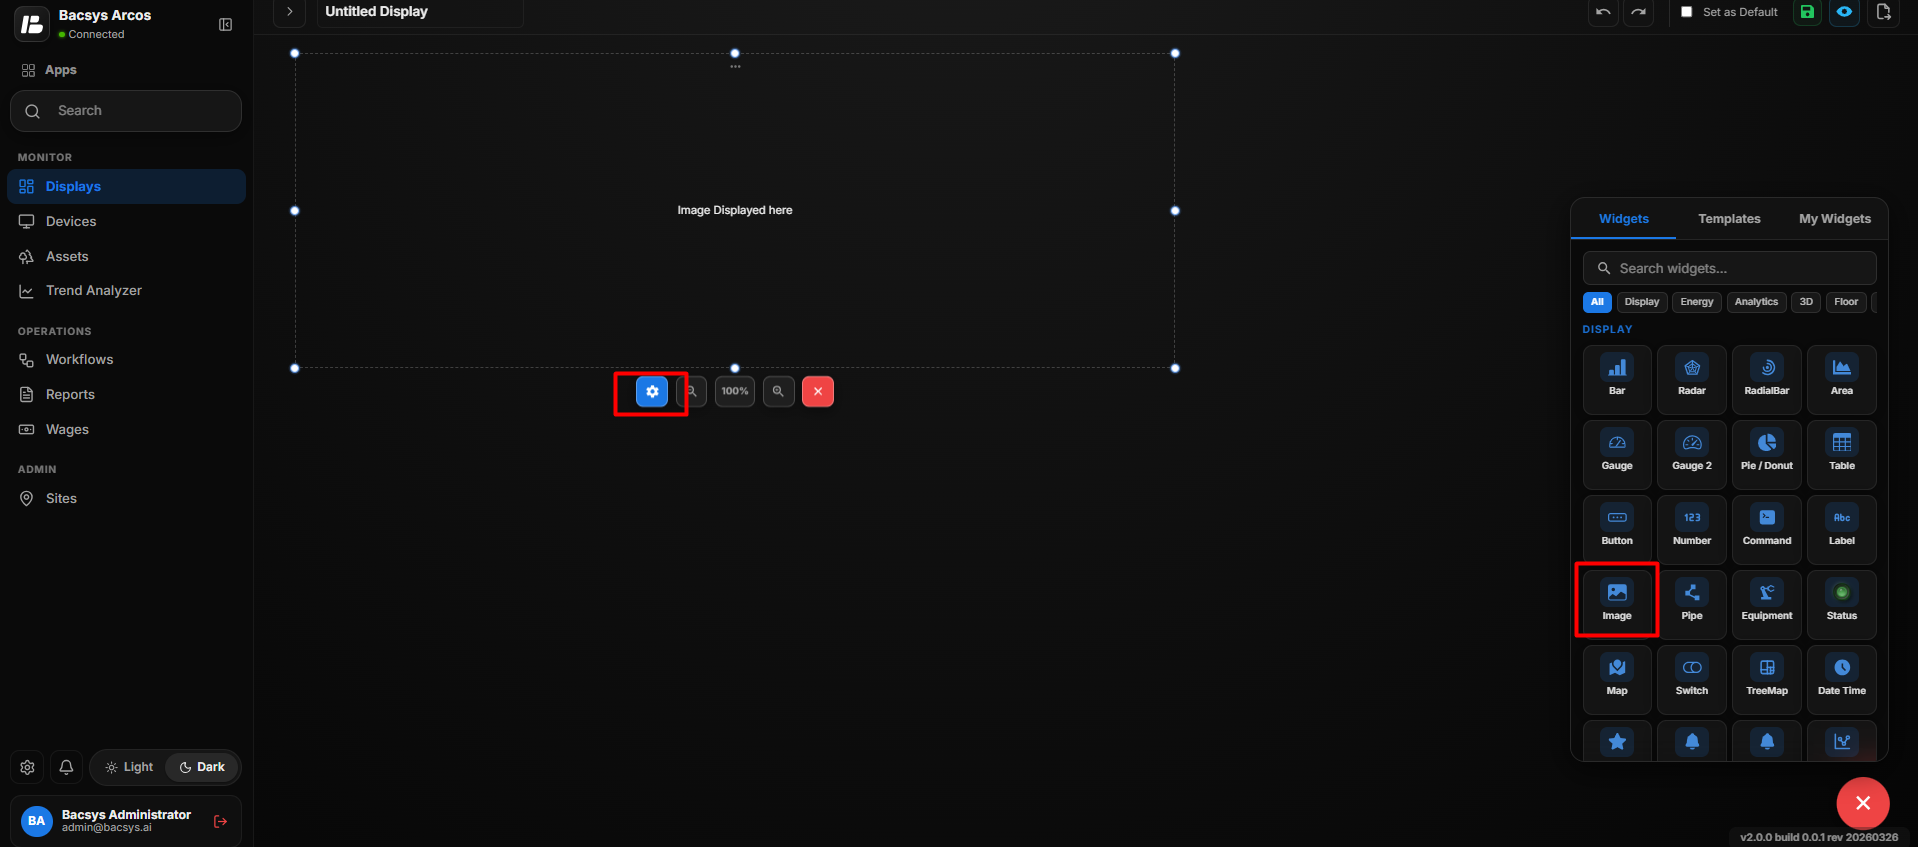
Image Widget Settings
| Option | Description |
|---|---|
| Auto Color Adjust (Invert in Dark Mode) | Enable the toggle to automatically adjust the image colors and invert the image when the application is displayed in dark mode. |
| Drag & Drop Image / Browse Files | Upload an image by dragging and dropping it into the upload area or click Browse Files to select an image from your computer. |
| Fill Image | Enable the toggle to make the uploaded image fill the available widget area. |
| Select Display Page | Select the display page that should be associated with the Image Widget. Use the search field to find the required display. |
| Show Background | Use the toggle button to show or hide the widget background. |
| Hide Header | Use the toggle button to show or hide the widget header. |
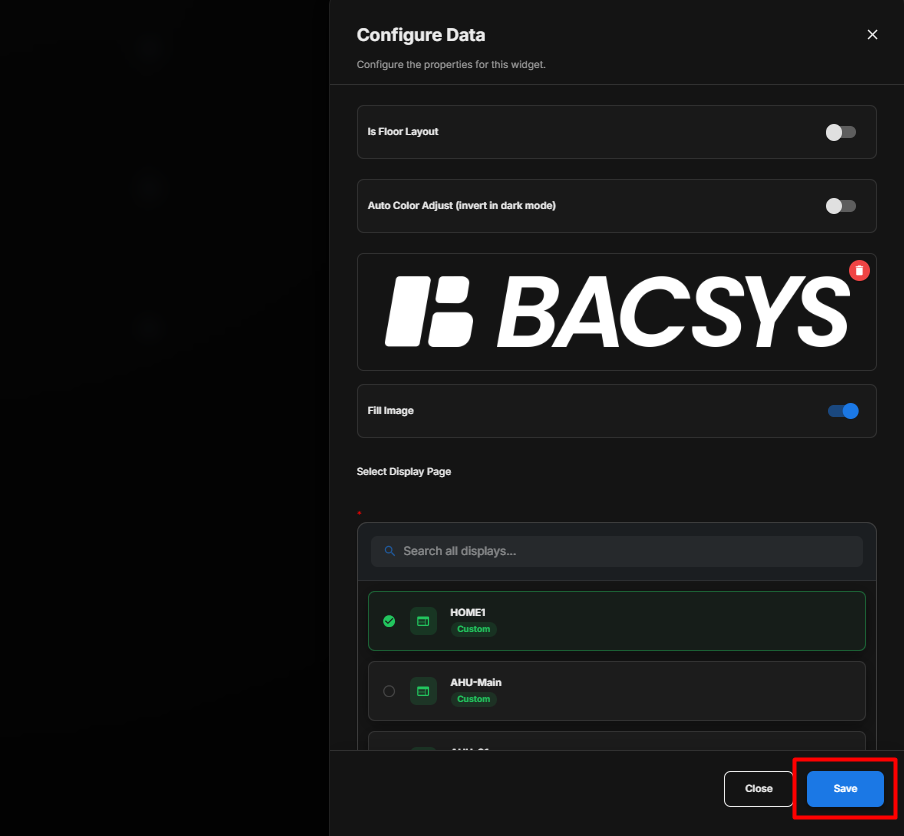
Configure the Image Widget
- Enable Auto Color Adjust (Invert in Dark Mode) if the image should automatically adjust for dark mode.
- Upload an image:
- Drag and drop the image into the upload area, or
- Click Browse Files and select an image.
- Enable Fill Image if the image should fill the widget area.
- Under Select Display Page, search for and select the required display.
- Configure Show Background according to your requirement.
- Configure Hide Header according to your requirement.
- Review all the configured settings.
- Click Save.
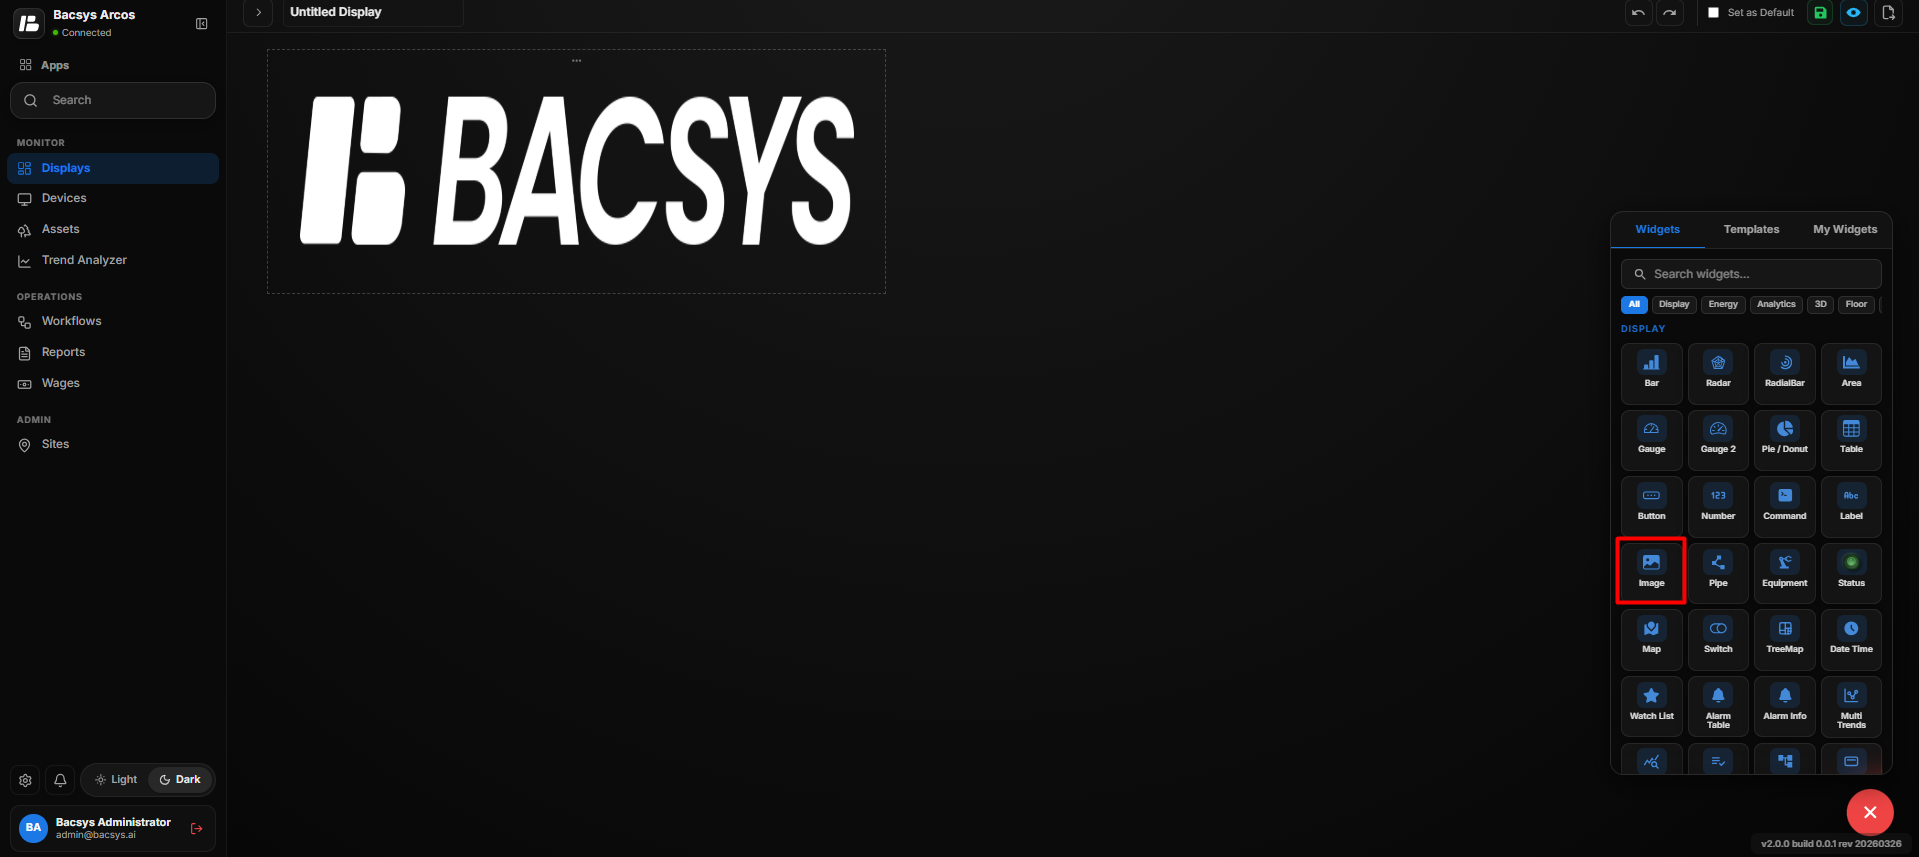
Save the Configuration
After clicking Save, the Image Widget is updated on the display with the uploaded image and configured display settings.
Add and Configure the Pipe Widget
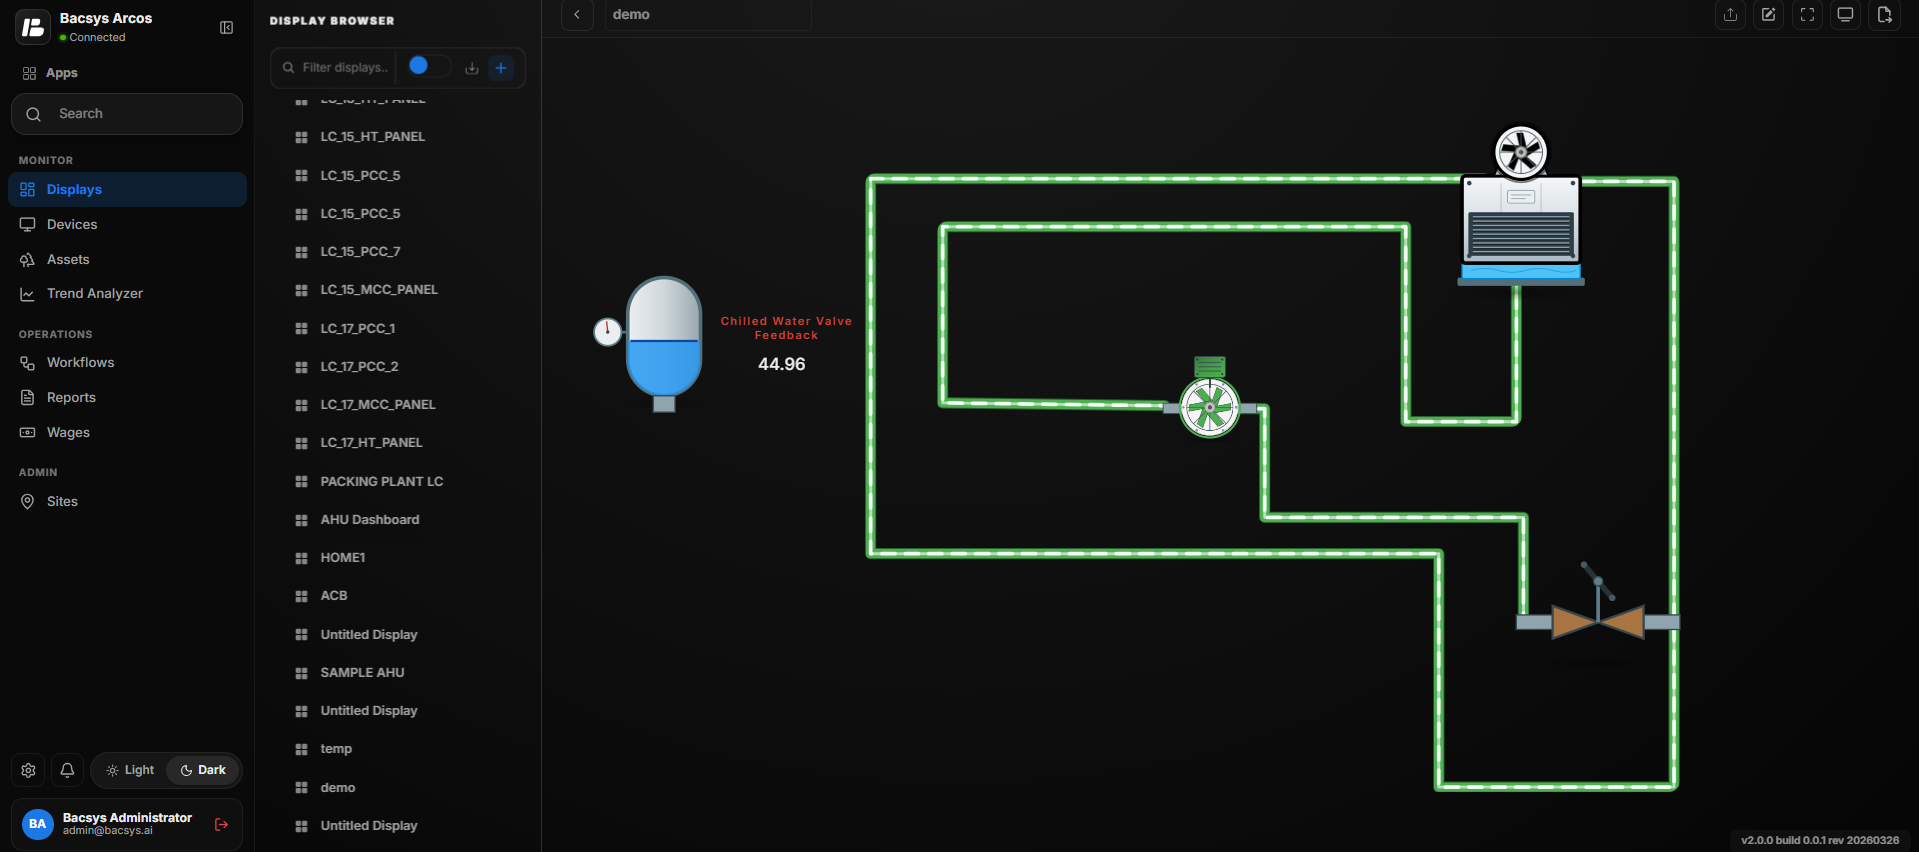
The Pipe Widget is used to draw a pipe path on the display. You can create a pipe by adding multiple points to define its route. After drawing the pipe, you can customize its color, width, flow animation, and appearance.
Draw the Pipe
-
Click the + icon.
-
Drag and drop the Pipe Widget onto the display.
-
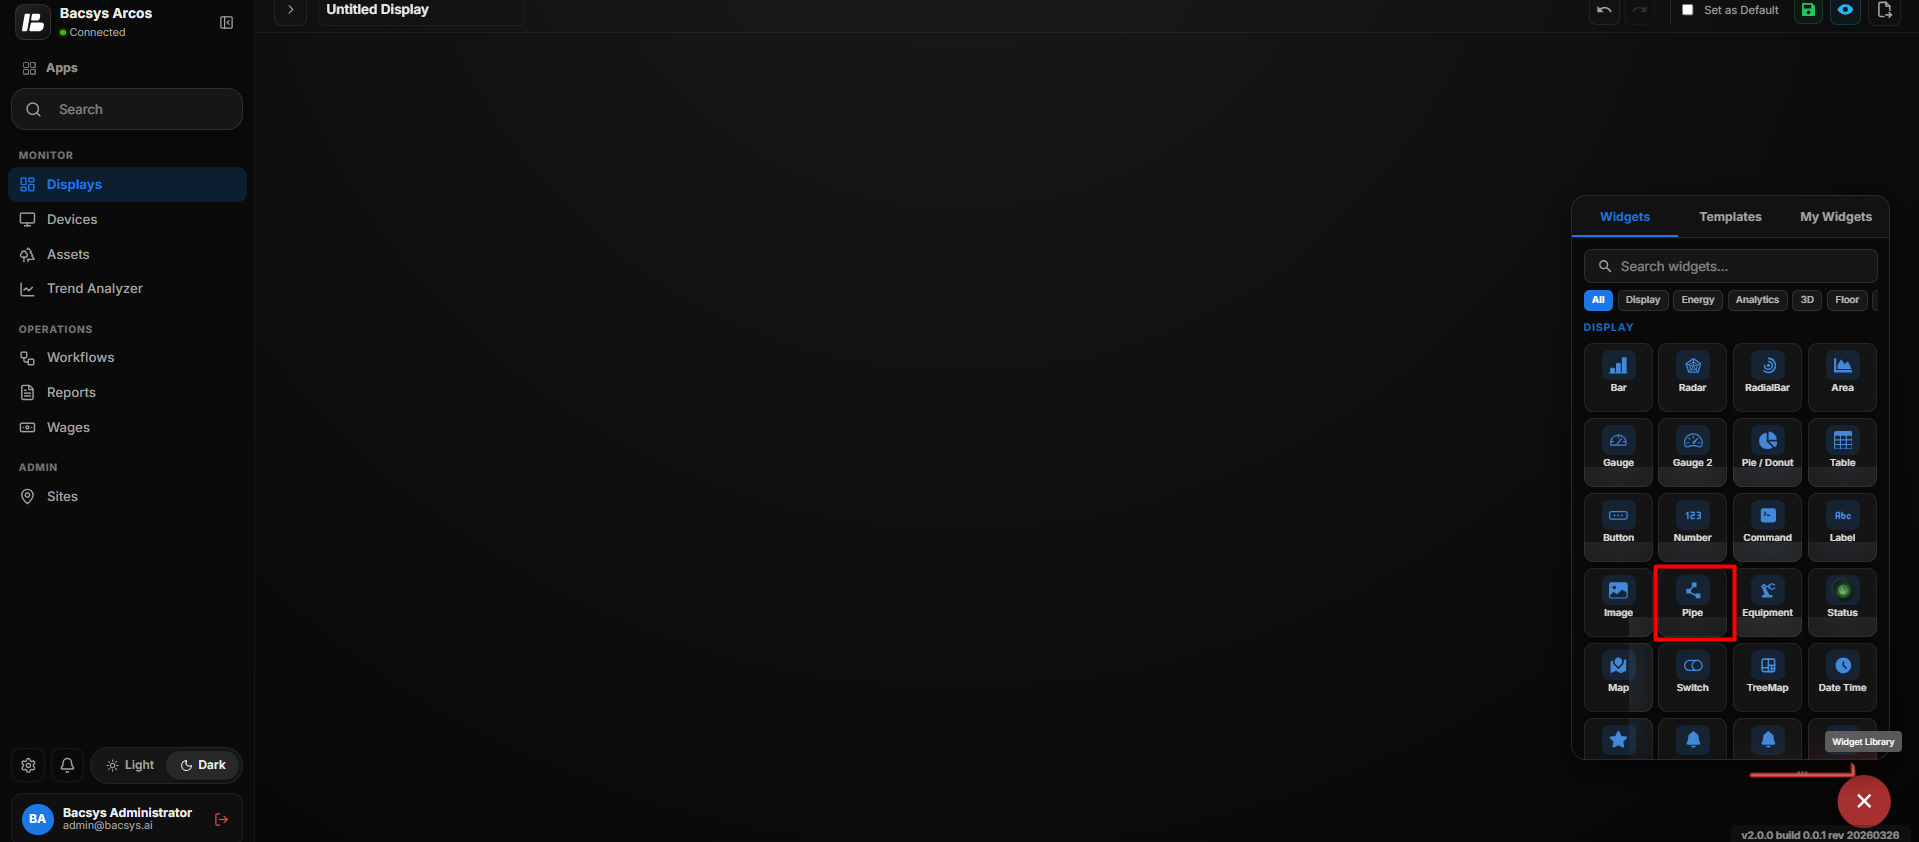
Start drawing the pipe by clicking on the display to add points.
-
Continue clicking at each location where you want the pipe to change direction.
-
While drawing the pipe, the message "Drawing pipe — click to add points, double-click or Enter to finish, Esc to cancel" is displayed.
-
Continue adding points until the required pipe path is complete.
-
Press Enter to finish drawing the pipe.
Note: You can also double-click to finish drawing the pipe. Press Esc to cancel the current pipe drawing.
Select the Pipe
After completing the pipe:
-
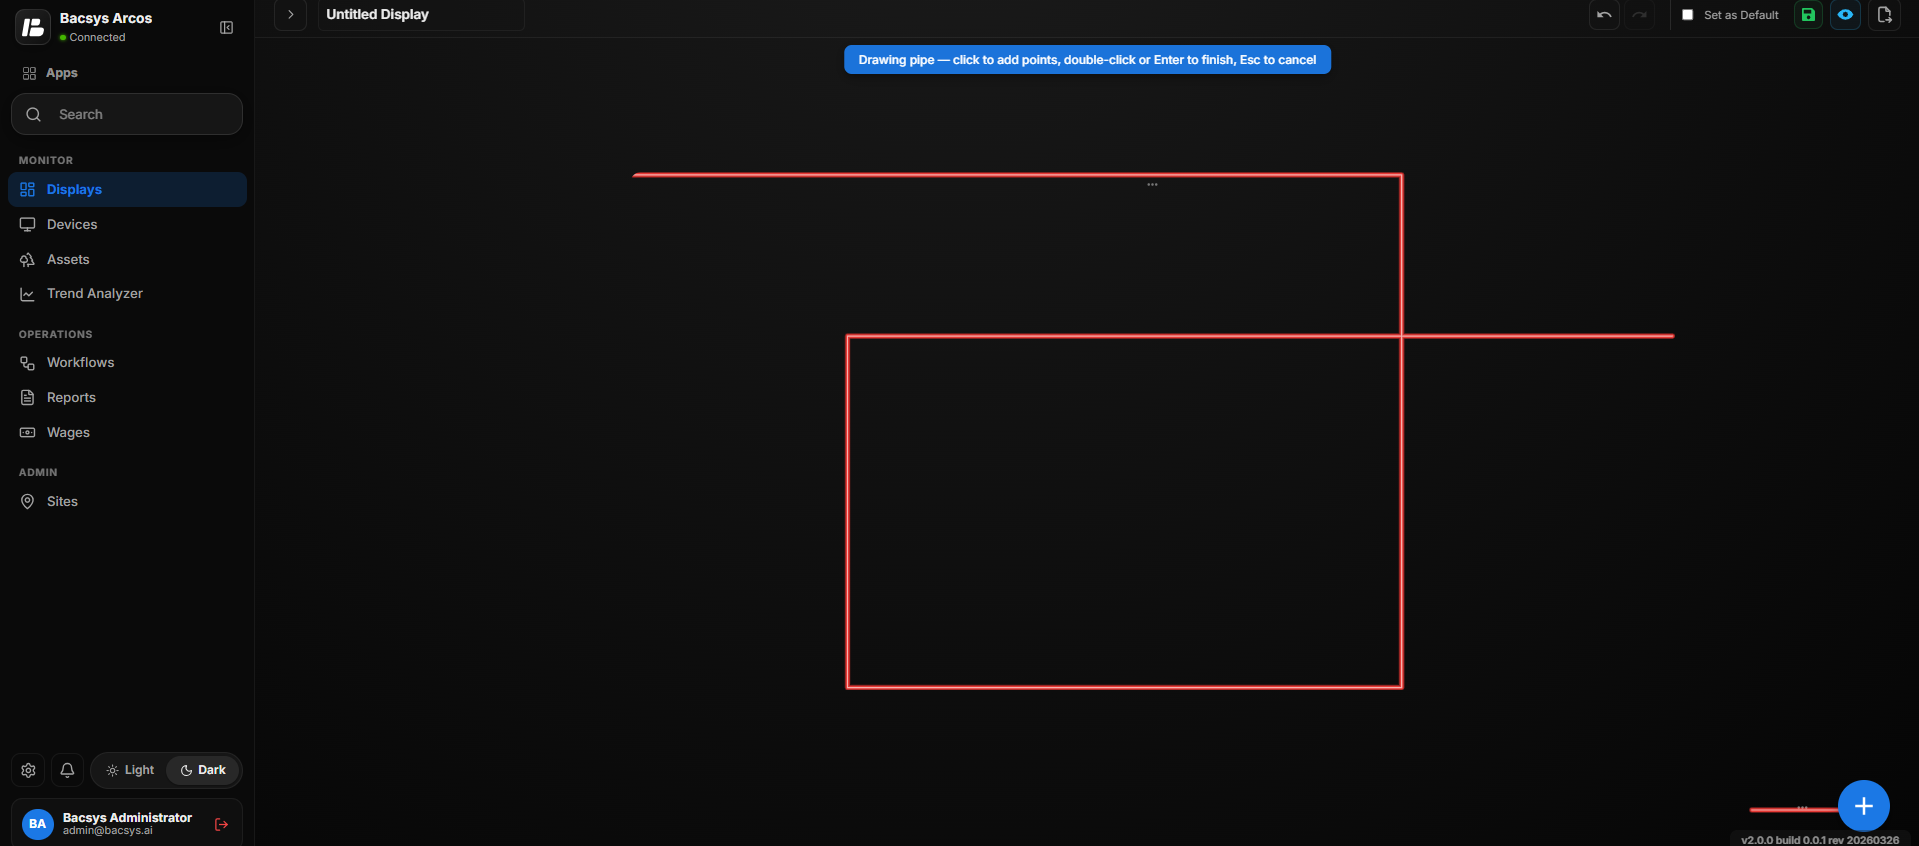
Click the Pipe on the display.
-
The Configure Data panel opens.
-
The pipe configuration settings are displayed.
Pipe Settings
| Option | Description |
|---|---|
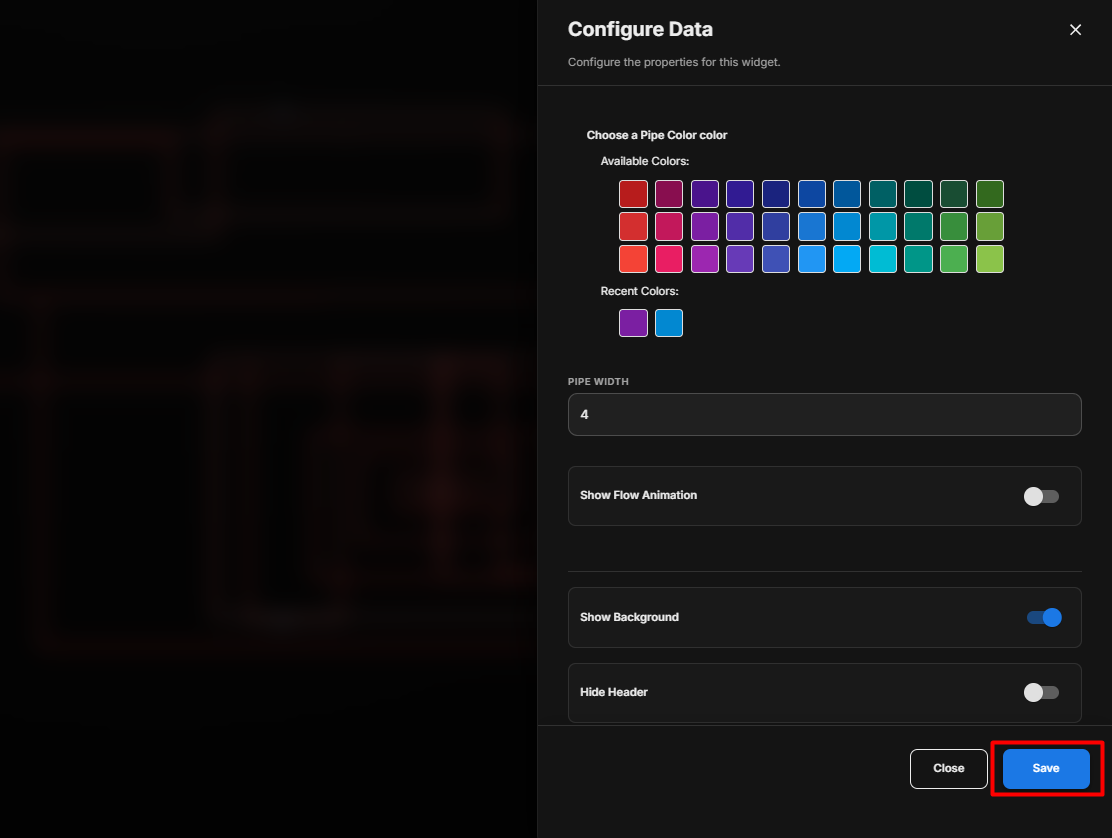
| Choose a Pipe Color | Select the required color for the pipe from the available colors. |
| Pipe Width | Enter the required width of the pipe line. A higher value produces a thicker pipe. |
| Show Flow Animation | Enable the toggle to display an animated flow effect along the pipe. Disable it to display the pipe without flow animation. |
| Show Background | Use the toggle button to show or hide the widget background. |
| Hide Header | Use the toggle button to show or hide the widget header. |
Configure the Pipe
- Select the required Pipe Color.
- Enter the required Pipe Width.
- Enable Show Flow Animation if an animated flow effect is required.
- Configure Show Background according to your requirement.
- Configure Hide Header according to your requirement.
- Review all the configured settings.
- Click Save.
Complete Pipe Workflow
Click the + Icon
       ↓
Drag and Drop the Pipe Widget
       ↓
Start Drawing the Pipe
       ↓
Click to Add Points
       ↓
Add Points to Define the Pipe Path
       ↓
Press Enter / Double-Click to Finish
       ↓
Select the Drawn Pipe
       ↓
Configure Pipe Settings
       ↓
Select Pipe Color
       ↓
Set Pipe Width
       ↓
Enable/Disable Flow Animation
       ↓
Configure Background and Header
       ↓
Click Save
       ↓
Pipe Updated on the Display
Add and Configure the Equipment Widget
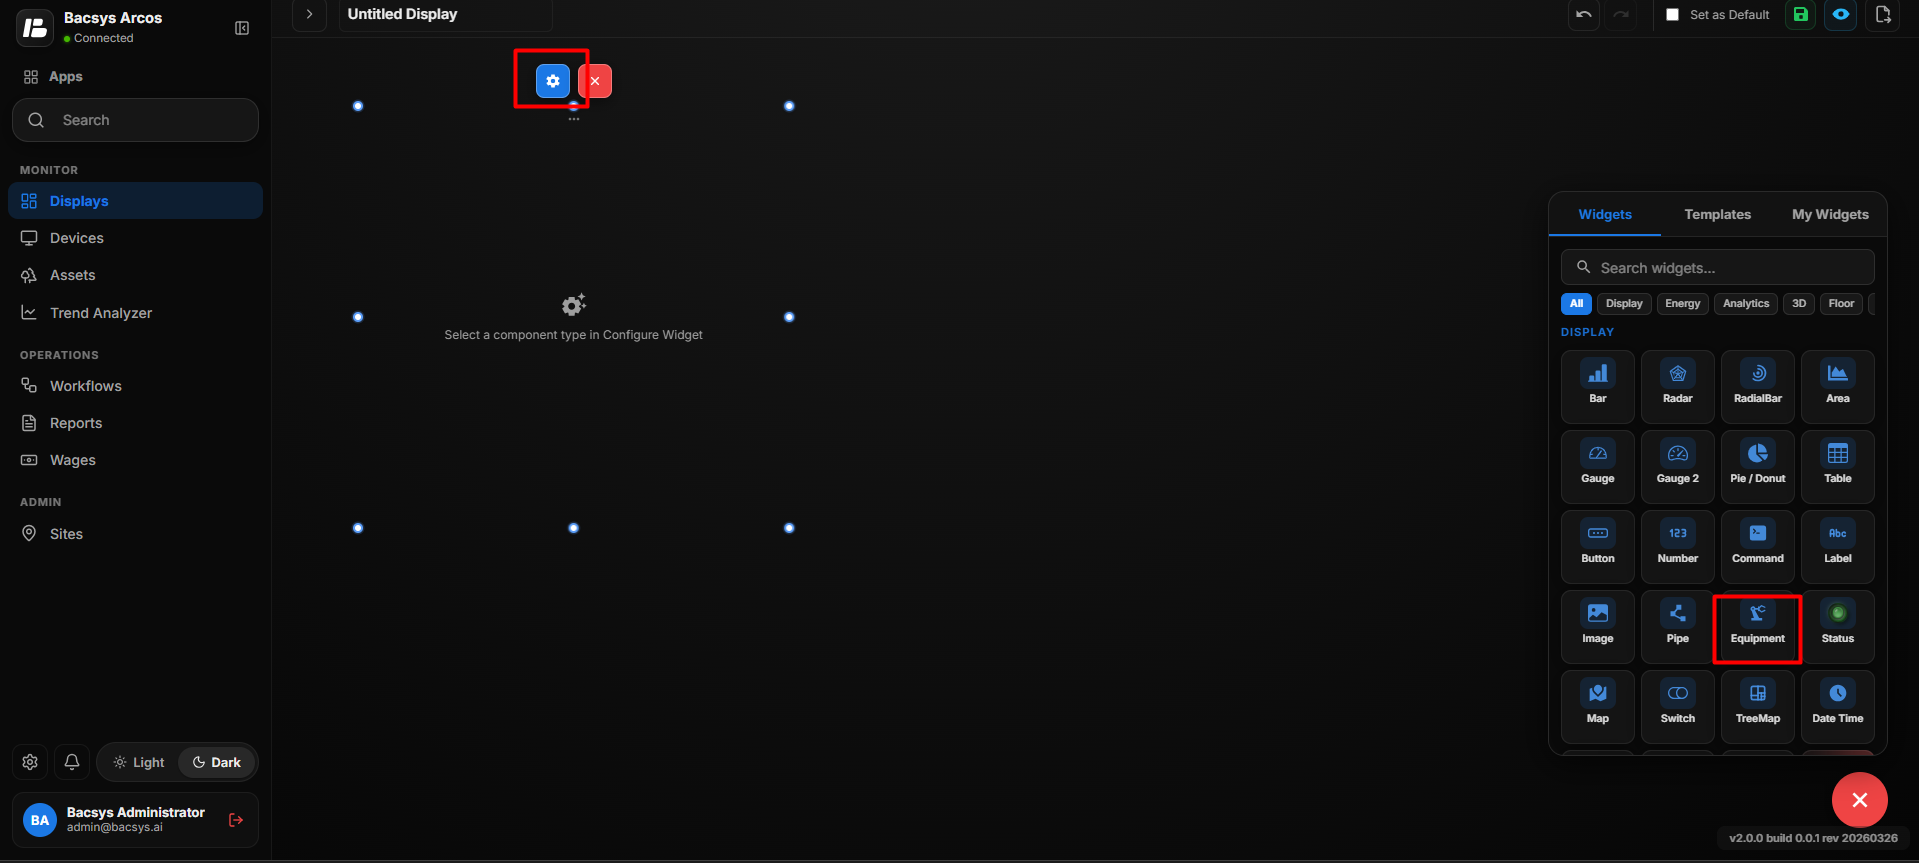
The Equipment Widget is used to visually represent equipment such as pumps, cooling towers, AHUs, fans, chillers, generators, boilers, valves, and other supported equipment. The widget can be connected to a Run Status Point so that the equipment status can be represented visually.
Add the Equipment Widget
- Click the + icon.
- Drag and drop the Equipment Widget onto the display.
- Select the Equipment Widget to view the available widget action:
- Settings
- Click Settings to open the Configure Data panel.
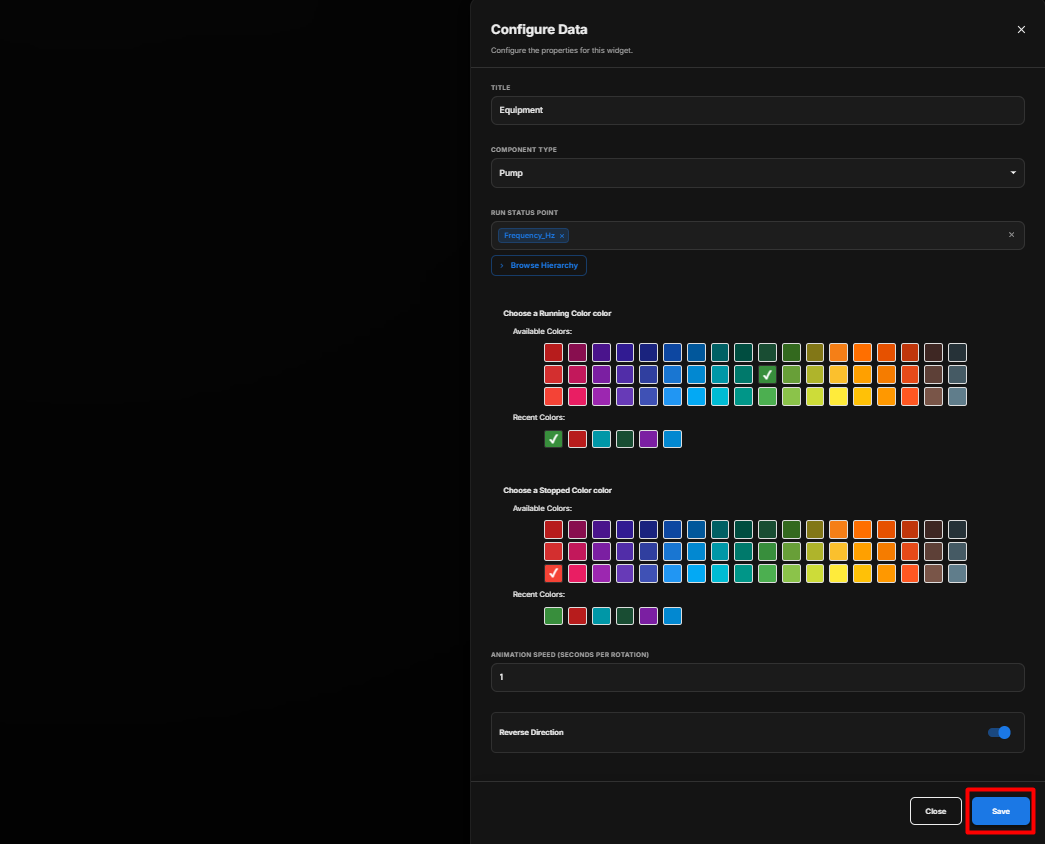
Equipment Widget Settings
| Option | Description |
|---|---|
| Title | Enter an optional label to be displayed above the equipment component. |
| Component Type | Select the type of equipment to display. Available component types include Pump, Cooling Tower, AHU, Fan, Chiller, Generator, Boiler, Valve, Heat Exchanger, Air Separator, and Expansion Tank. |
| Run Status Point | Select the point that provides the running status of the equipment. Click Browse Hierarchy to browse through Network → Device → Point and select the required status point. |
| Running Color | Select the color that represents the equipment when it is in the running state. |
| Stopped Color | Select the color that represents the equipment when it is in the stopped state. |
| Animation Speed (Seconds per Rotation) | Set the speed of the equipment animation by specifying the number of seconds required for one rotation. |
| Reverse Direction | Enable the toggle to reverse the direction of the equipment animation. |
| Show Background | Use the toggle button to show or hide the widget background. |
| Hide Header | Use the toggle button to show or hide the widget header. |
Select the Component Type
Under Component Type, select the equipment that you want to display.
Available component types include:
- Pump
- Cooling Tower
- AHU
- Fan
- Chiller
- Generator
- Boiler
- Valve
- Heat Exchanger
- Air Separator
- Expansion Tank
Configure the Run Status Point
The Run Status Point determines whether the equipment is running or stopped.
- Click Browse Hierarchy.
- Navigate through Network → Device → Point.
- Select the required Run Status Point.
- The selected point is used to determine the equipment's running status.
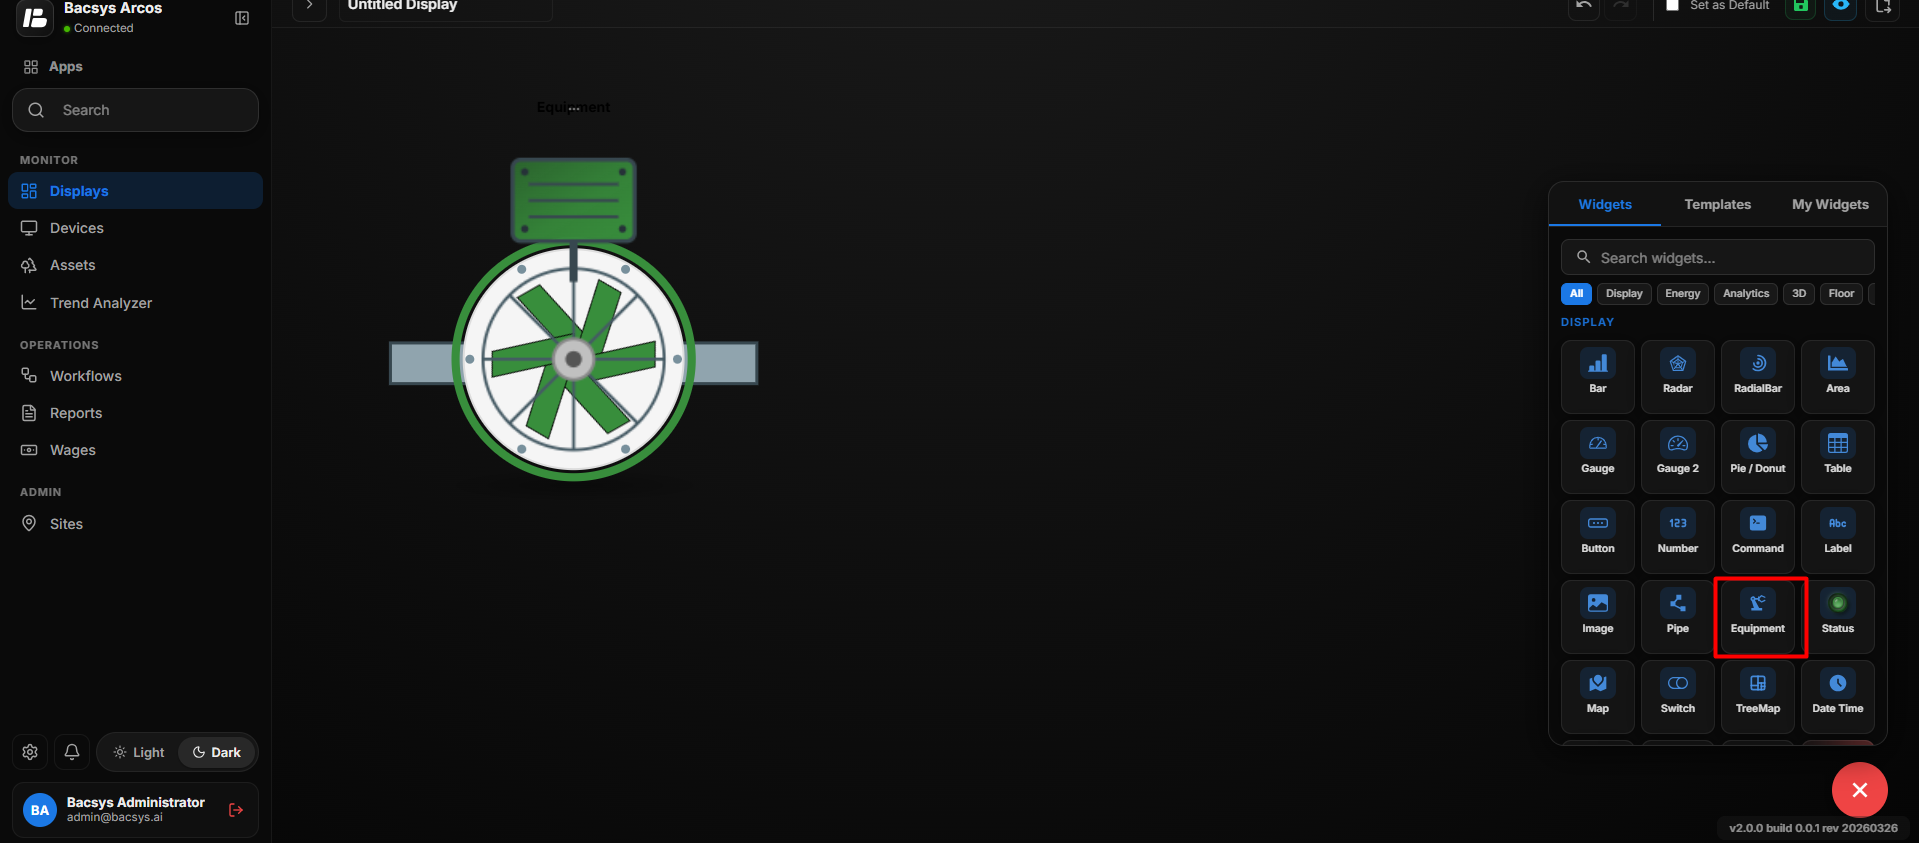
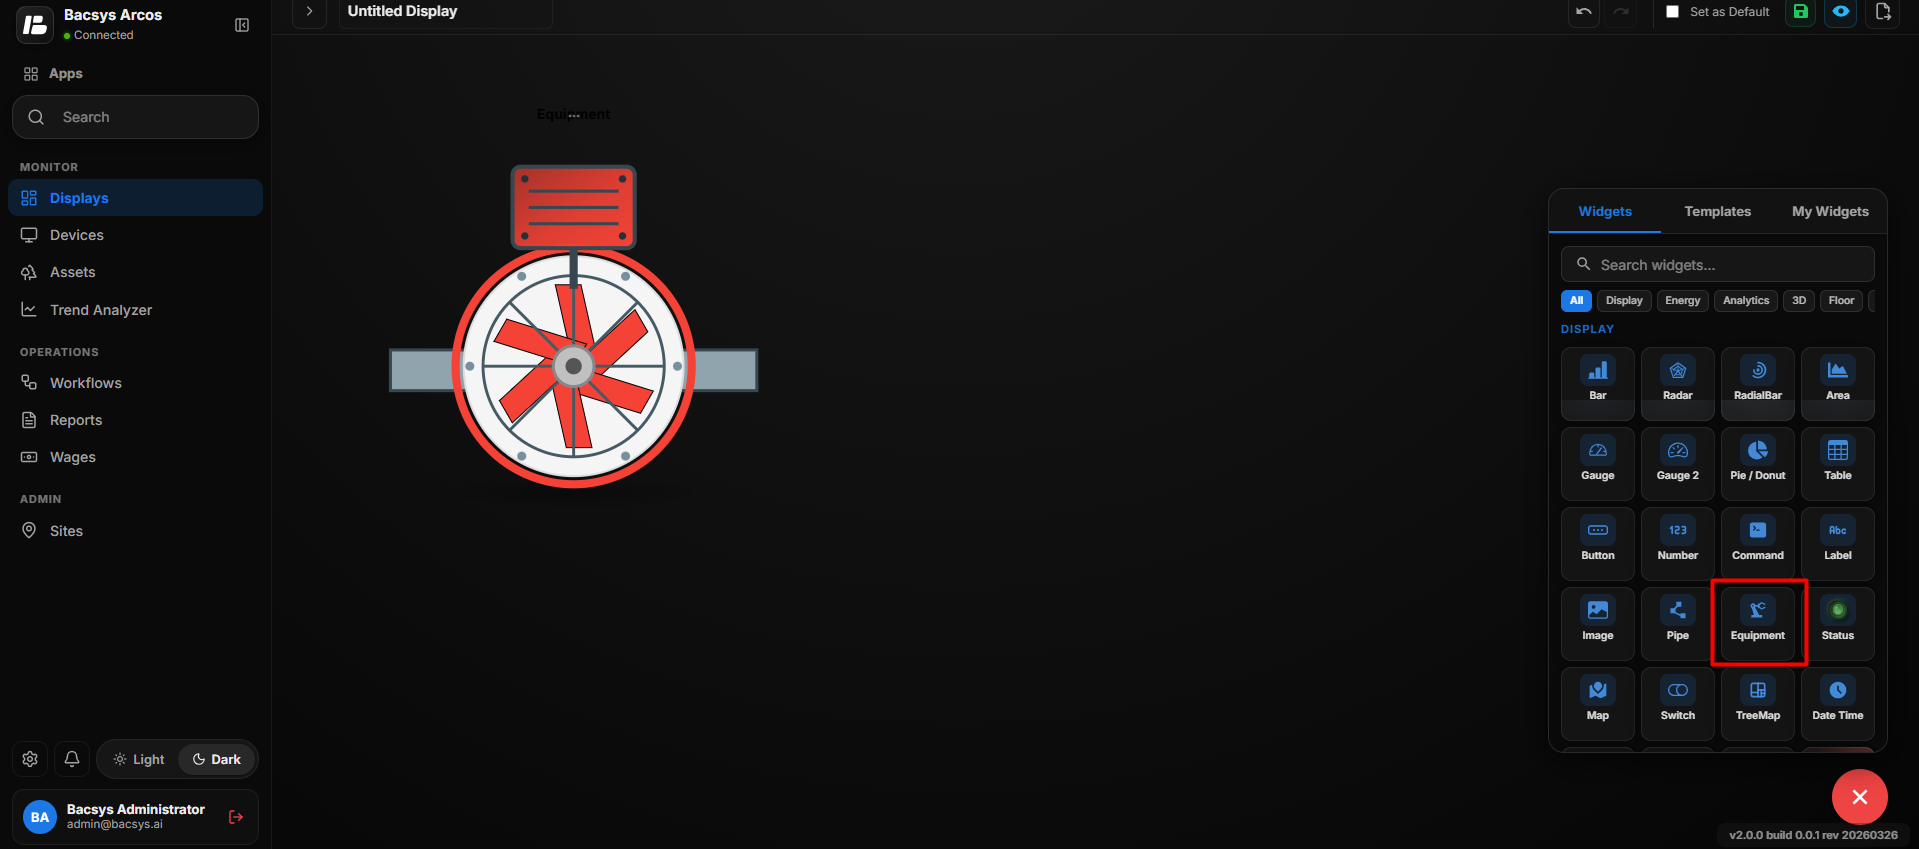
The equipment uses the configured colors to indicate its status:
- Running – The equipment is displayed using the selected Running Color.
- Stopped – The equipment is displayed using the selected Stopped Color.
Configure the Equipment Widget
- Enter an optional Title.
- Under Component Type, select the required equipment.
- Under Run Status Point, click Browse Hierarchy.
- Navigate through Network → Device → Point.
- Select the required Run Status Point.
- Select the required Running Color.
- Select the required Stopped Color.
- Set the Animation Speed (Seconds per Rotation).
- Enable Reverse Direction if the equipment animation should rotate in the opposite direction.
- Configure Show Background according to your requirement.
- Configure Hide Header according to your requirement.
- Review all the configured settings.
- Click Save.
Equipment Status Behavior
| Equipment Status | Widget Behavior |
|---|---|
| Running | The equipment is displayed using the configured Running Color and the animation is shown according to the configured animation settings. |
| Stopped | The equipment is displayed using the configured Stopped Color. |
Save the Configuration
After clicking Save, the Equipment Widget is updated on the display with the selected equipment type, Run Status Point, status colors, animation settings, and appearance configuration.
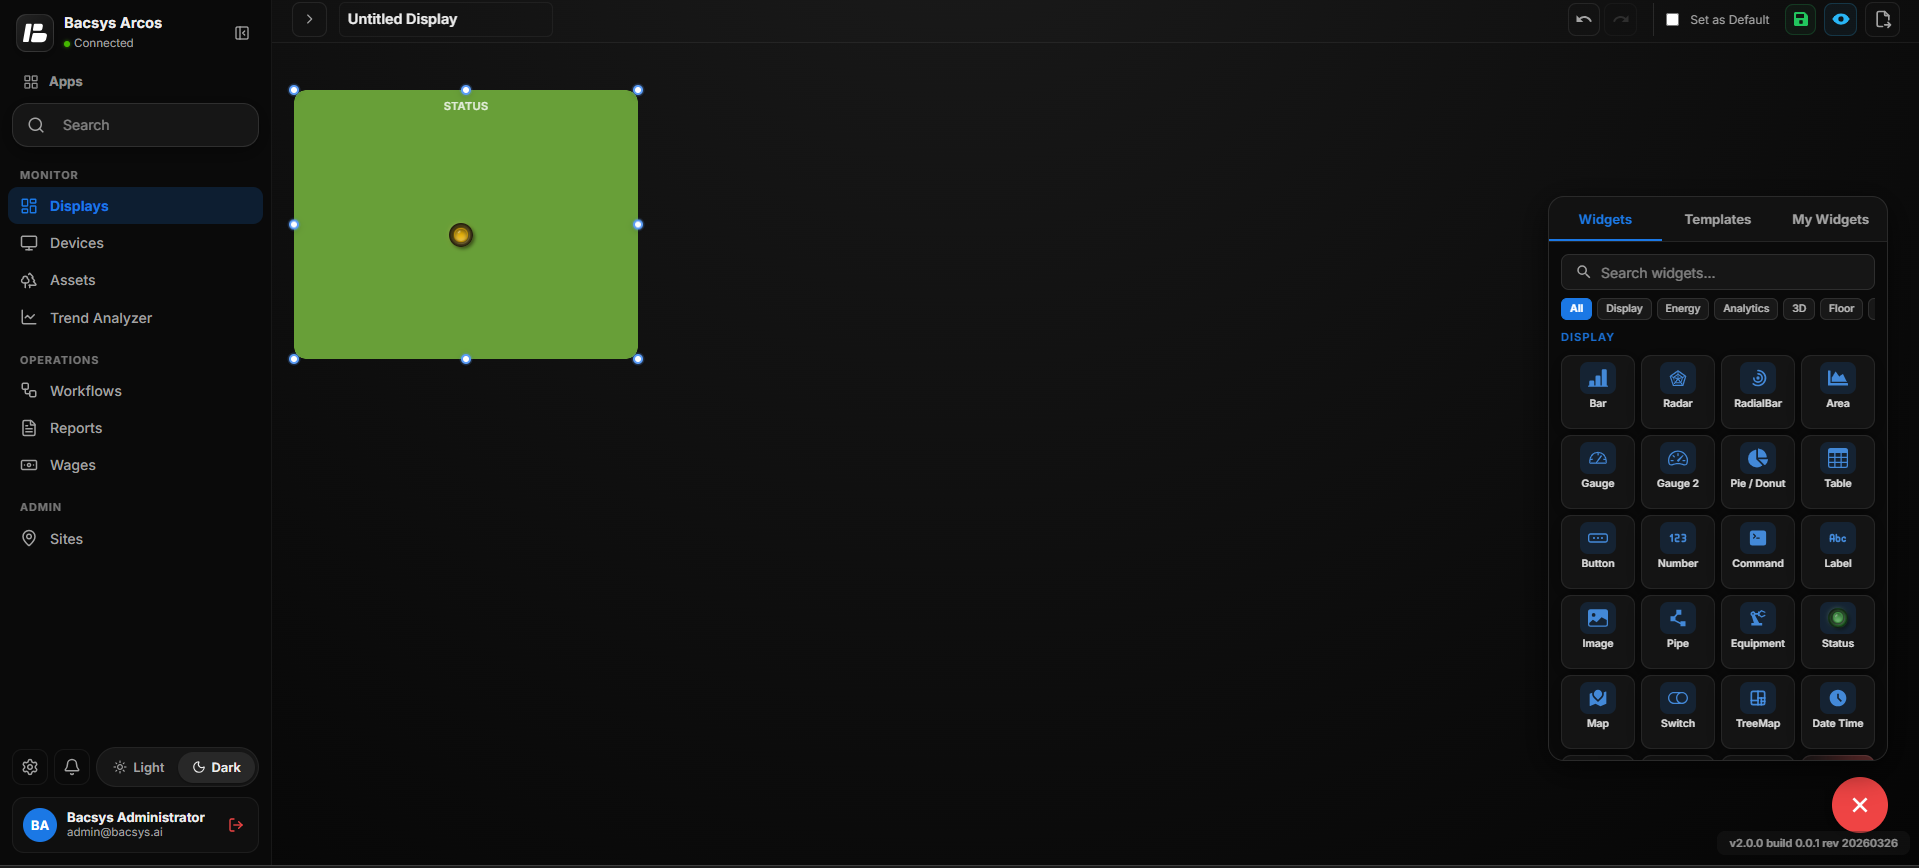
Add and Configure the Status Widget
The Status Widget is used to visually represent the status or phase information of equipment or points. It provides two layout types:
- Single Status – Displays the status of a single primary point.
- RYB Phase – Displays three-phase status information using separate points for R (Red), Y (Yellow), and B (Blue) phases.
Add the Status Widget
- Click the + icon.
- Drag and drop the Status Widget onto the display.
- Select the Status Widget to view the available widget actions:
- Zoom In – Enlarges the widget.
- Zoom Out – Reduces the widget size.
- Settings – Opens the widget configuration options.
- Click Settings to open the Configure Data panel.
- Under Layout Type, select the required layout:
- Single Status
- RYB Phase
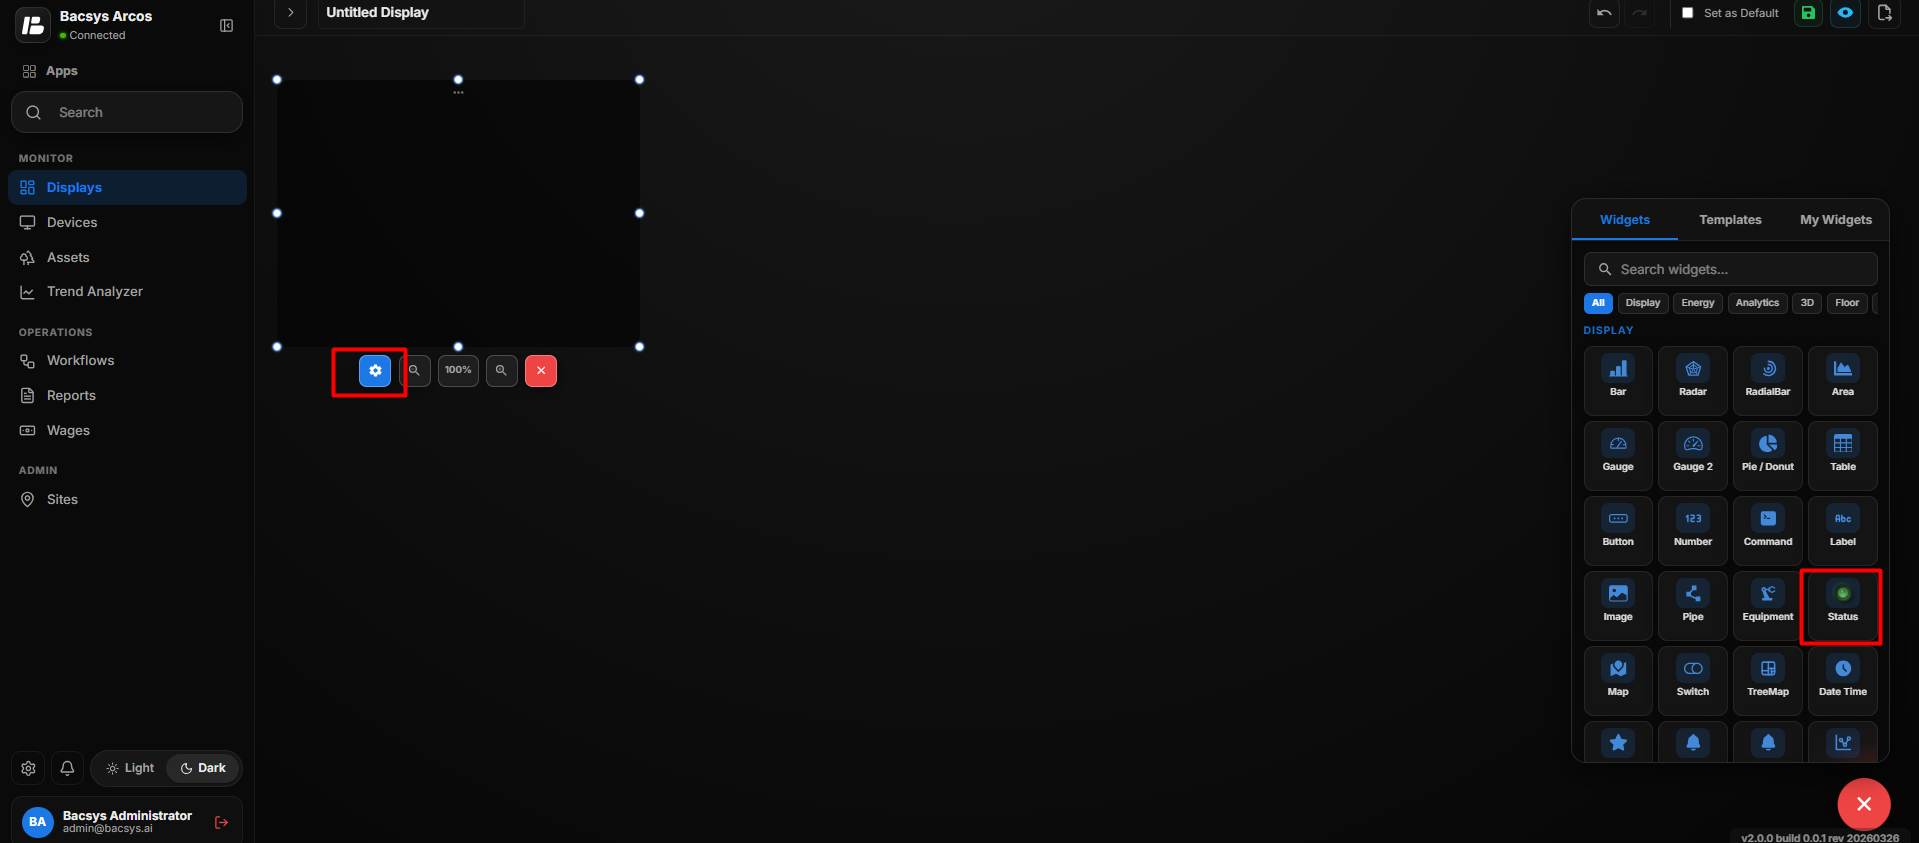
Single Status
Single Status Settings
| Option | Description |
|---|---|
| Title | Enter an optional title to be displayed above the Status Widget. |
| Layout Type | Select Single Status to display the status of a single point. |
| Value Type | Select the type of value used by the status point: Binary (On/Off) or Multistate Input. |
| On/Off Point | Available when Binary (On/Off) is selected. Select the point that provides the On/Off status. |
| Trip Point | Available for the Binary configuration. Select the point used to indicate the trip or fault status. |
| Primary Point | Used when Multistate Input is selected. Select the point that provides the multistate status information. |
| Connected Display | Select the display associated with the Status Widget. |
| Choose a Widget Color | Select the color used for the Status Widget. |
| Transparent Background | Enable the toggle to make the widget background transparent. |
| Bold Labels | Enable the toggle to display status labels in bold. |
| Italic Labels | Enable the toggle to display status labels in italic style. |
| Widget Scale | Set the scale of the Status Widget. |
| Show Background | Use the toggle button to show or hide the widget background. |
| Hide Header | Use the toggle button to show or hide the widget header. |
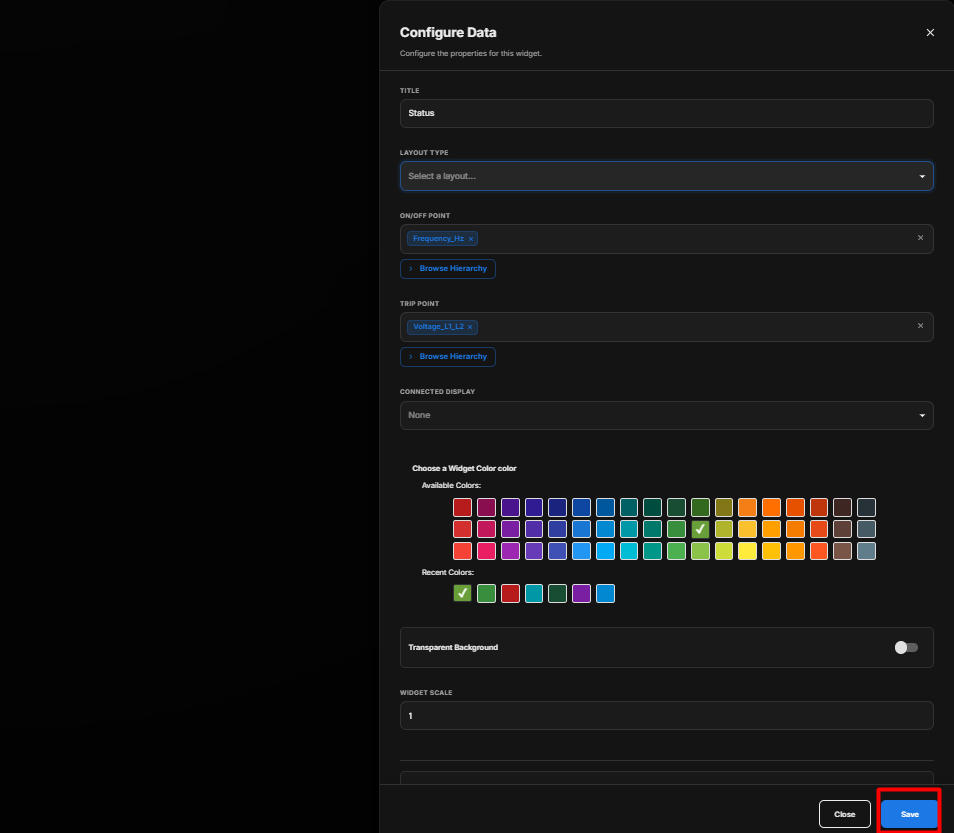
Value Type: Binary (On/Off)
Select Binary (On/Off) when the status point has two states.
- Under Value Type, select Binary (On/Off).
- Under On/Off Point, click Browse Hierarchy.
- Navigate through Network → Device → Point.
- Select the required On/Off point.
- Under Trip Point, click Browse Hierarchy.
- Select the required trip point.
- Select the required Connected Display.
- Select the required Widget Color.
- Configure Transparent Background, Bold Labels, and Italic Labels as required.
- Set the required Widget Scale.
- Configure Show Background and Hide Header as required.
- Review the configuration.
- Click Save.
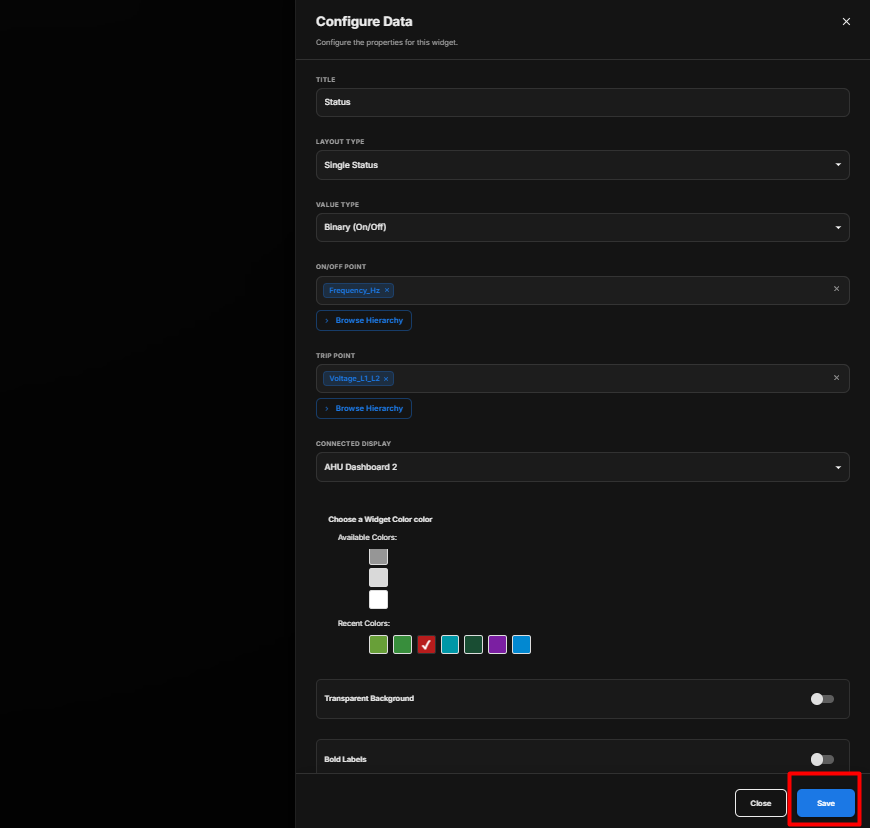
Value Type: Multistate Input
Select Multistate Input when the point can have multiple defined status values.
- Under Value Type, select Multistate Input.
- Under the displayed point selection field, click Browse Hierarchy.
- Navigate through Network → Device → Point.
- Select the required multistate point.
- Select the required Connected Display.
- Select the required Widget Color.
- Configure Transparent Background, Bold Labels, and Italic Labels as required.
- Set the required Widget Scale.
- Configure Show Background and Hide Header as required.
- Review the configuration.
- Click Save.
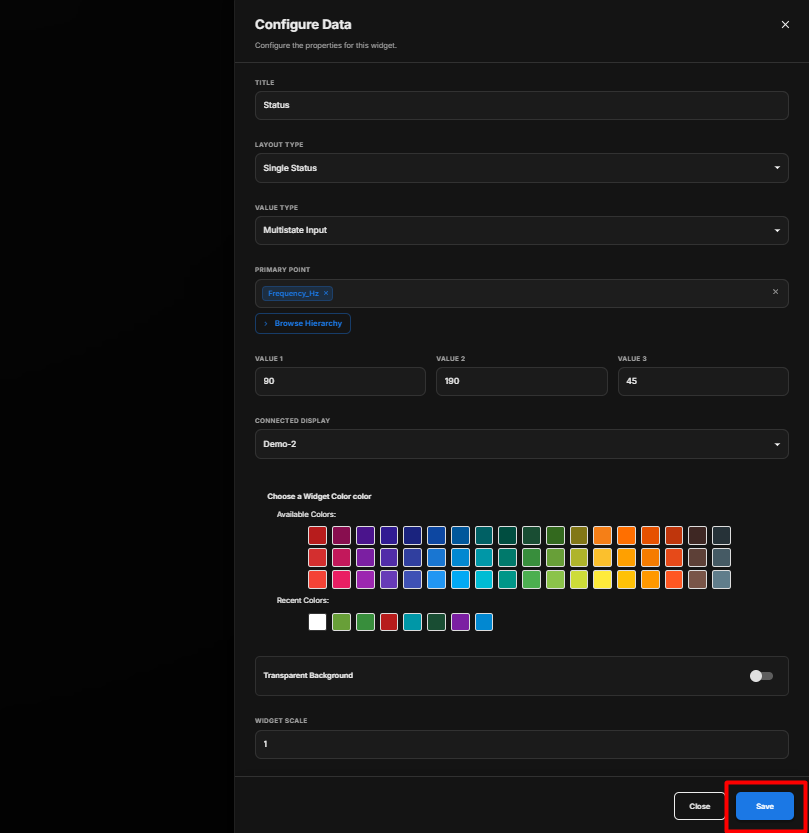
Value Type Summary
| Value Type | Use |
|---|---|
| Binary (On/Off) | Use when the status has two states, such as On/Off. It uses an On/Off Point and Trip Point. |
| Multistate Input | Use when the status point can have multiple defined states. |
Save the Configuration
After clicking Save, the Status Widget is updated on the display according to the selected Layout Type, Value Type, configured points, display, colors, and appearance settings.
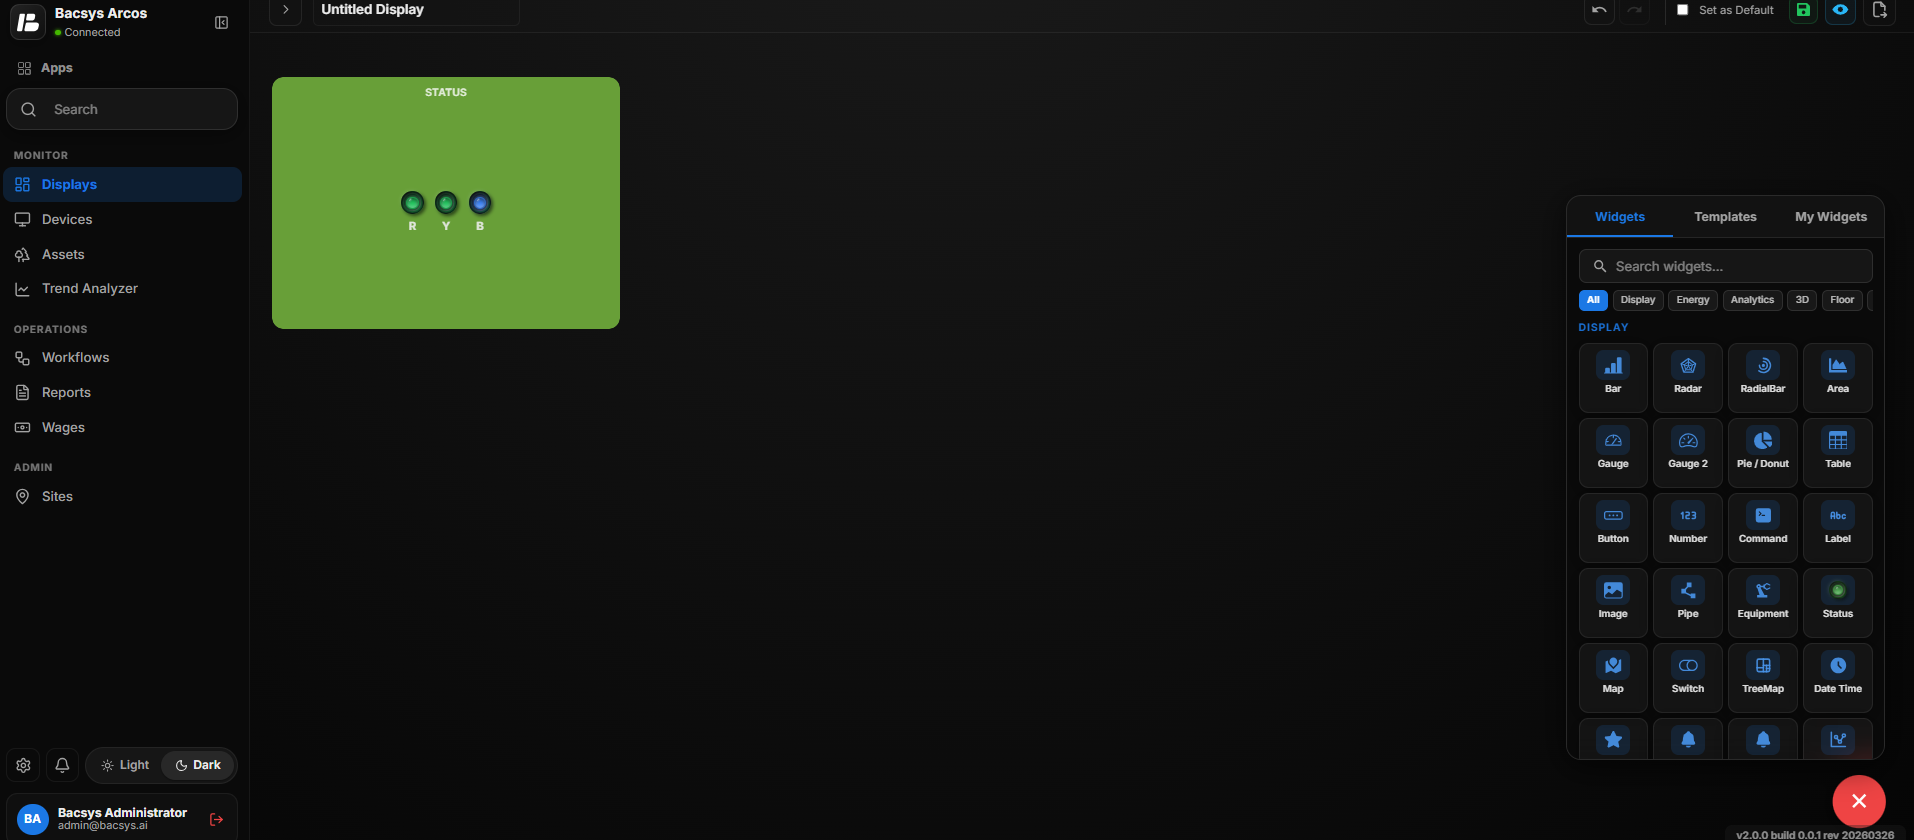
RYB Phase
The RYB Phase layout is used to display the status of three electrical phases:
- R – Red Phase
- Y – Yellow Phase
- B – Blue Phase
Each phase can be connected to a separate point and display.
RYB Phase Settings
| Option | Description |
|---|---|
| Title | Enter an optional label to be displayed above the Status Widget. |
| Layout Type | Select RYB Phase to configure three-phase status information. |
| Point 1 (R) | Select the point associated with the R (Red) phase. |
| Point 2 (Y) | Select the point associated with the Y (Yellow) phase. |
| Point 3 (B) | Select the point associated with the B (Blue) phase. |
| Display (R) | Select the display associated with the R phase. |
| Display (Y) | Select the display associated with the Y phase. |
| Display (B) | Select the display associated with the B phase. |
| Choose a Widget Color | Select the color used for the Status Widget. |
| Transparent Background | Enable the toggle to make the widget background transparent. |
| Widget Scale | Set the scale of the Status Widget. |
| Show Background | Use the toggle button to show or hide the widget background. |
| Hide Header | Use the toggle button to show or hide the widget header. |
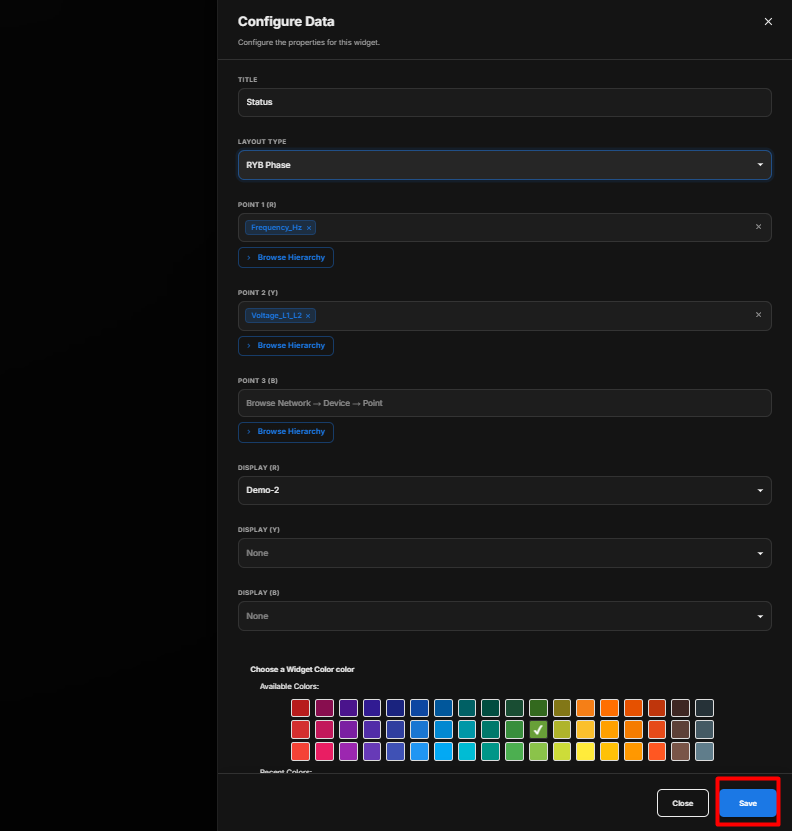
Configure RYB Phase
- Enter the required Title.
- Under Layout Type, select RYB Phase.
- Under Point 1 (R), click Browse Hierarchy and select the point for the R (Red) phase.
- Under Point 2 (Y), click Browse Hierarchy and select the point for the Y (Yellow) phase.
- Under Point 3 (B), click Browse Hierarchy and select the point for the B (Blue) phase.
- Select the required Display (R) for the R phase.
- Select the required Display (Y) for the Y phase.
- Select the required Display (B) for the B phase.
- Select the required Widget Color.
- Enable Transparent Background if required.
- Set the required Widget Scale.
- Configure Show Background according to your requirement.
- Configure Hide Header according to your requirement.
- Review all the configured settings.
- Click Save.
Layout Type Summary
| Layout Type | Purpose | Point Configuration |
|---|---|---|
| Single Status | Displays the status of a single point. | One Primary Point |
| RYB Phase | Displays three-phase status information. | Point 1 (R), Point 2 (Y), and Point 3 (B) |
Save the Configuration
After clicking Save, the Status Widget is updated on the display according to the selected layout type, configured points, displays, colors, scale, and appearance settings.
Add and Configure the Map Widget
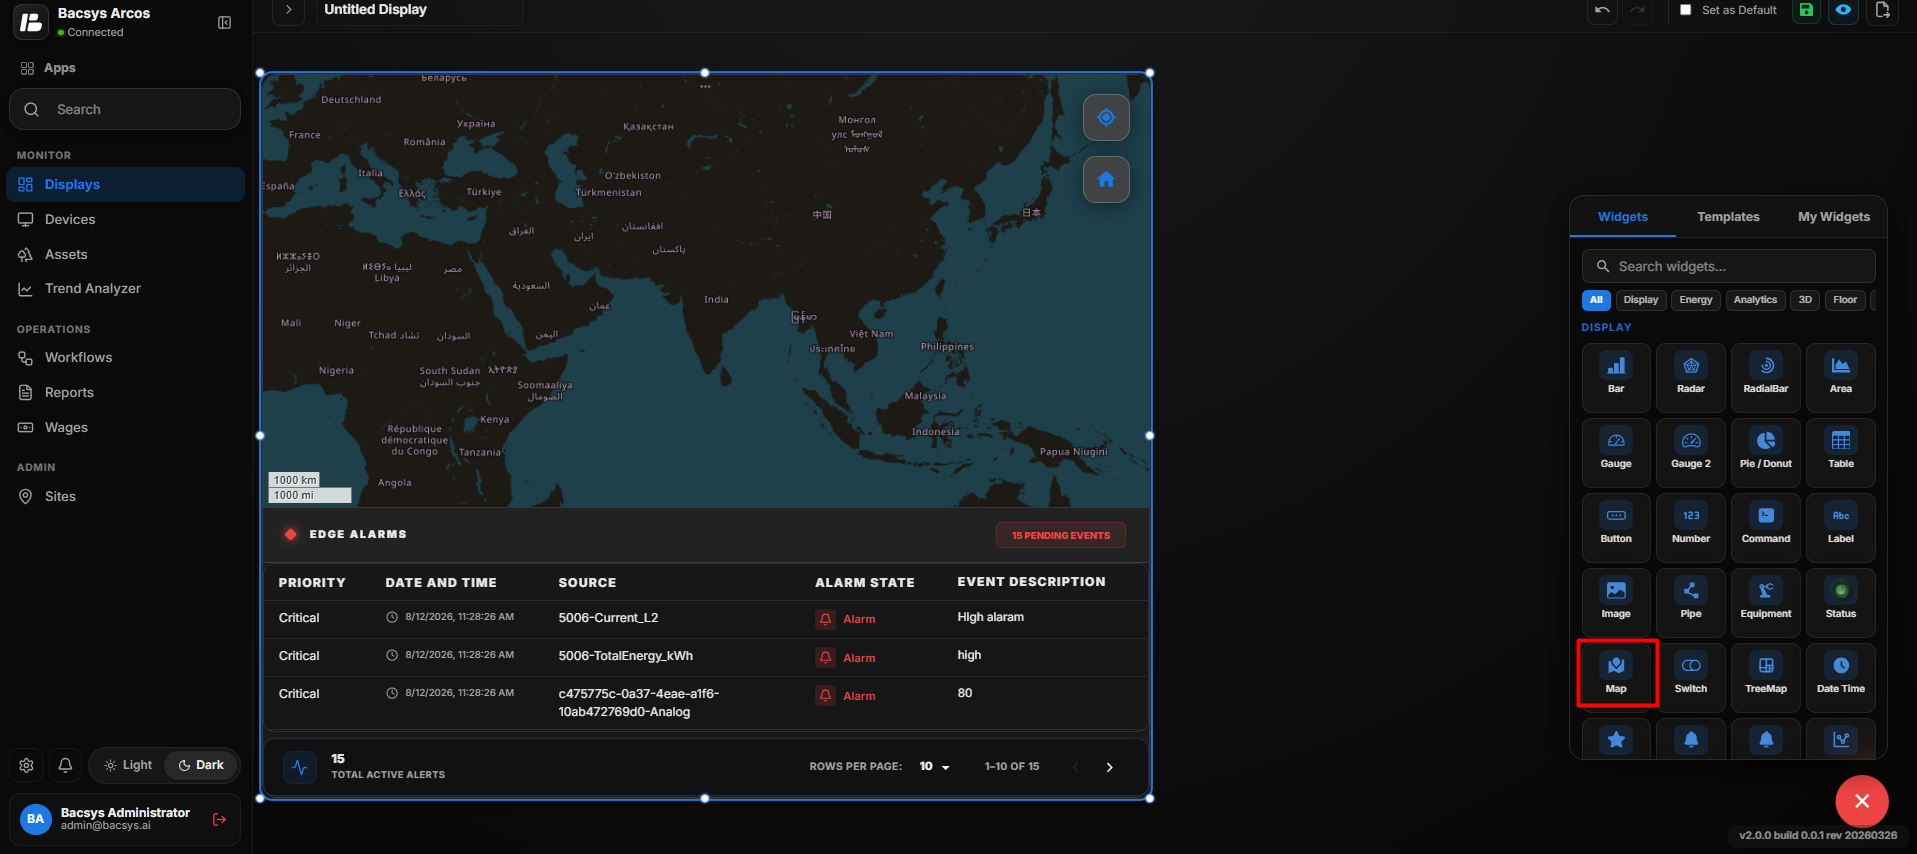
The Map Widget is used to display a geographical map on the display. It also provides an Edge Alarms section that displays active or pending alarm events, allowing users to monitor alarm conditions along with the map.
Add the Map Widget
- Click the + icon.
- Drag and drop the Map Widget onto the display.
- Select the Map Widget to view the available widget actions:
- Zoom In
- Zoom Out
- Settings
- Remove Widget
- Click Settings to open the Configure Data panel.
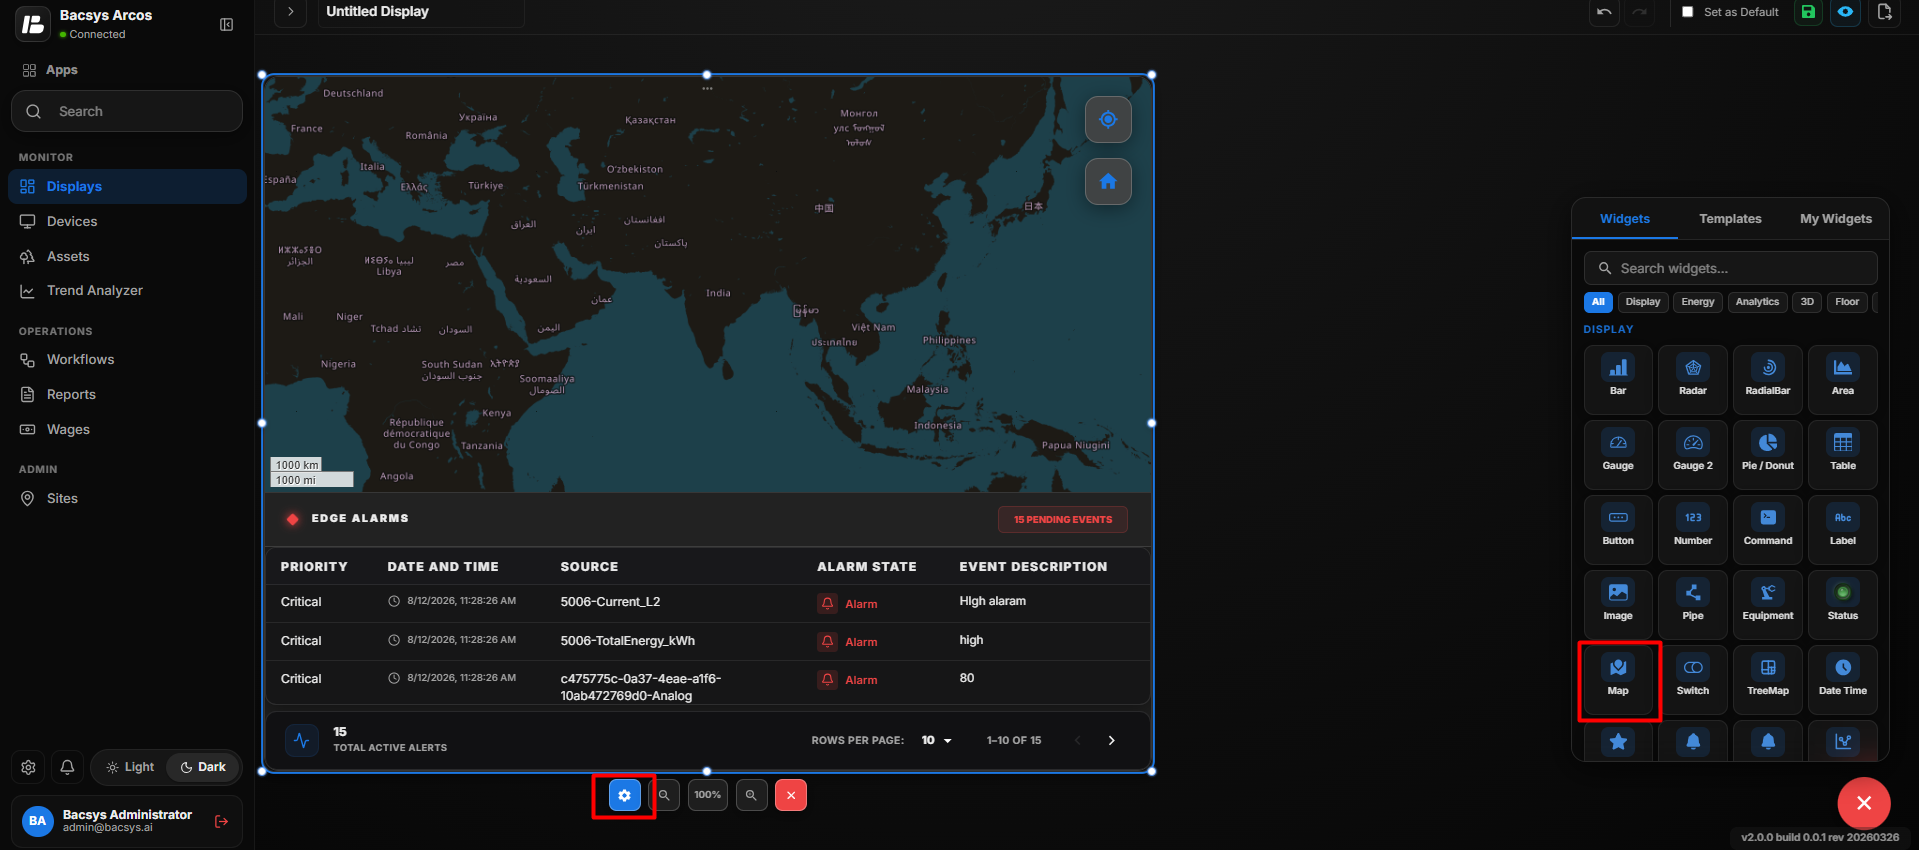
Map Widget Display
After dragging and dropping the Map Widget onto the display, the widget displays:
- A geographical map.
- Map navigation controls such as Location and Home.
- A map scale showing the approximate distance on the map.
- An Edge Alarms section below the map.
- The Edge Alarms section displays active or pending alarm events.
Edge Alarms
The Edge Alarms section provides an overview of alarm events associated with the system.
The alarm table can display information such as:
| Column | Description |
|---|---|
| Priority | Indicates the priority level of the alarm, such as Critical. |
| Date and Time | Displays the date and time when the alarm event occurred. |
| Source | Identifies the point, device, or source that generated the alarm. |
| Alarm State | Displays the current state of the alarm, such as Alarm. |
| Event Description | Displays the description or value associated with the alarm event. |
The widget also displays the Total Active Alerts count and allows users to navigate through multiple alarm records using pagination.
Map Widget Settings
| Option | Description |
|---|---|
| Title | Enter a title for the Map Widget. The title identifies the information displayed by the widget. |
| Subtitle | Enter an optional subtitle to provide additional information or context about the map. |
| Select Point | Select the point associated with the map data. Click Browse Hierarchy to browse through Network → Device → Point and select the required point. |
| Poll Frequency (Seconds) | Specify how frequently the widget retrieves or refreshes the selected point information. |
| Show Background | Use the toggle button to show or hide the widget background. |
| Hide Header | Use the toggle button to show or hide the widget header, including the title and subtitle. |
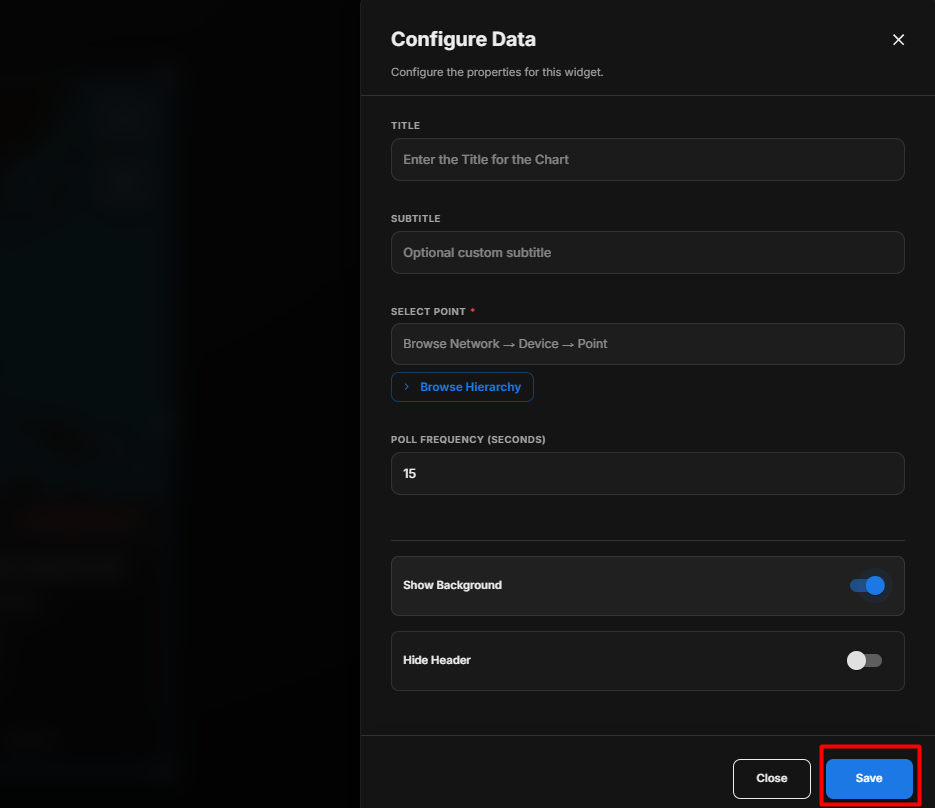
Configure the Map Widget
- Enter the required Title.
- Enter an optional Subtitle.
- Under Select Point, click Browse Hierarchy.
- Navigate through Network → Device → Point.
- Select the required point.
- Set the required Poll Frequency (Seconds).
- Configure Show Background according to your requirement.
- Configure Hide Header according to your requirement.
- Review all the configured settings.
- Click Save.
Map Controls
| Control | Description |
|---|---|
| Location | Allows the user to access the map location control. |
| Home | Returns the map to its default view. |
| Map Scale | Displays the approximate distance represented by the current map view. |
Alarm Monitoring
The Edge Alarms section allows users to monitor active alarms directly from the Map Widget.
For each alarm, users can view the priority, date and time, source, alarm state, and event description. The widget also displays the number of active alerts and provides pagination when multiple alarms are available.
Save the Configuration
After clicking Save, the Map Widget is updated on the display with the configured map settings and the available Edge Alarms information.
Add and Configure the Switch Widget
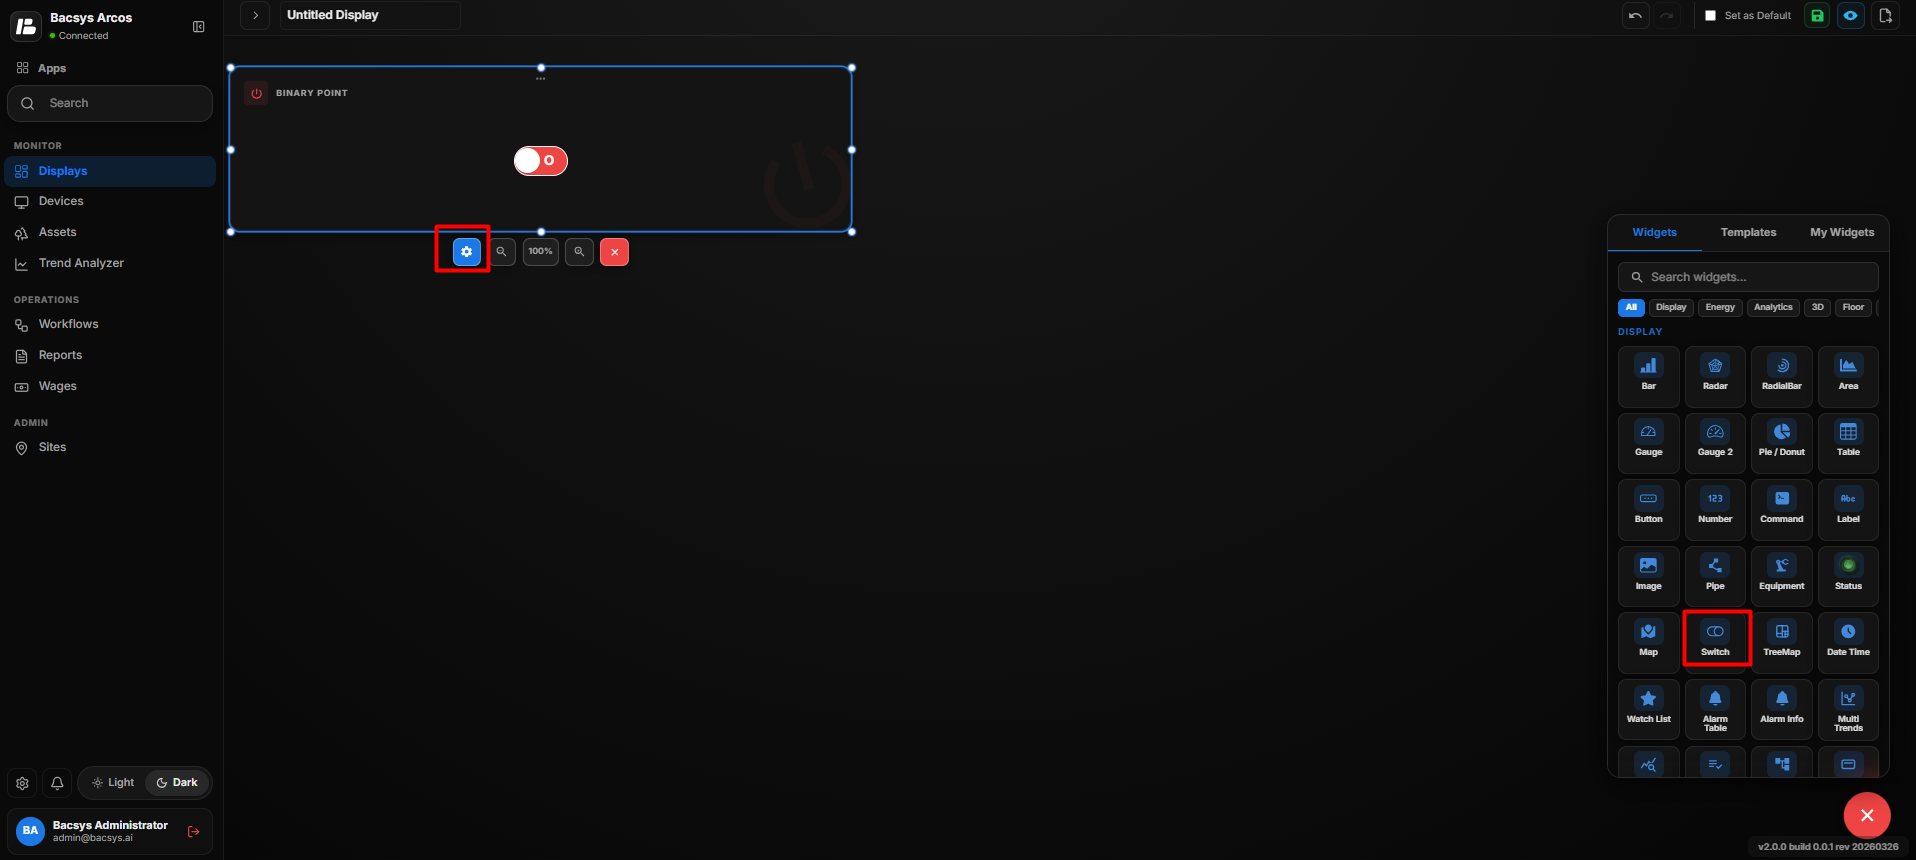
The Switch Widget is used to display and control a point with a True/False or On/Off type of value. It allows users to select a point, configure the values displayed for the True and False states, and optionally enable write functionality to control the selected point.
Add the Switch Widget
- Click the + icon.
- Drag and drop the Switch Widget onto the display.
- Select the Switch Widget to view the available widget actions:
- Zoom In
- Zoom Out
- Settings
- Remove Widget
- Click Settings to open the Configure Data panel.
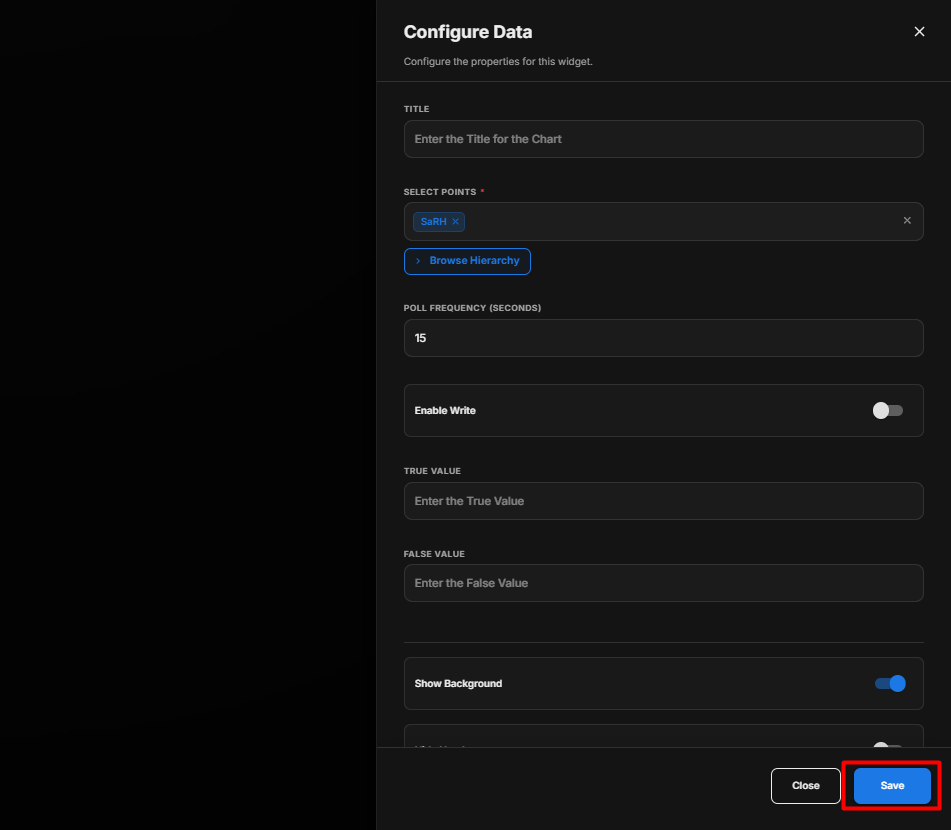
Switch Widget Settings
| Option | Description |
|---|---|
| Title | Enter a title for the Switch Widget. |
| Select Points | Select the point that should be displayed or controlled by the Switch Widget. Click Browse Hierarchy to browse through Network → Device → Point and select the required point. |
| Poll Frequency (Seconds) | Specify how frequently the widget retrieves or refreshes the selected point value. |
| Enable Write | Enable the toggle to allow the user to write or change the value of the selected point using the Switch Widget. |
| True Value | Enter the value that represents the True/On state of the selected point. |
| False Value | Enter the value that represents the False/Off state of the selected point. |
| Show Background | Use the toggle button to show or hide the widget background. |
| Hide Header | Use the toggle button to show or hide the widget header. |
Configure the Switch Widget
- Enter the required Title.
- Under Select Points, click Browse Hierarchy.
- Navigate through Network → Device → Point.
- Select the required point.
- Set the required Poll Frequency (Seconds).
- Enable Enable Write if the user should be able to change the point value from the Switch Widget.
- Enter the required True Value.
- Enter the required False Value.
- Configure Show Background according to your requirement.
- Configure Hide Header according to your requirement.
- Review all the configured settings.
- Click Save.
True and False Values
The Switch Widget uses the configured values to represent the two states of the selected point.
| State | Configuration |
|---|---|
| True / On | Uses the value configured under True Value. |
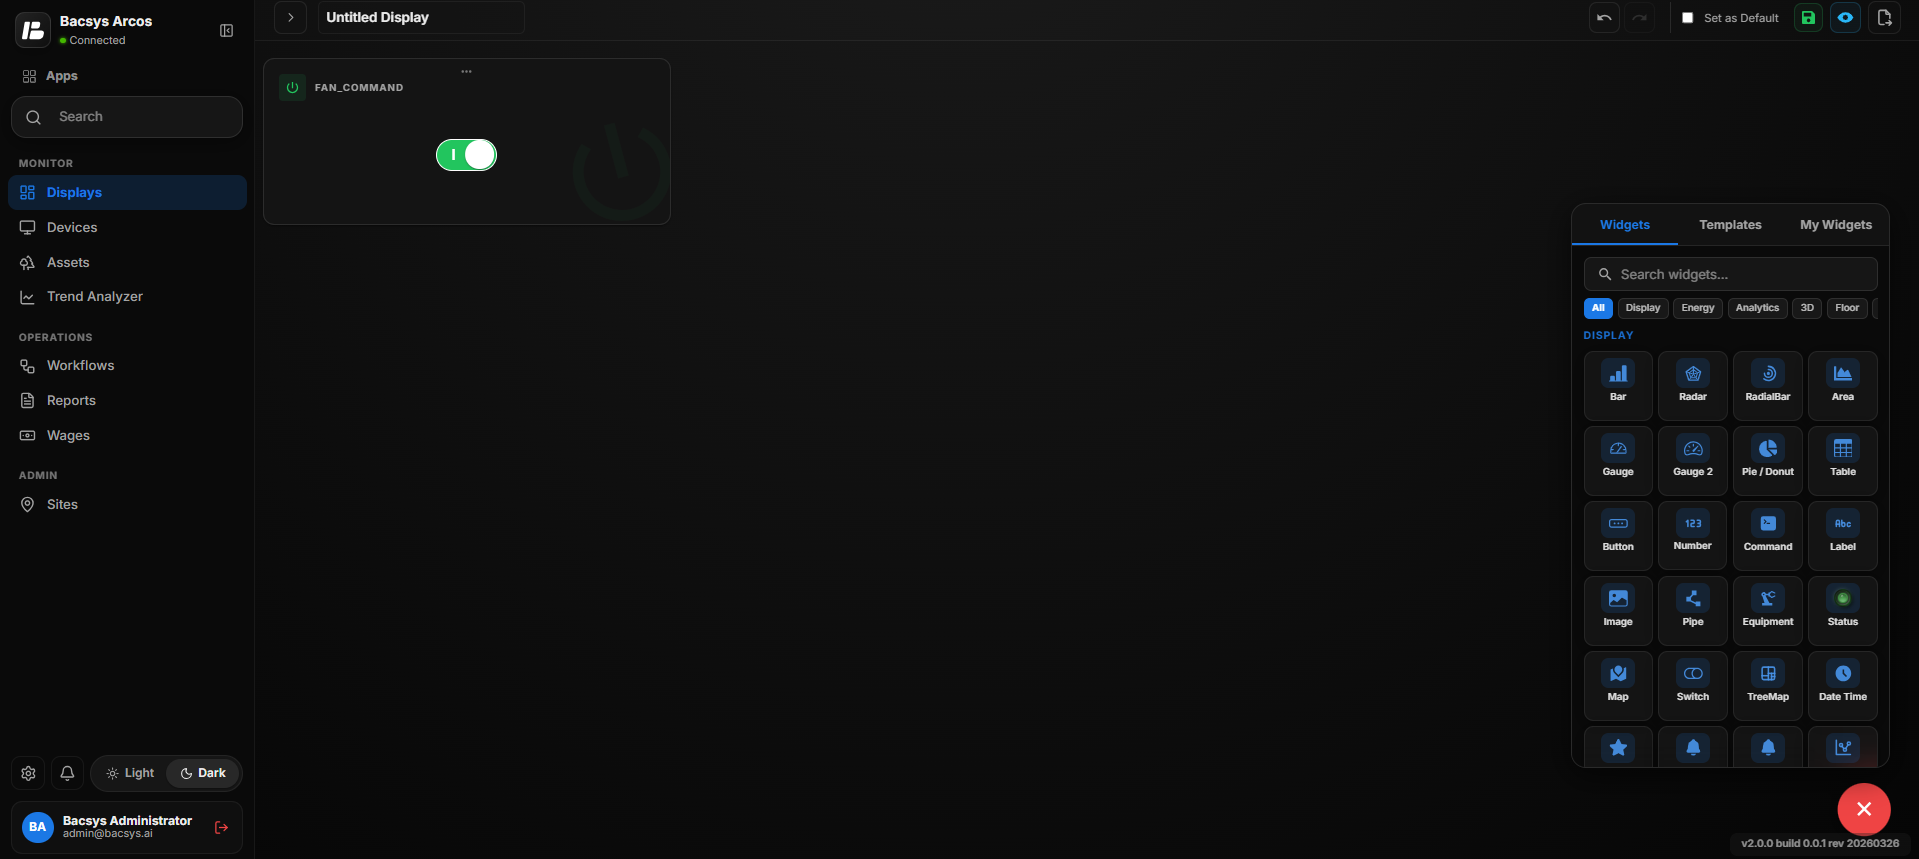
| False / Off | Uses the value configured under False Value. |
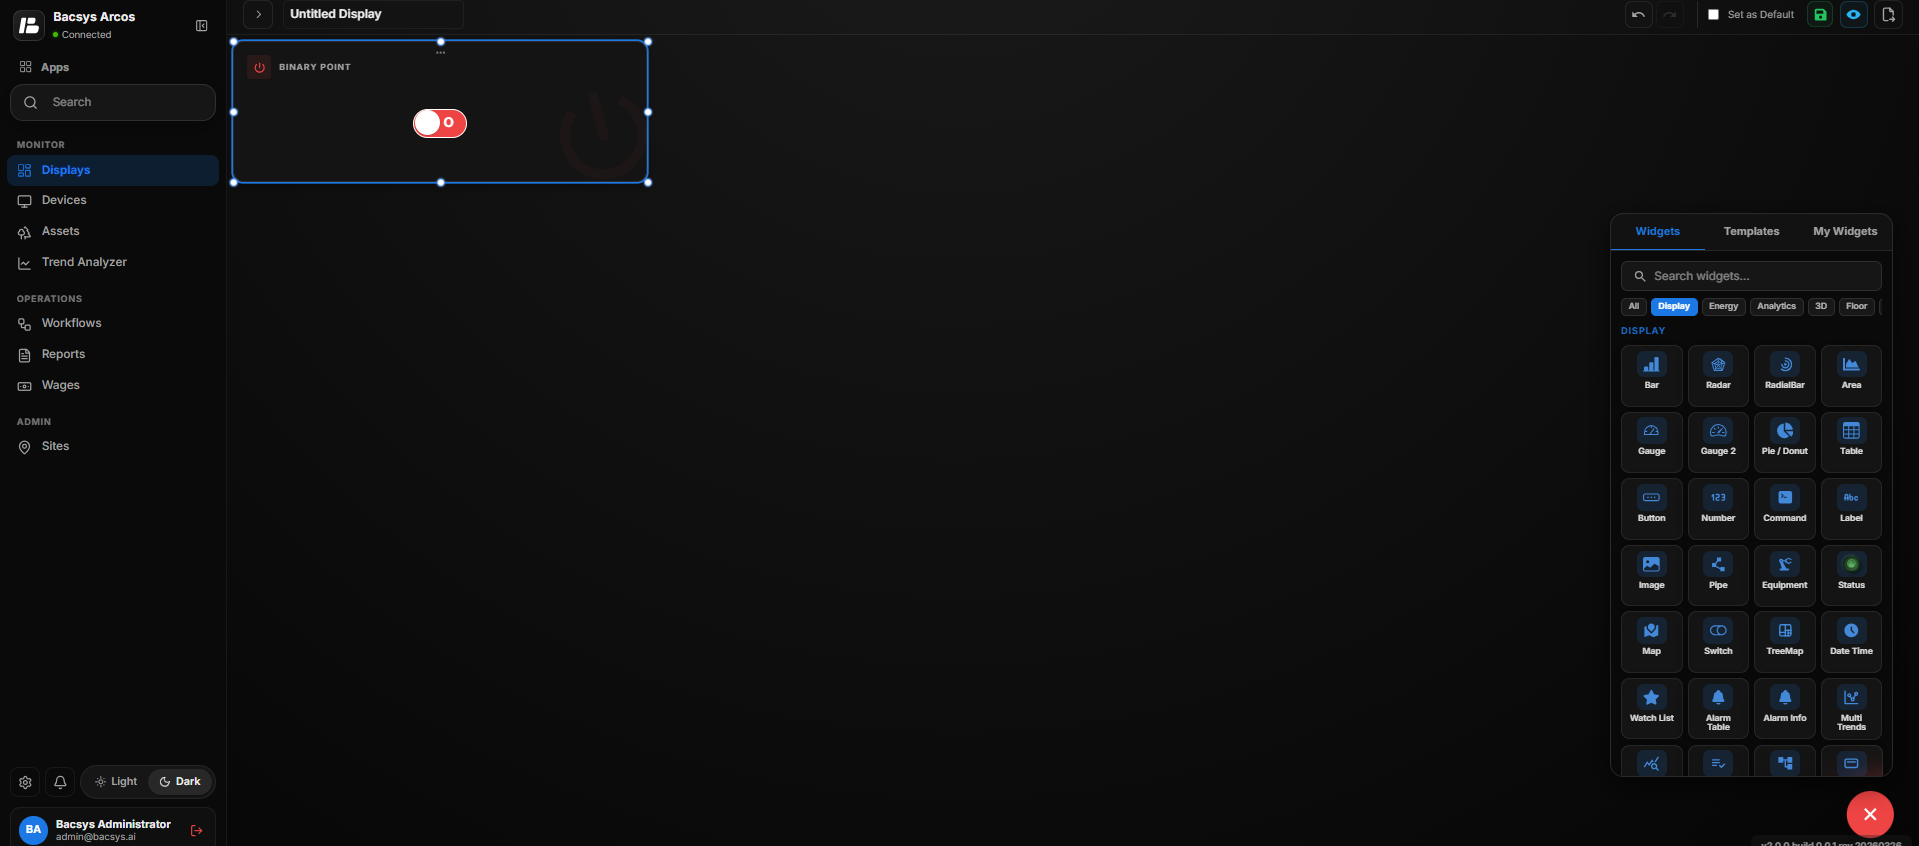
Enable Write
When Enable Write is enabled, the Switch Widget can be used to change the value of the selected point.
When Enable Write is disabled, the widget can be used to display the point value without allowing the user to write a new value.
Save the Configuration
After clicking Save, the Switch Widget is updated on the display with the selected point, configured True/False values, polling frequency, and write settings.
Add and Configure the Tree Map Widget
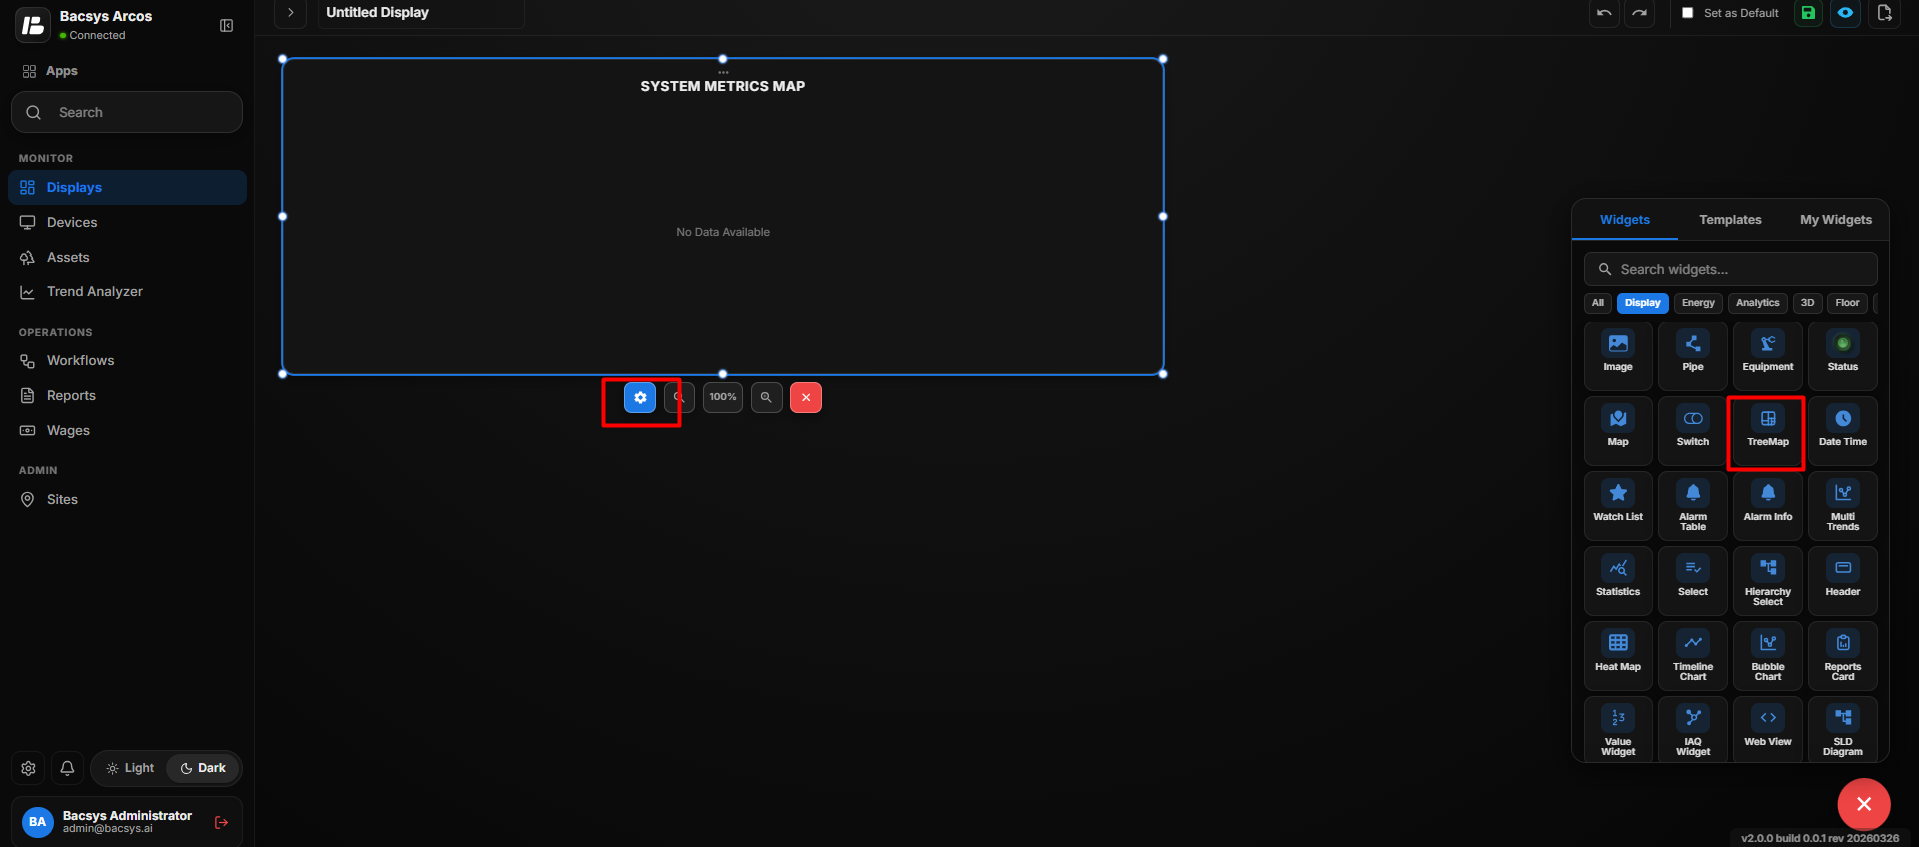
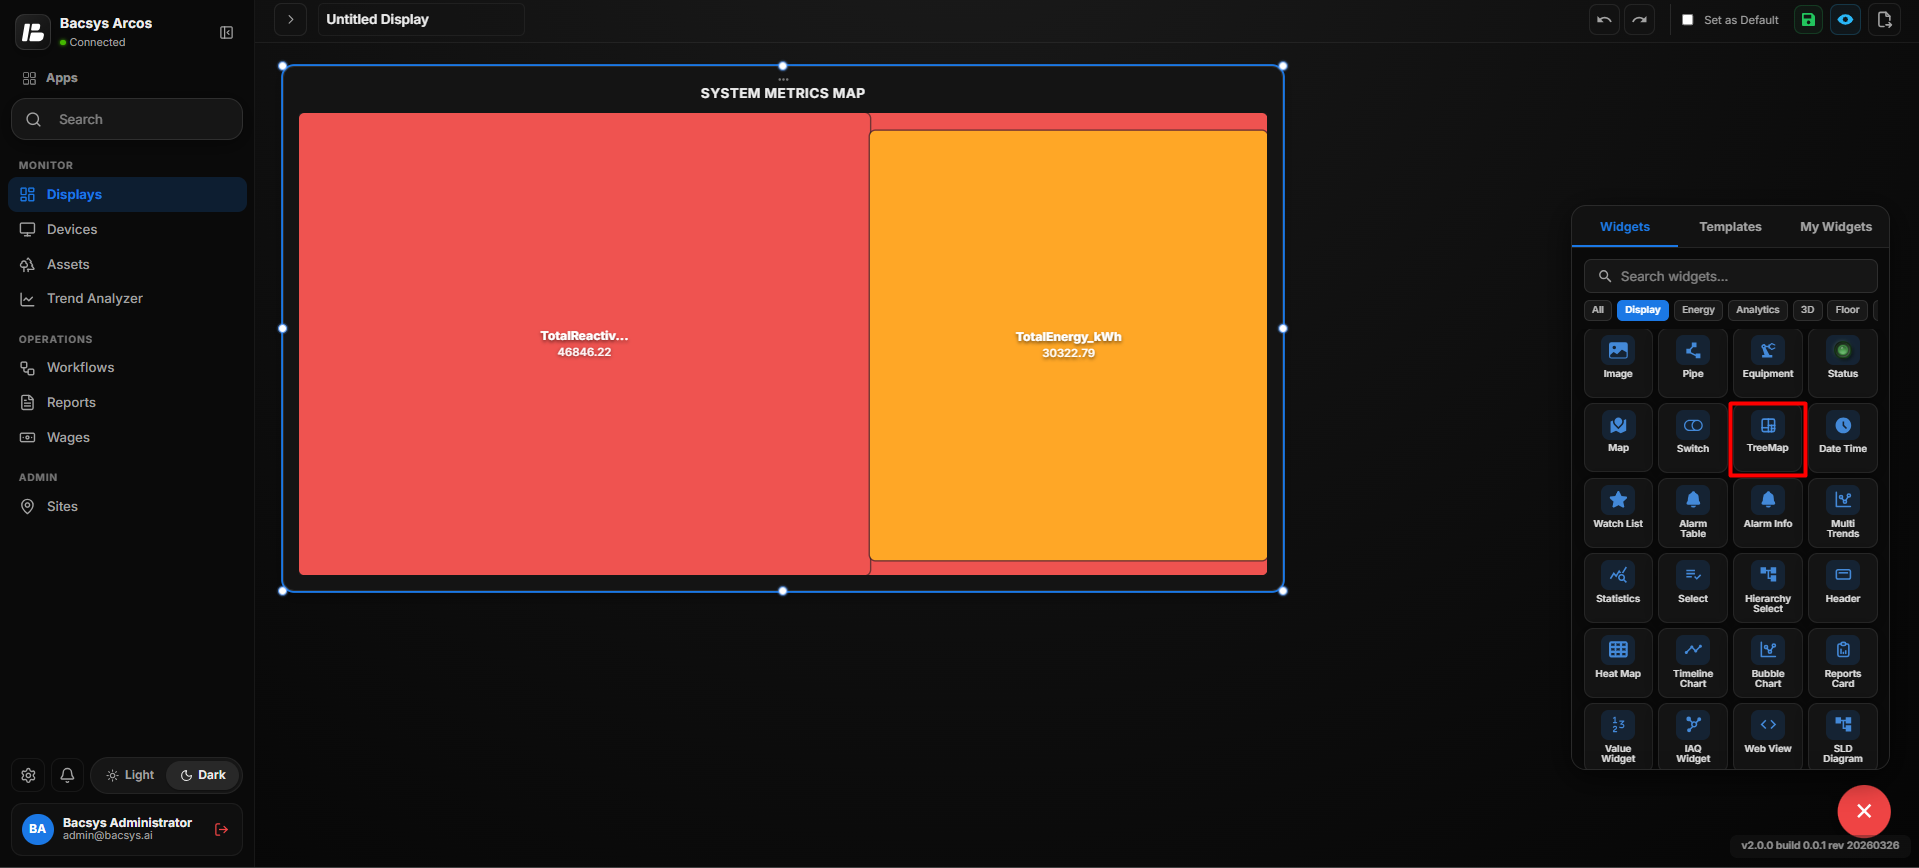
The Tree Map Widget is used to represent hierarchical data using nested rectangles. It allows users to select multiple points and view their data in a compact visual format.
Add the Tree Map Widget
- Click the + icon.
- Drag and drop the Tree Map Widget onto the display.
- Select the Tree Map Widget to view the available widget actions:
- Zoom In
- Zoom Out
- Settings
- Remove Widget
- Click Settings to open the Configure Data panel.
Tree Map Widget Settings
| Option | Description |
|---|---|
| Title | Enter a title for the Tree Map Widget. |
| Subtitle | Enter an optional subtitle to provide additional information about the displayed data. |
| Select Points | Select the points that should be displayed in the Tree Map. A maximum of 20 points can be selected. Click Browse Hierarchy to navigate through Network → Device → Point and select the required points. |
| Poll Frequency (Seconds) | Specify how frequently the widget retrieves or refreshes the selected point values. |
| Show Background | Use the toggle button to show or hide the widget background. |
| Hide Header | Use the toggle button to show or hide the widget header, including the title and subtitle. |
Configure the Tree Map Widget
- Enter the required Title.
- Enter an optional Subtitle.
- Under Select Points, click Browse Hierarchy.
- Navigate through Network → Device → Point.
- Select the required points.
- Make sure that a maximum of 20 points are selected.
- Set the required Poll Frequency (Seconds).
- Configure Show Background according to your requirement.
- Configure Hide Header according to your requirement.
- Review all the configured settings.
- Click Save.
Save the Configuration
After clicking Save, the Tree Map Widget is updated on the display and represents the selected point data using nested rectangles.
Note: The Tree Map Widget supports a maximum of 20 points.
Add and Configure the Date Time Widget
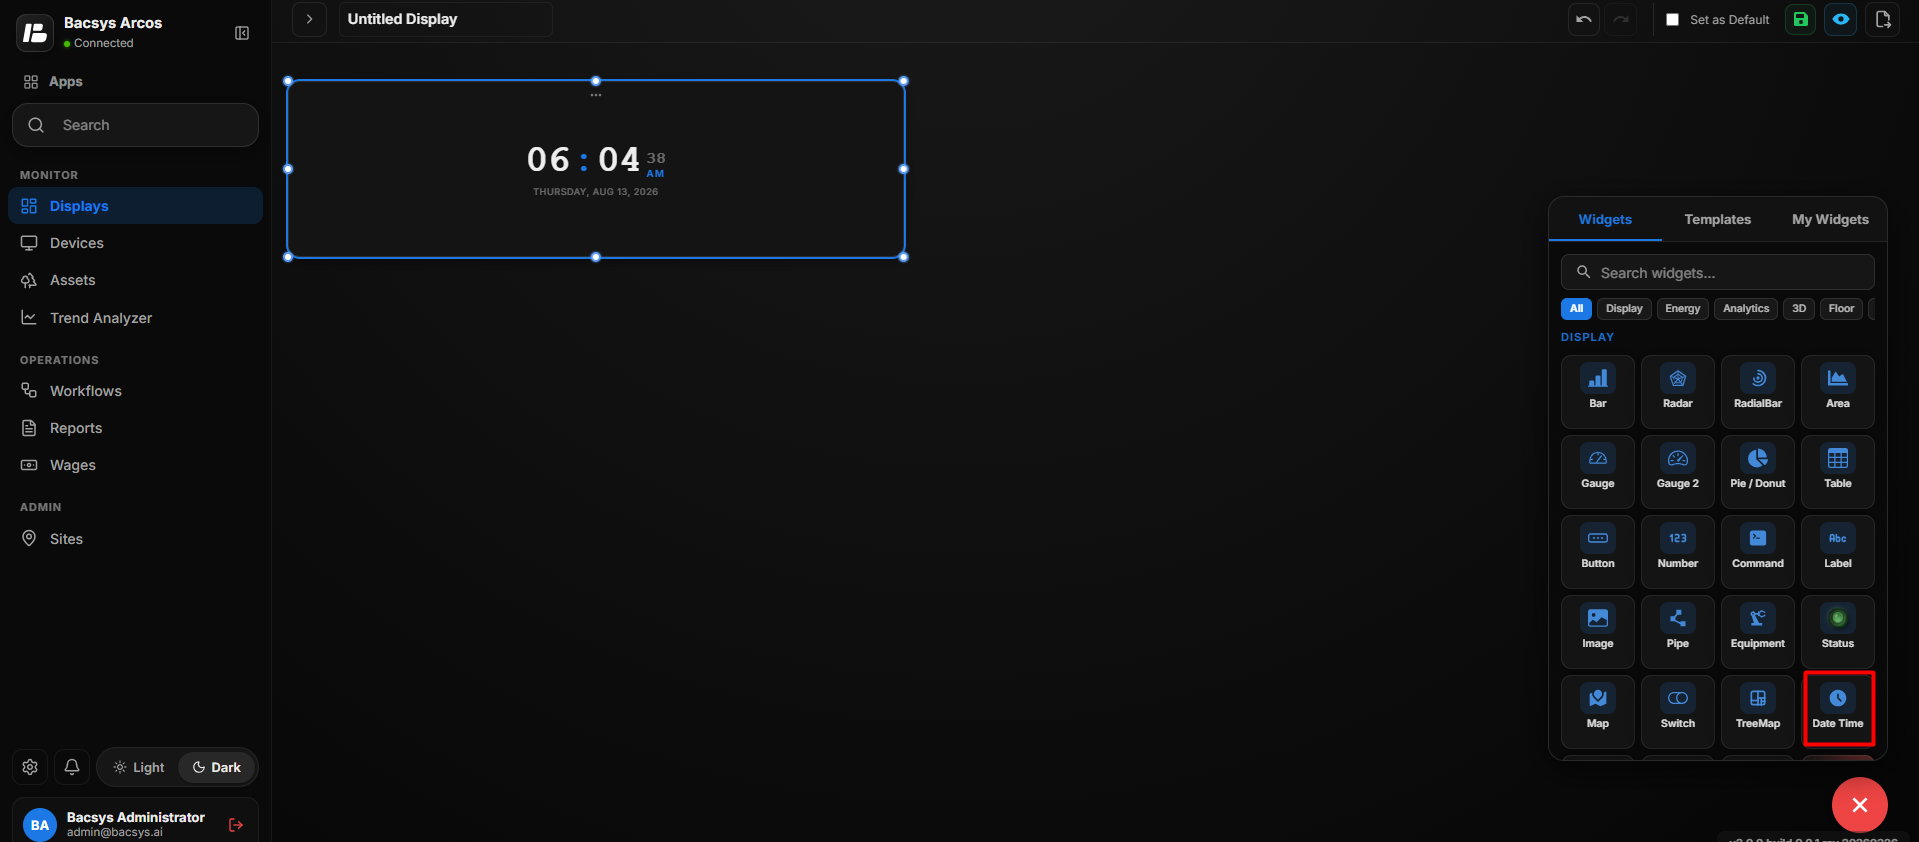
The Date Time Widget is used to display the current date and time on the display. When the widget is added to the display, it automatically shows the current time.
The widget supports two clock styles:
- Digital
- Analog
Add the Date Time Widget
- Click the + icon.
- Drag and drop the Date Time Widget onto the display.
- The widget automatically displays the current date and time.
- Select the Date Time Widget to view the available widget actions:
- Zoom In
- Zoom Out
- Settings
- Remove Widget
- Click Settings to open the Configure Data panel.
Clock Style
Under Clock Style, select one of the following options:
| Clock Style | Description |
|---|---|
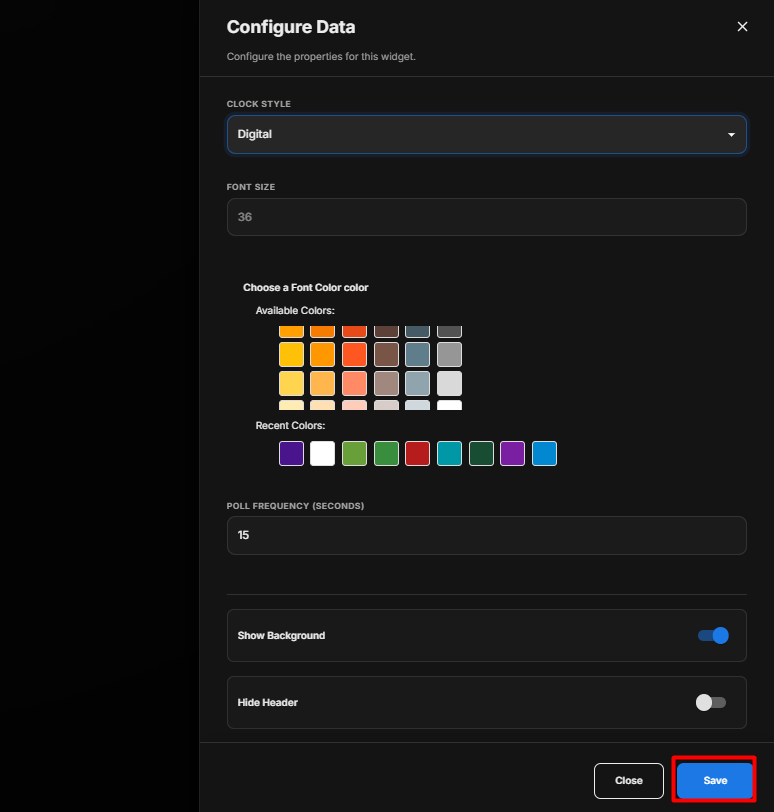
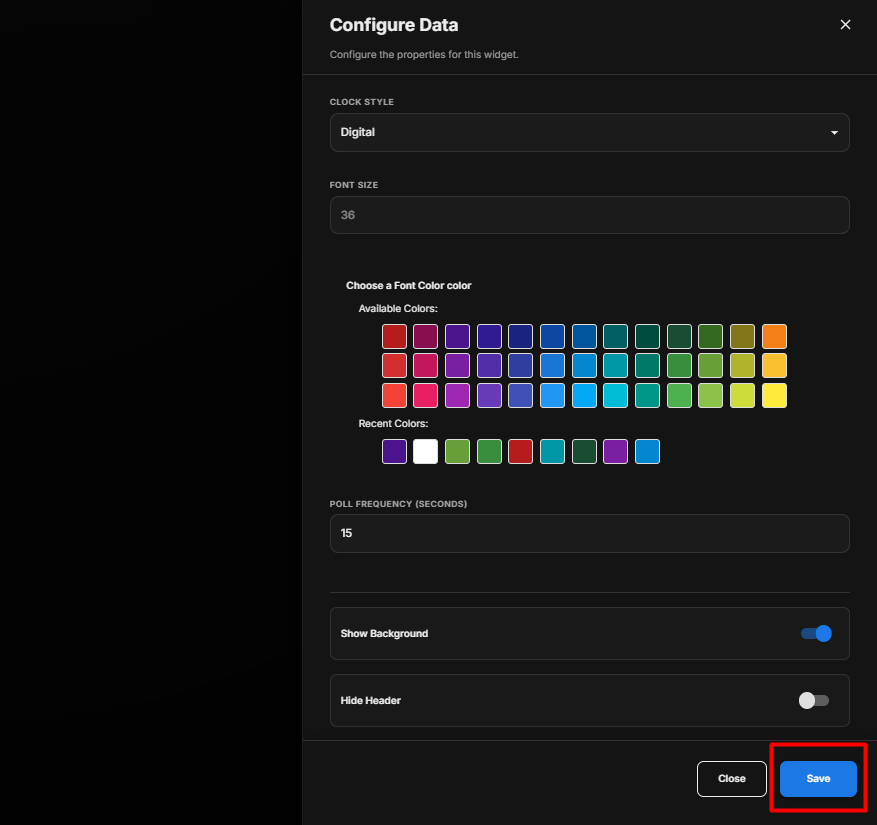
| Digital | Displays the current time in a digital clock format. Additional options are available to customize the font size and font color. |
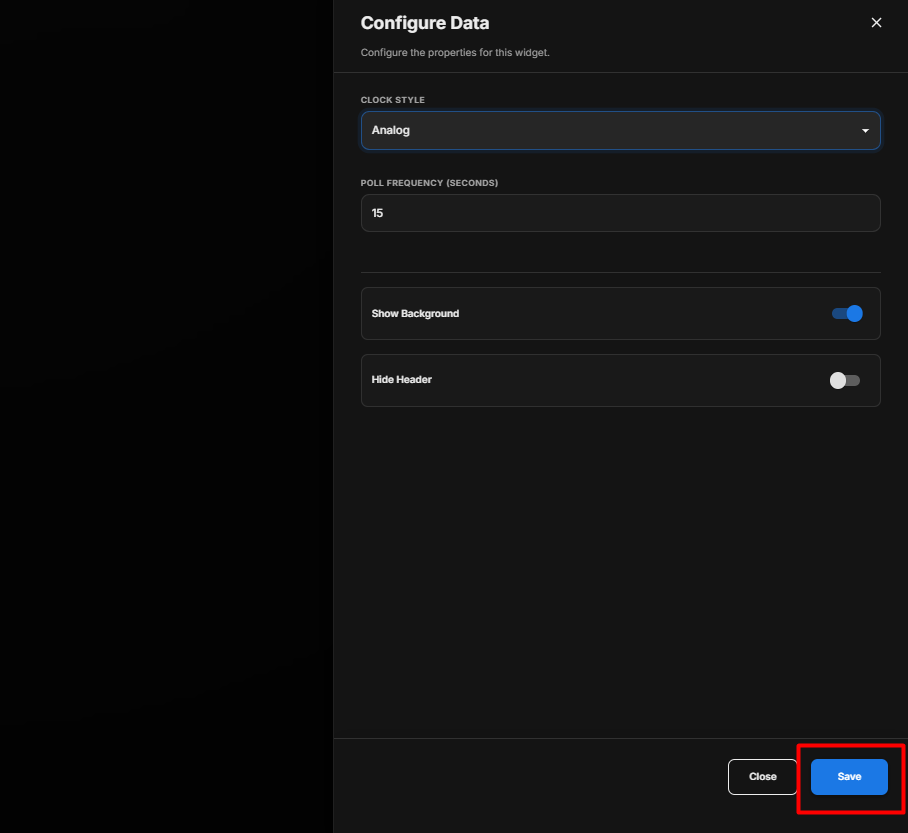
| Analog | Displays the current time using an analog clock face with hour, minute, and second hands. |
Digital Clock
When Digital is selected, the current time is displayed in a digital format.
Digital Clock Settings
| Option | Description |
|---|---|
| Clock Style | Select Digital to display the time in digital format. |
| Font Size | Enter the required font size for the displayed time. |
| Choose a Font Color | Select the required font color for the digital clock. |
| Poll Frequency (Seconds) | Specify how frequently the displayed time is refreshed. |
| Show Background | Use the toggle button to show or hide the widget background. |
| Hide Header | Use the toggle button to show or hide the widget header. |
Configure the Digital Clock
- Under Clock Style, select Digital.
- Enter the required Font Size.
- Select the required Font Color.
- Set the required Poll Frequency (Seconds).
- Configure Show Background according to your requirement.
- Configure Hide Header according to your requirement.
- Review the configured settings.
- Click Save.
Analog Clock
When Analog is selected, the current time is displayed using an analog clock face.
The analog clock displays:
- 12, 3, 6, and 9 hour markers.
- Hour hand to indicate the current hour.
- Minute hand to indicate the current minutes.
- Second hand to indicate the current seconds.
Analog Clock Settings
| Option | Description |
|---|---|
| Clock Style | Select Analog to display the current time using an analog clock face. |
| Poll Frequency (Seconds) | Specify how frequently the analog clock is refreshed. |
| Show Background | Use the toggle button to show or hide the widget background. |
| Hide Header | Use the toggle button to show or hide the widget header. |
Configure the Analog Clock
- Under Clock Style, select Analog.
- Set the required Poll Frequency (Seconds).
- Configure Show Background according to your requirement.
- Configure Hide Header according to your requirement.
- Review the configured settings.
- Click Save.
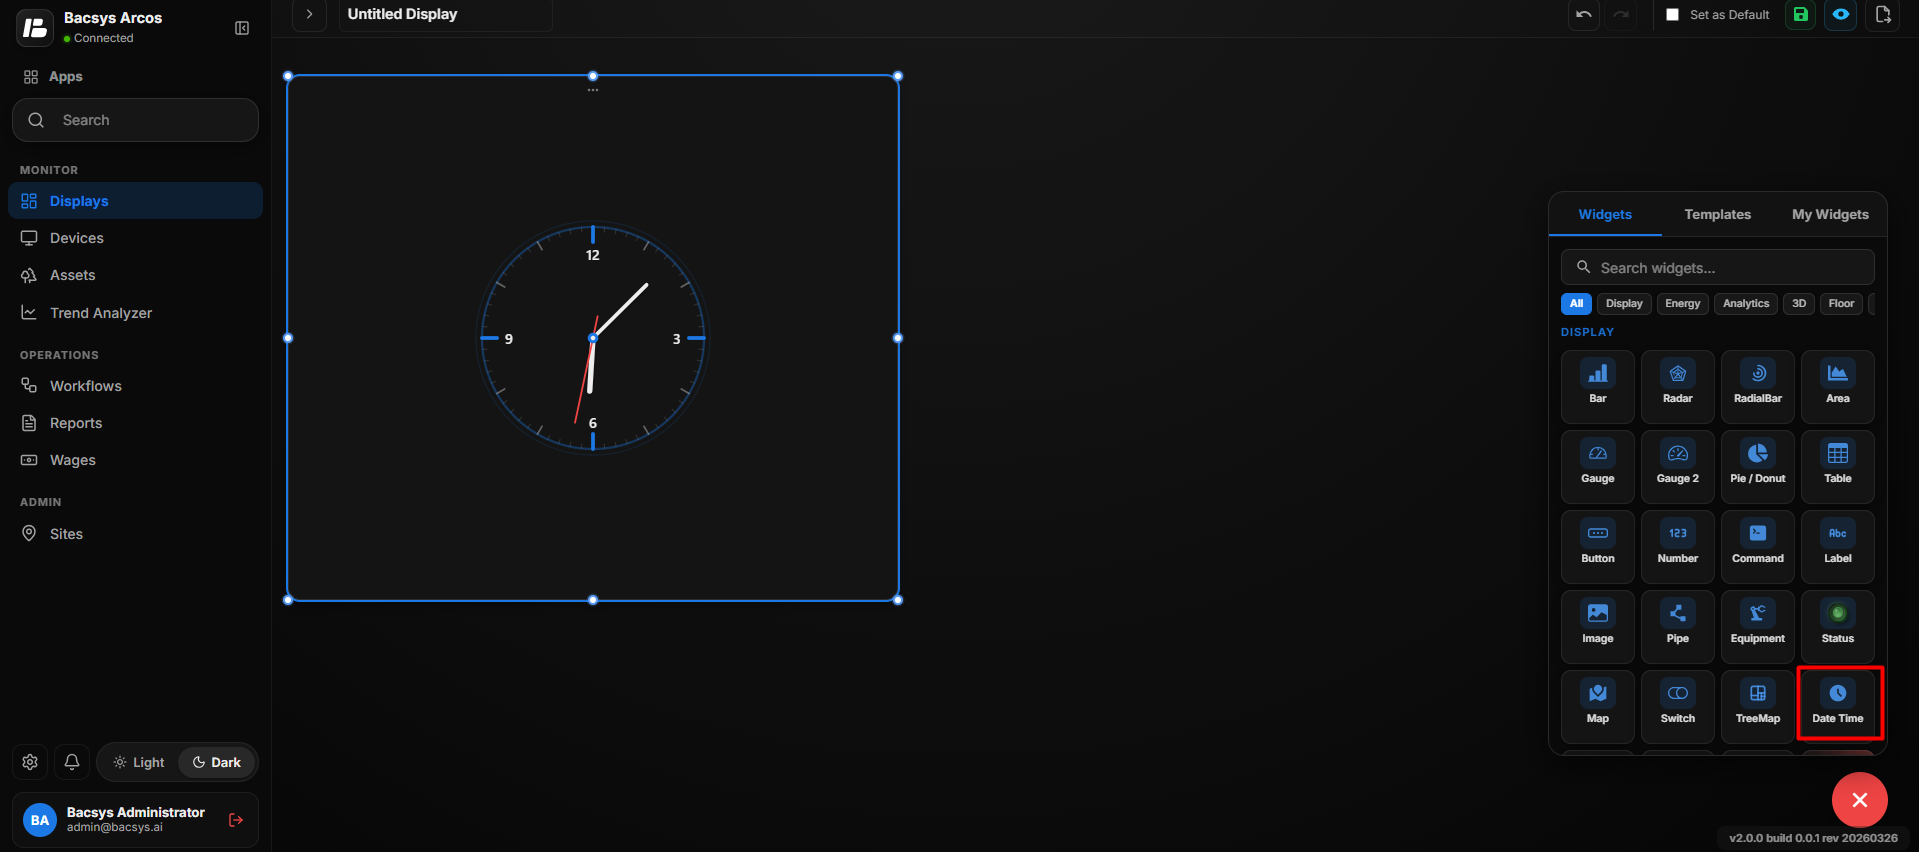
Clock Style Summary
| Clock Style | Configuration Options |
|---|---|
| Digital | Clock Style, Font Size, Font Color, Poll Frequency, Show Background, Hide Header |
| Analog | Clock Style, Poll Frequency, Show Background, Hide Header |
Save the Configuration
After clicking Save, the Date Time Widget is updated on the display using the selected clock style and configured settings.
Note: The Date Time Widget automatically displays the current date and time when it is added to the display. The Digital style provides font customization, while the Analog style displays the time using a traditional clock face.
Add and Configure the Watch List Widget
The Watch List Widget displays a list of selected data points for quick monitoring. It allows users to view point information in one place and configure how frequently the data is refreshed.
Add the Watch List Widget
- Click the + icon.
- Drag and drop the Watch List Widget onto the display.
- Select the Watch List Widget to view the available widget actions:
- Zoom In
- Zoom Out
- Settings
- Remove Widget
- Click Settings to open the Configure Data panel.
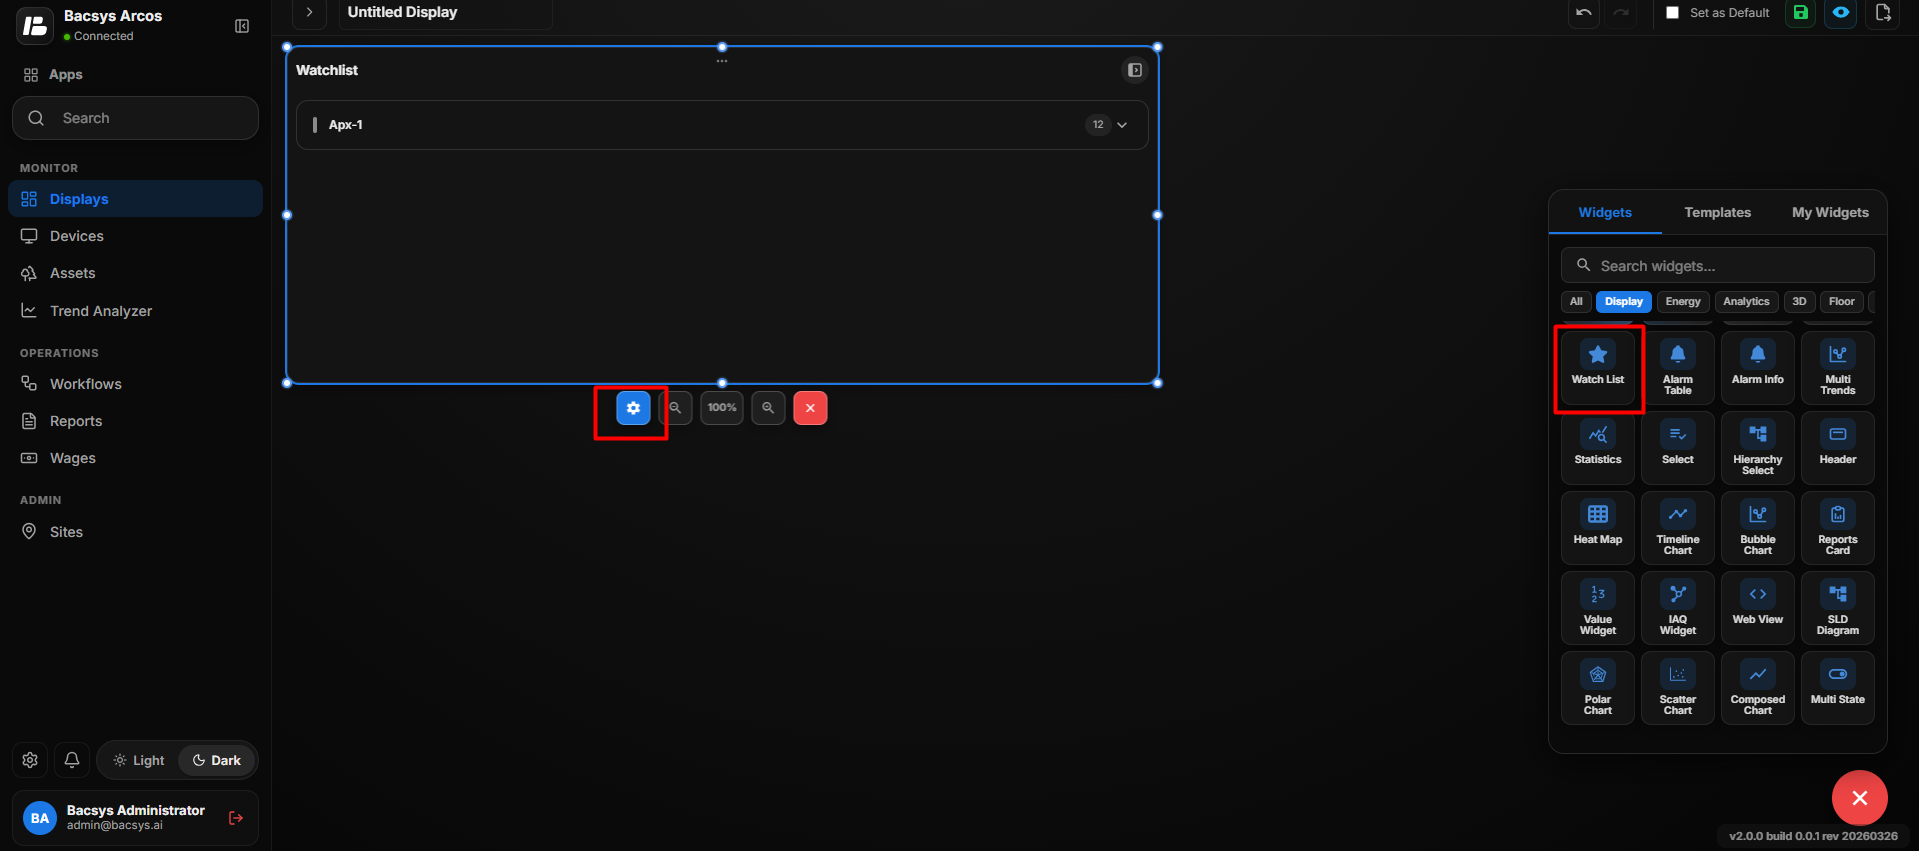
Watch List Widget Settings
| Option | Description |
|---|---|
| Title | Enter a title for the Watch List Widget. The title is displayed at the top of the widget. |
| Poll Frequency (Seconds) | Specify how frequently the Watch List refreshes the displayed data. |
| Show Background | Use the toggle button to show or hide the widget background. |
| Hide Header | Use the toggle button to show or hide the widget header, including the title. |
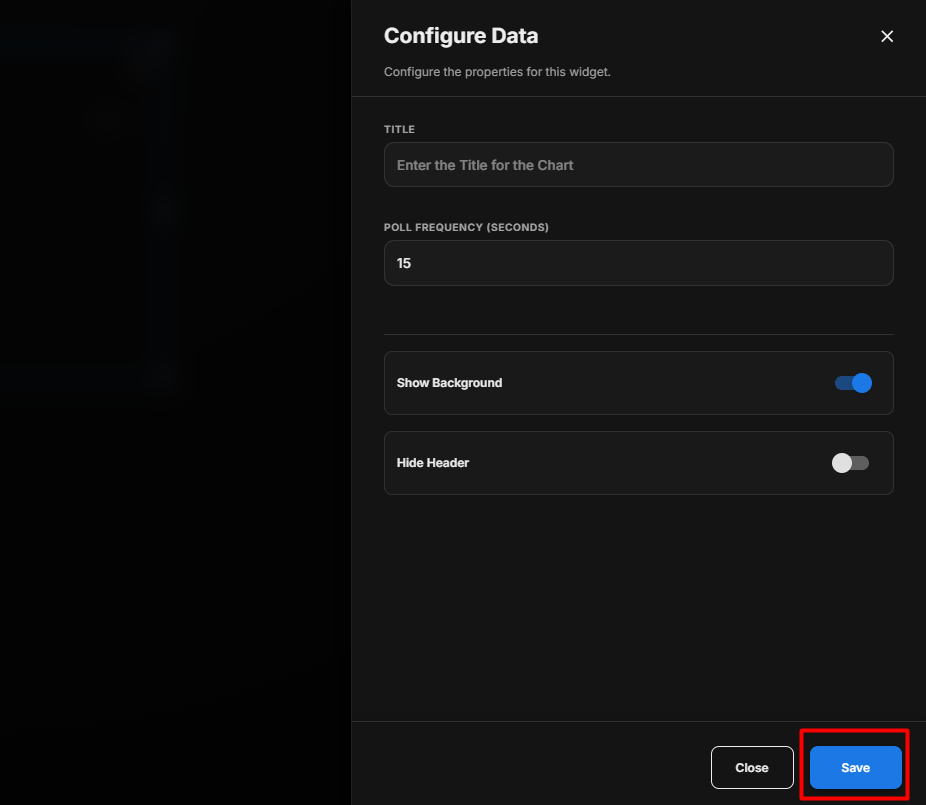
Configure the Watch List Widget
- Enter the required Title.
- Set the required Poll Frequency (Seconds).
- Configure Show Background according to your requirement.
- Configure Hide Header according to your requirement.
- Review the configured settings.
- Click Save.
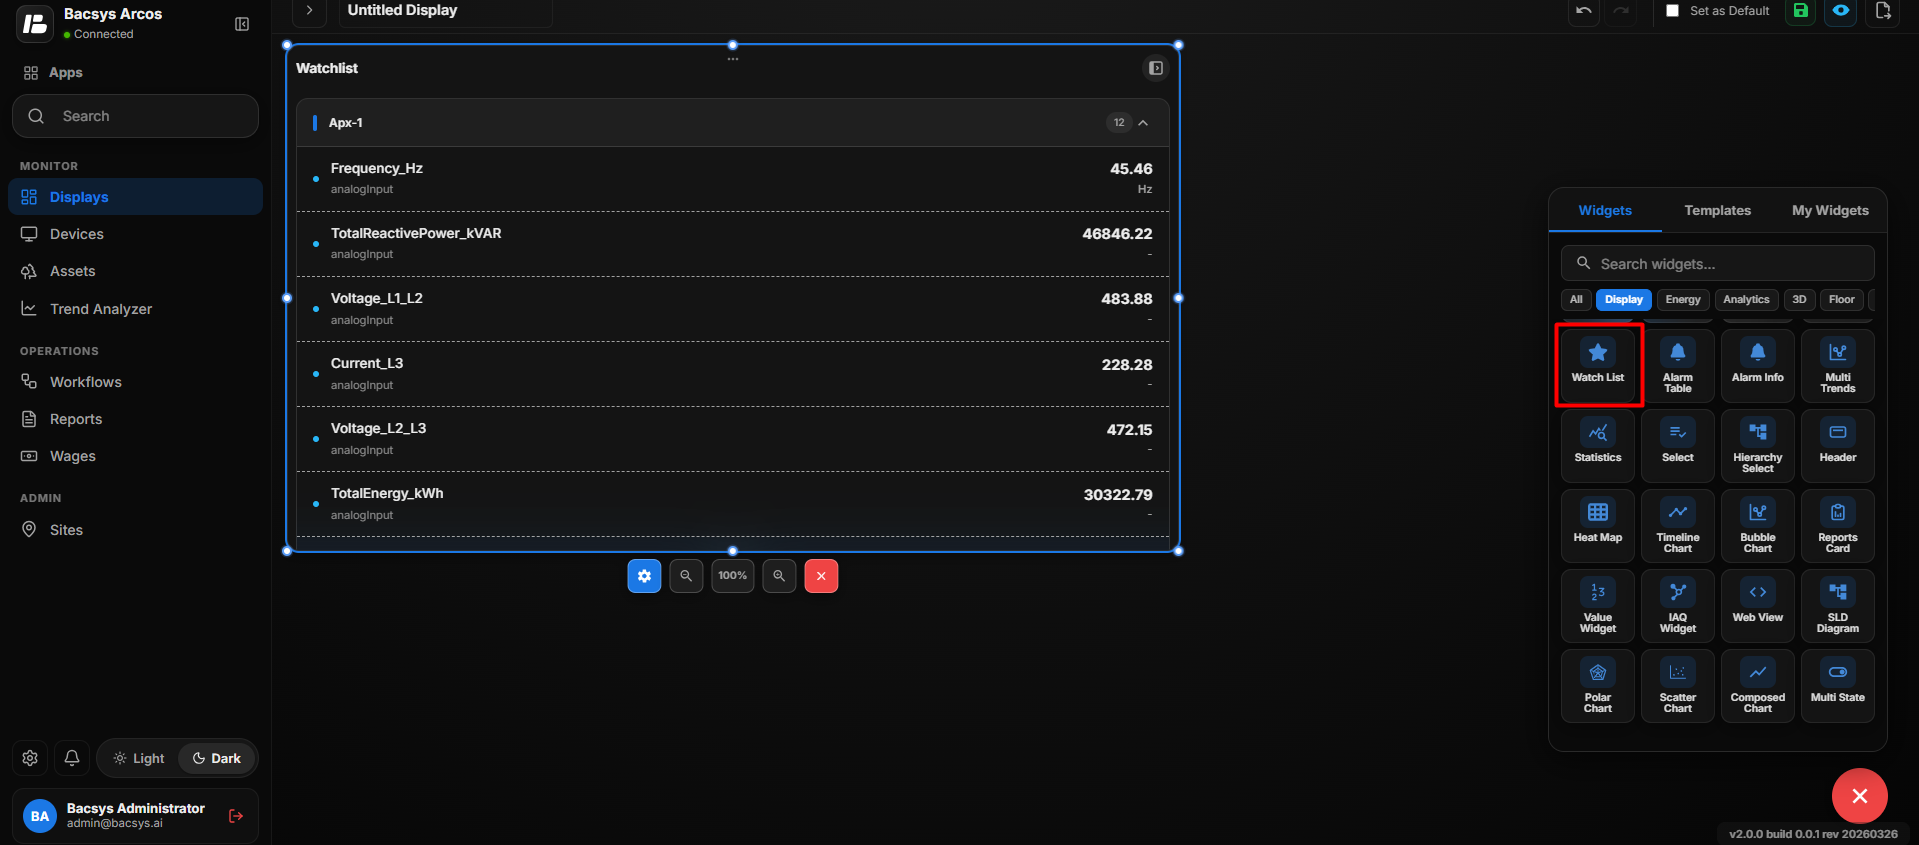
Save the Configuration
After clicking Save, the Watch List Widget is updated on the display with the configured title, polling frequency, background, and header settings.
Note: The Watch List Widget displays the selected data points for quick monitoring. Point selection is handled as part of the Watch List data rather than through the settings shown above.
Add and Configure the Alarm Table Widget
The Alarm Table Widget is used to display alarm conditions in a tabular format. It allows users to monitor selected alarm points, view their alarm states, and optionally provide an Acknowledge button for alarm management.
Add the Alarm Table Widget
- Click the + icon.
- Drag and drop the Alarm Table Widget onto the display.
- Select the Alarm Table Widget to view the available widget actions:
- Zoom In
- Zoom Out
- Settings
- Remove Widget
- Click Settings to open the Configure Data panel.
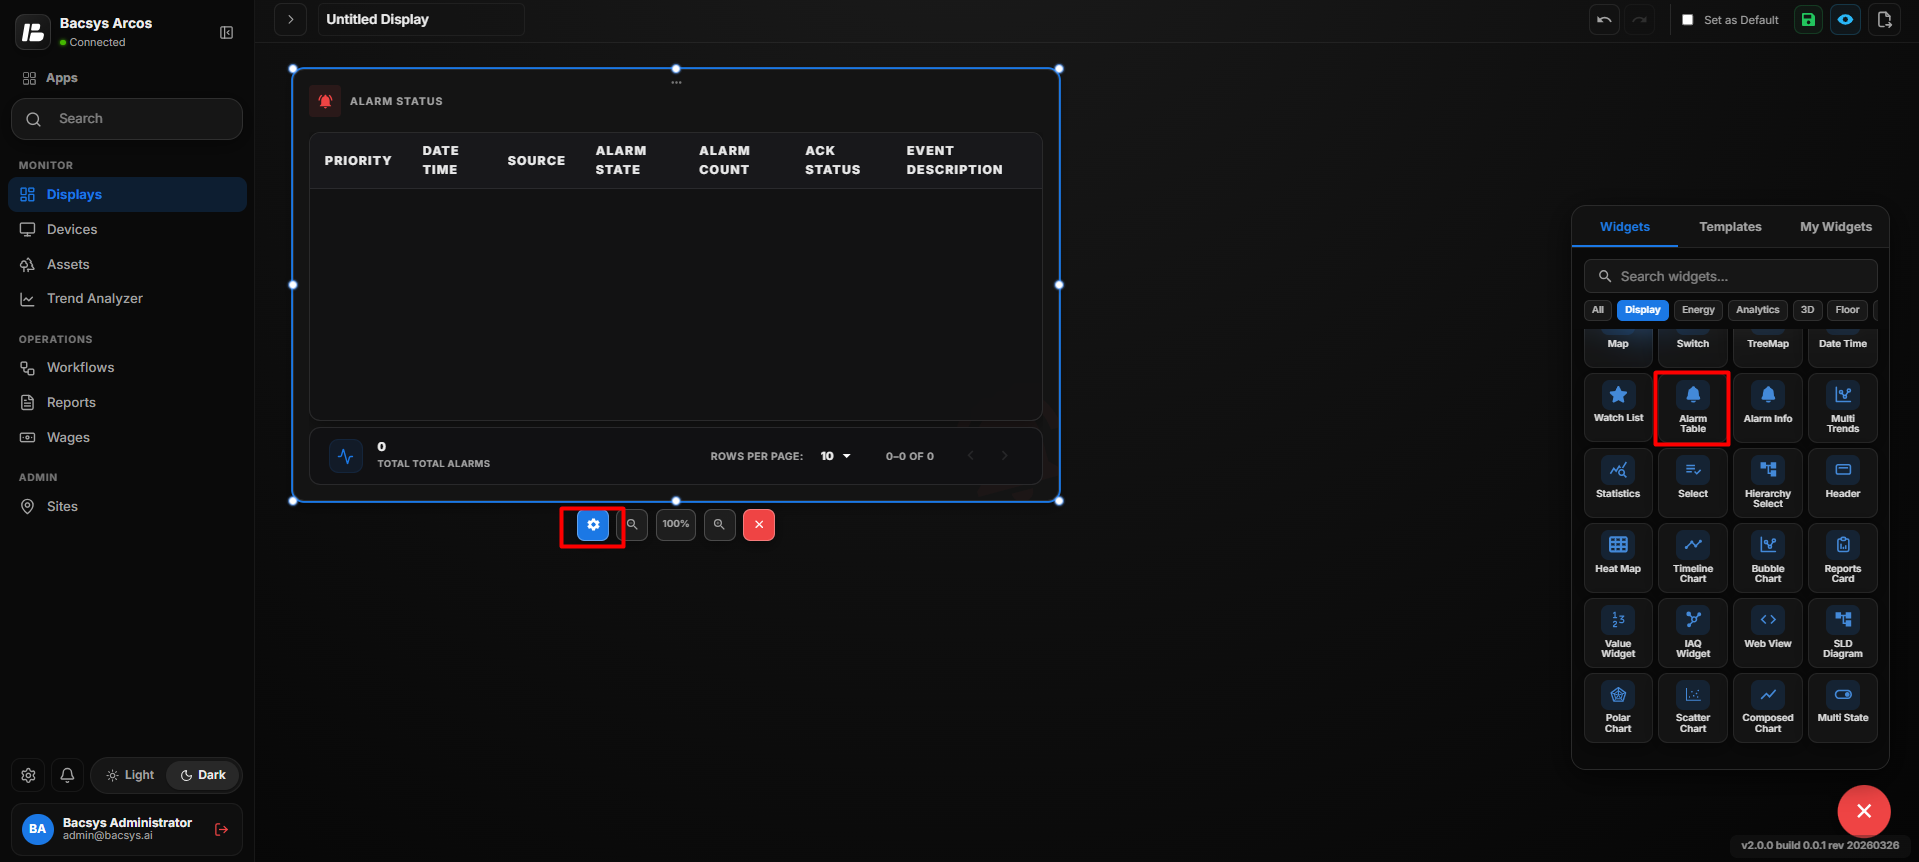
Alarm Table Widget Settings
| Option | Description |
|---|---|
| Title | Enter a title for the Alarm Table Widget. |
| Subtitle | Enter an optional subtitle to provide additional information about the alarm table. |
| Select Points | Select the points that should be monitored for alarm conditions. Click Browse Hierarchy to navigate through Network → Device → Point and select the required points. |
| Poll Frequency (Seconds) | Specify how frequently the widget retrieves or refreshes the selected alarm point information. |
| Show Acknowledge Button | Enable the toggle to display an Acknowledge button for alarm events. |
| True Value | Enter the value that represents the True or active alarm condition. |
| False Value | Enter the value that represents the False or inactive alarm condition. |
| Show Background | Use the toggle button to show or hide the widget background. |
| Hide Header | Use the toggle button to show or hide the widget header, including the title and subtitle. |
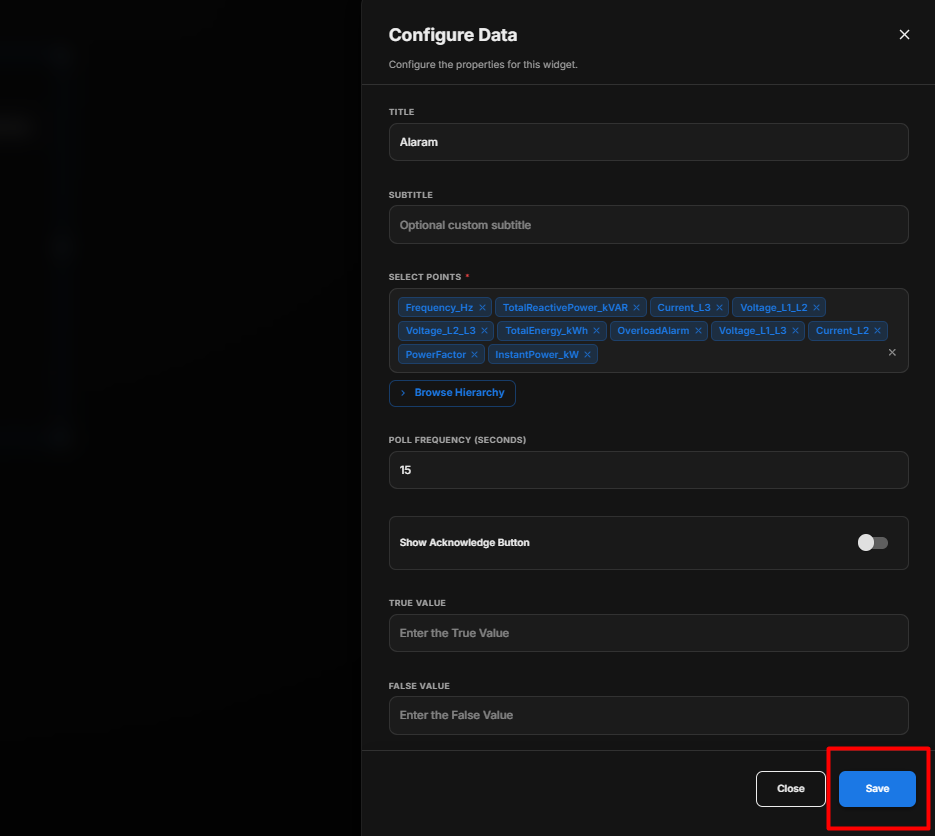
Configure the Alarm Table Widget
- Enter the required Title.
- Enter an optional Subtitle.
- Under Select Points, click Browse Hierarchy.
- Navigate through Network → Device → Point.
- Select the required alarm points.
- Set the required Poll Frequency (Seconds).
- Enable Show Acknowledge Button if users should be able to acknowledge alarms.
- Enter the required True Value for the active alarm condition.
- Enter the required False Value for the inactive alarm condition.
- Configure Show Background according to your requirement.
- Configure Hide Header according to your requirement.
- Review all the configured settings.
- Click Save.
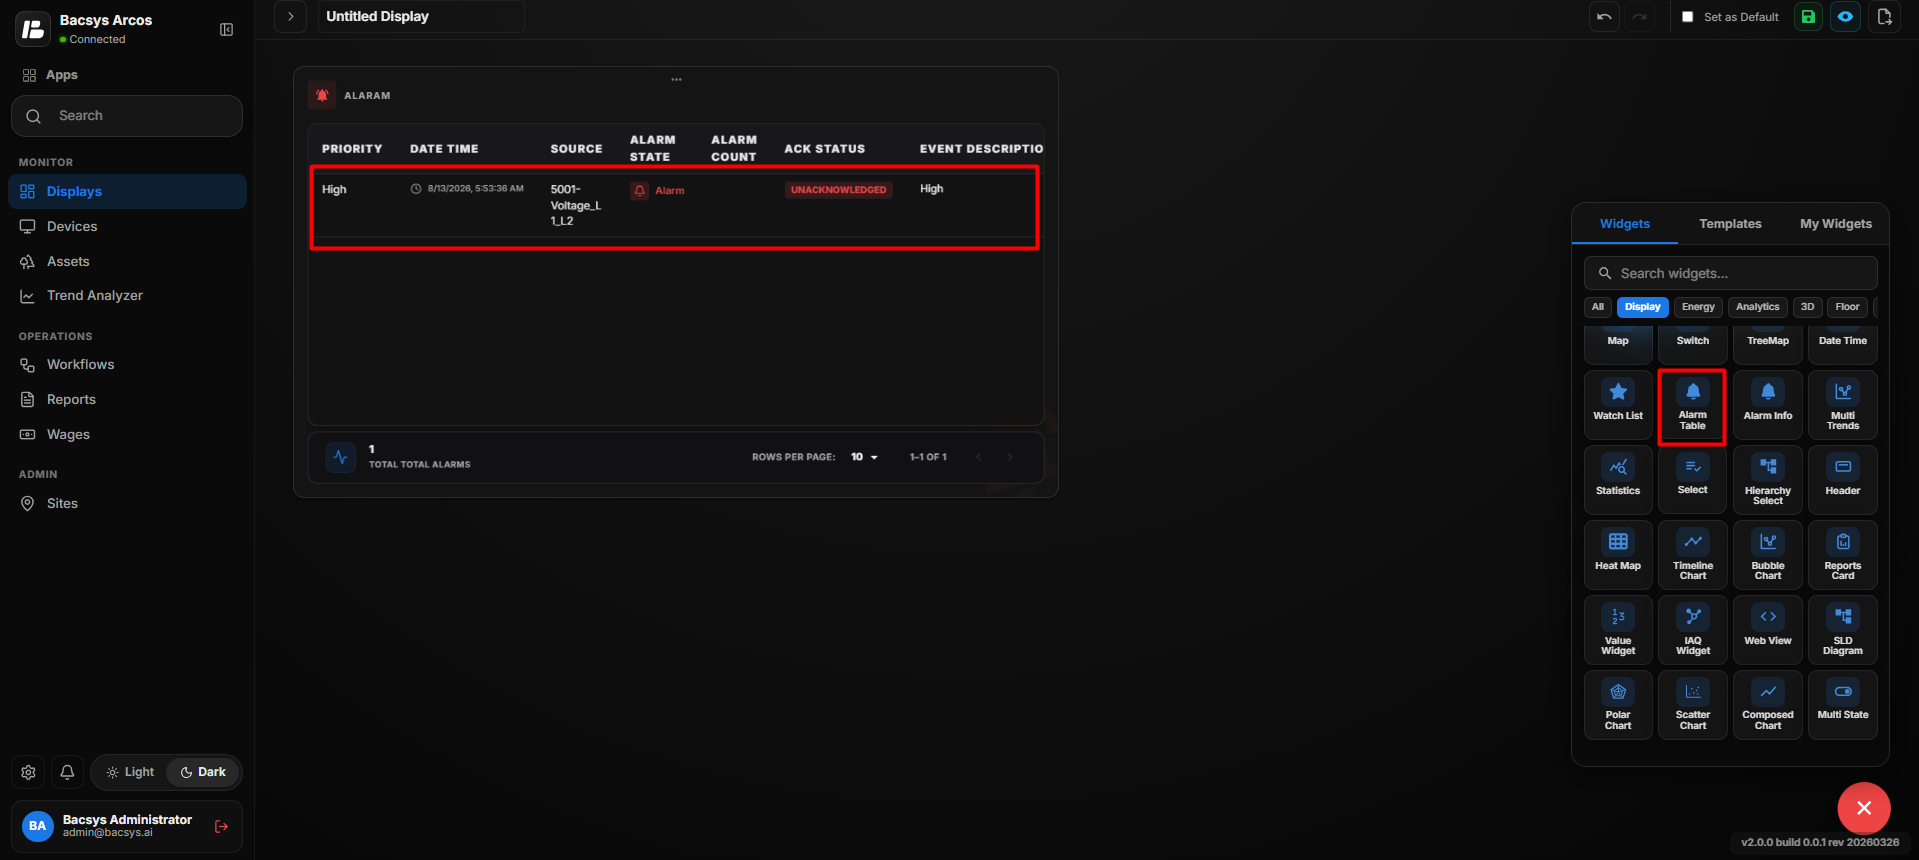
Alarm Table Display
The Alarm Table Widget displays alarm conditions in a table, allowing users to quickly identify and monitor active alarms.
The table can be used to visually indicate:
- Alarm conditions
- Alarm point information
- Active and inactive alarm states
- Alarm acknowledgement status when the Acknowledge Button is enabled
Acknowledge Alarm
When Show Acknowledge Button is enabled, an Acknowledge button is displayed for applicable alarm events.
Users can select the Acknowledge button to acknowledge an active alarm.
Save the Configuration
After clicking Save, the Alarm Table Widget is updated on the display with the selected alarm points and configured alarm settings.
Add and Configure the Alarm Info Widget
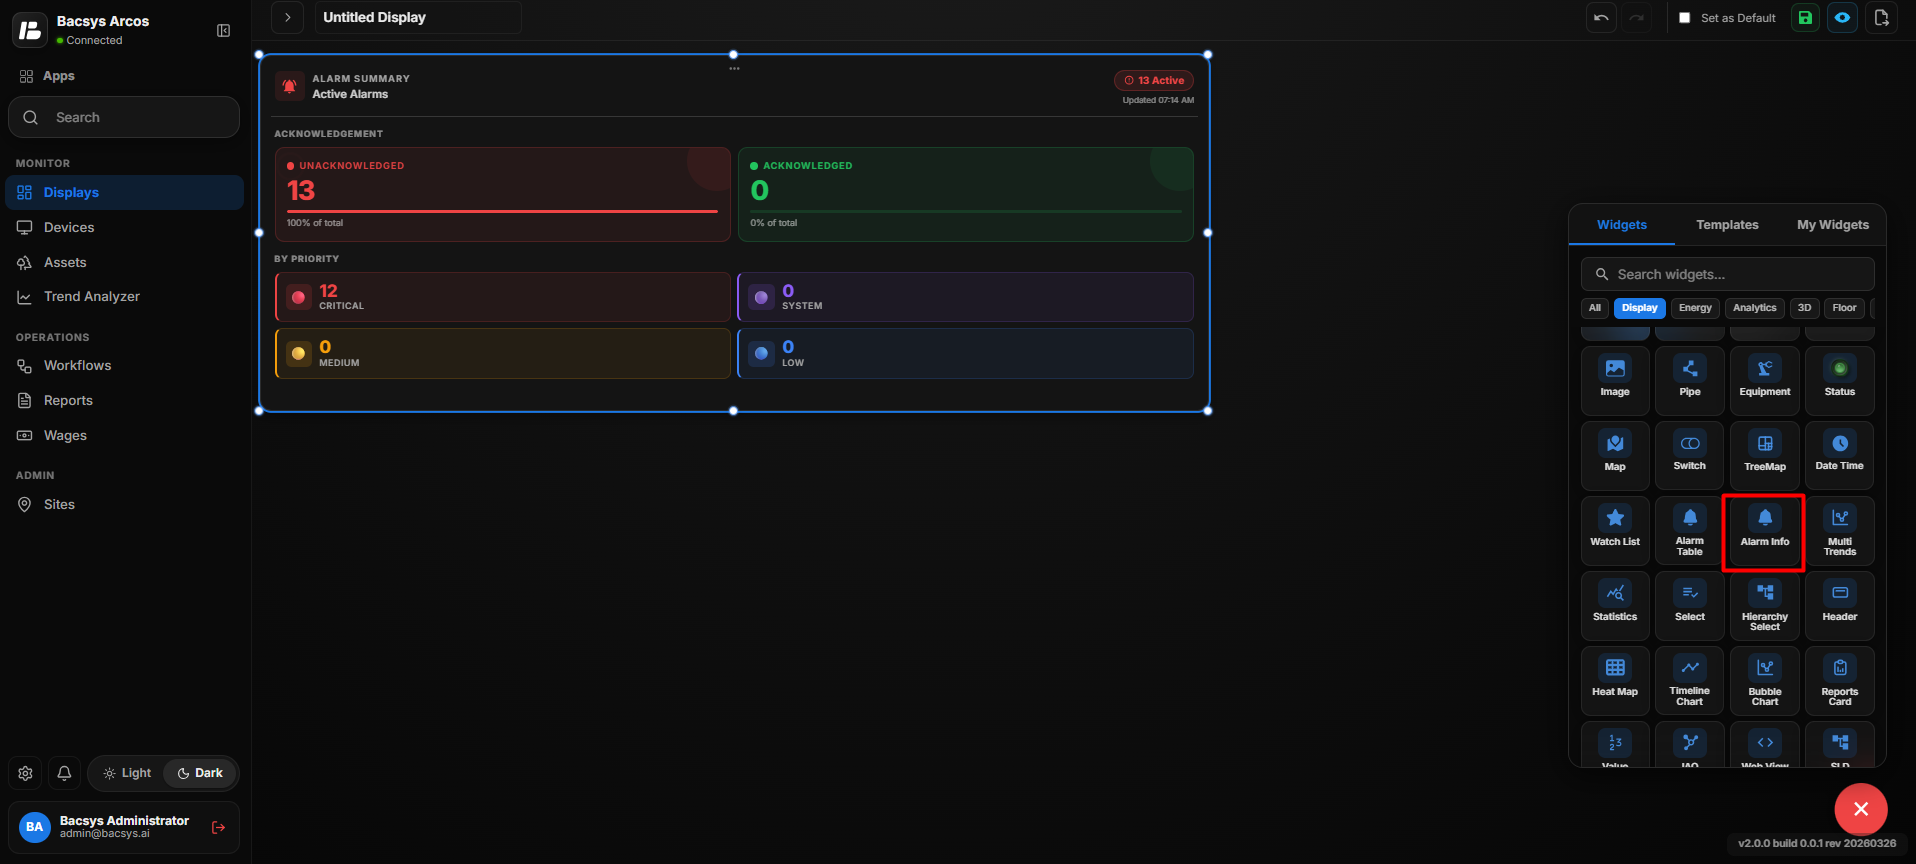
The Alarm Info Widget is used to display a summary of active alarms on the display. It provides an overview of the current alarm status, including unacknowledged alarms, acknowledged alarms, and alarms by priority.
Add the Alarm Info Widget
- Click the + icon.
- Drag and drop the Alarm Info Widget onto the display.
- Select the Alarm Info Widget to view the available widget actions:
- Zoom In
- Zoom Out
- Settings
- Remove Widget
- Click Settings to open the Configure Data panel.
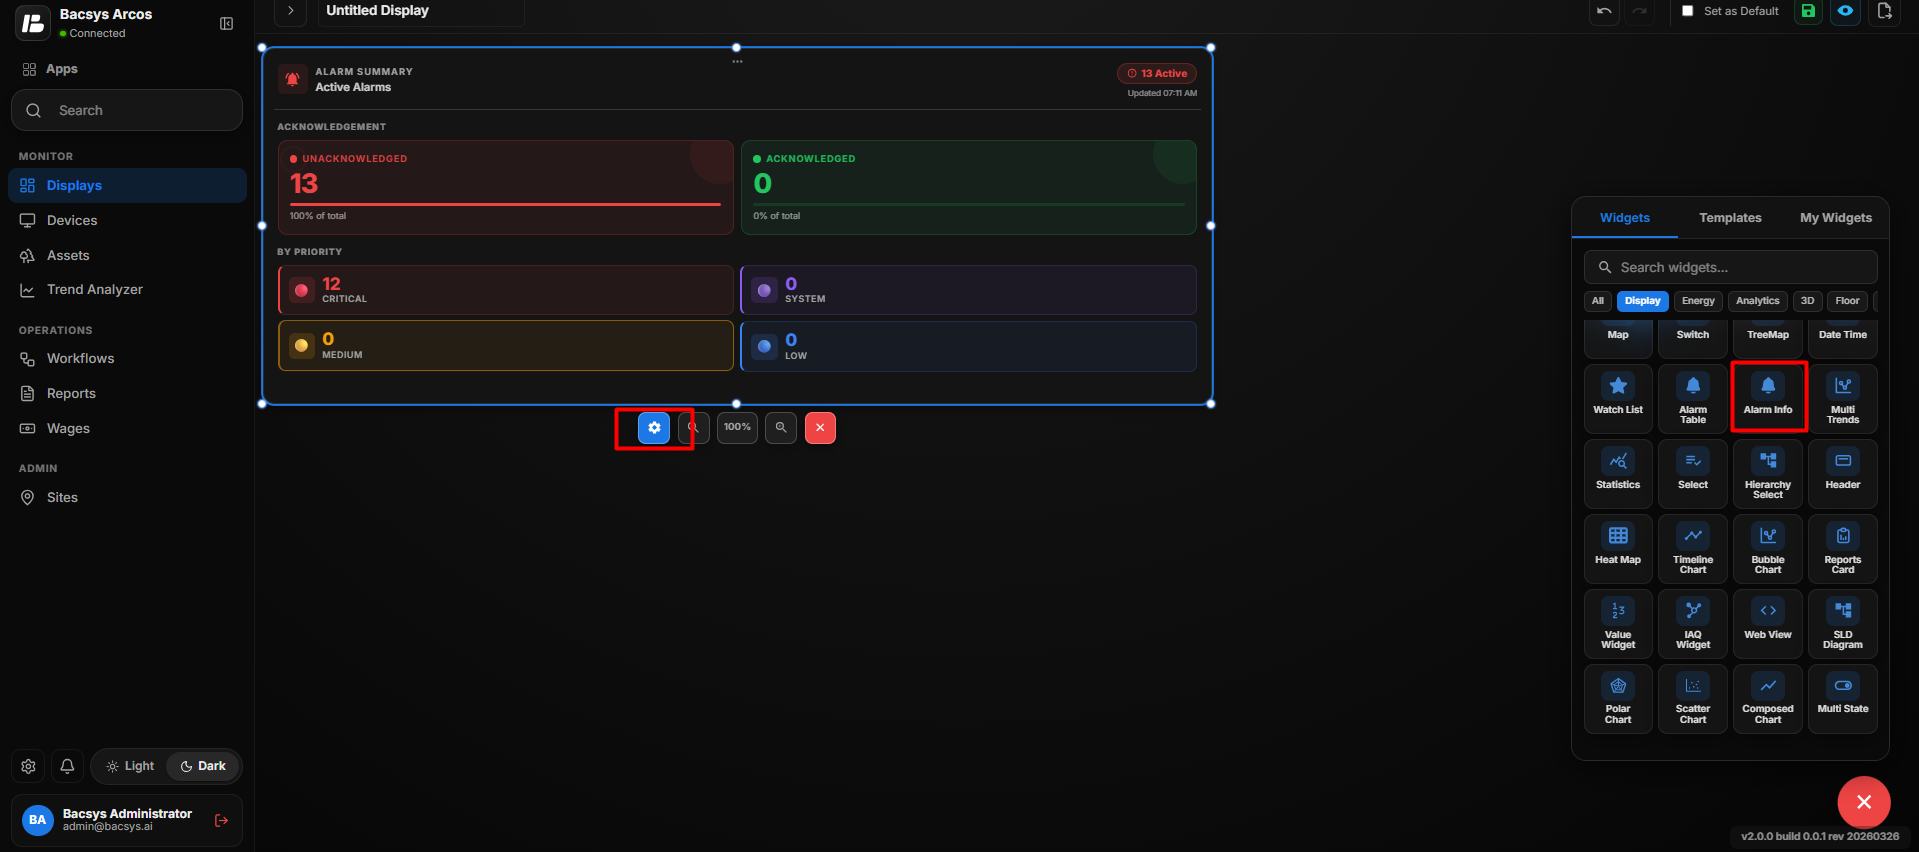
Alarm Info Widget Settings
| Option | Description |
|---|---|
| Title | Enter a title for the Alarm Info Widget. |
| Subtitle | Enter an optional subtitle to provide additional information about the alarm summary. |
| Select Point | Select the point whose alarm information should be displayed. Click Browse Hierarchy to navigate through Network → Device → Point and select the required point. |
| Poll Frequency (Seconds) | Specify how frequently the widget retrieves or refreshes the alarm information. |
| Show Background | Use the toggle button to show or hide the widget background. |
| Hide Header | Use the toggle button to show or hide the widget header, including the title and subtitle. |
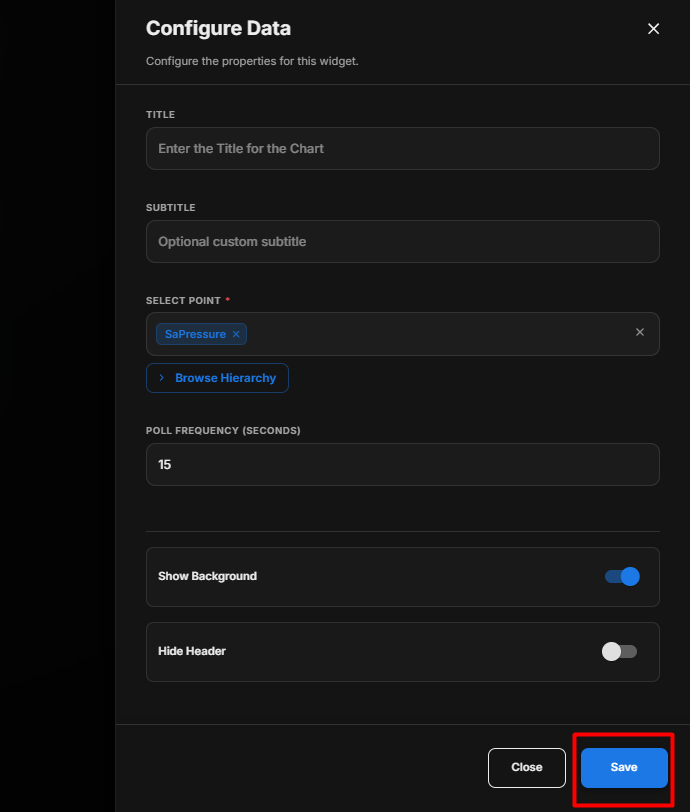
Configure the Alarm Info Widget
- Enter the required Title.
- Enter an optional Subtitle.
- Under Select Point, click Browse Hierarchy.
- Navigate through Network → Device → Point.
- Select the required point.
- Set the required Poll Frequency (Seconds).
- Configure Show Background according to your requirement.
- Configure Hide Header according to your requirement.
- Review all the configured settings.
- Click Save.
Alarm Information Display
After the widget is configured, it provides an Alarm Summary that allows users to quickly understand the current alarm condition.
The widget displays information such as:
| Information | Description |
|---|---|
| Active Alarms | Displays the total number of currently active alarms. |
| Unacknowledged | Displays the number of active alarms that have not yet been acknowledged. |
| Acknowledged | Displays the number of active alarms that have already been acknowledged. |
| Critical | Displays the number of critical-priority alarms. |
| Medium | Displays the number of medium-priority alarms. |
| System | Displays the number of system-priority alarms. |
| Low | Displays the number of low-priority alarms. |
Alarm Summary
The Alarm Info Widget provides a quick visual overview of the alarm status.
For example:
- Unacknowledged: 13
- Acknowledged: 0
- Critical: 12
- Medium: 0
- System: 0
- Low: 0
The displayed values are updated according to the configured Poll Frequency.
Save the Configuration
After clicking Save, the Alarm Info Widget is updated on the display with the selected point and configured alarm monitoring settings.
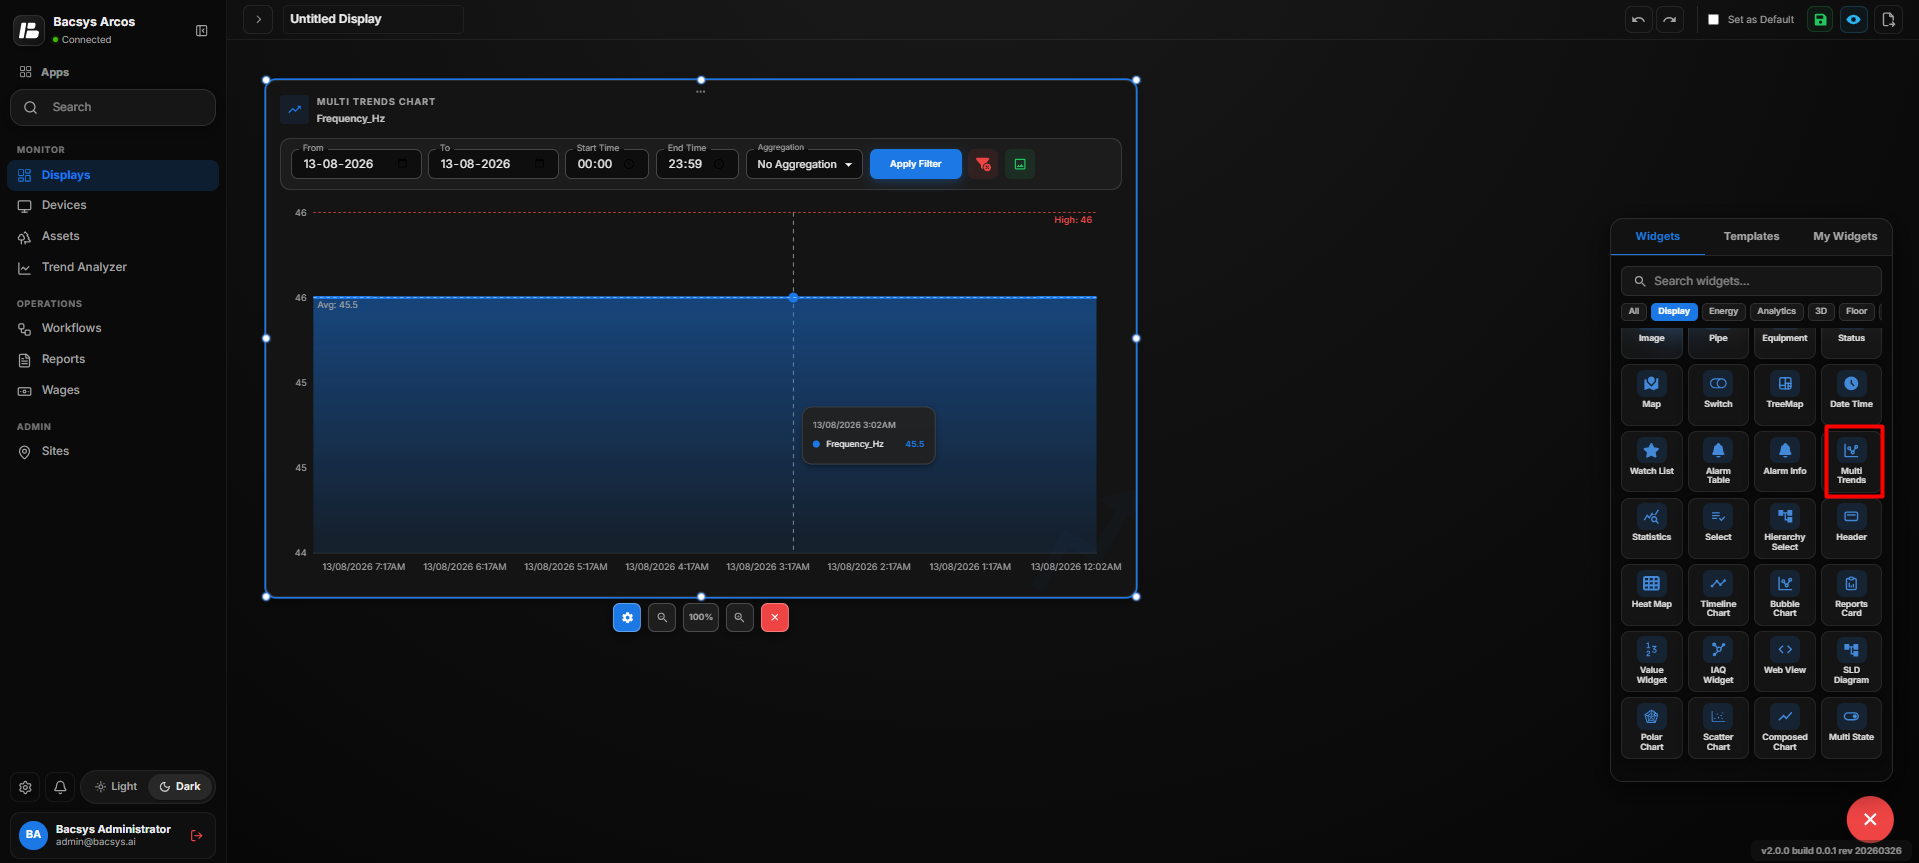
Add and Configure the Multi Trends Widget
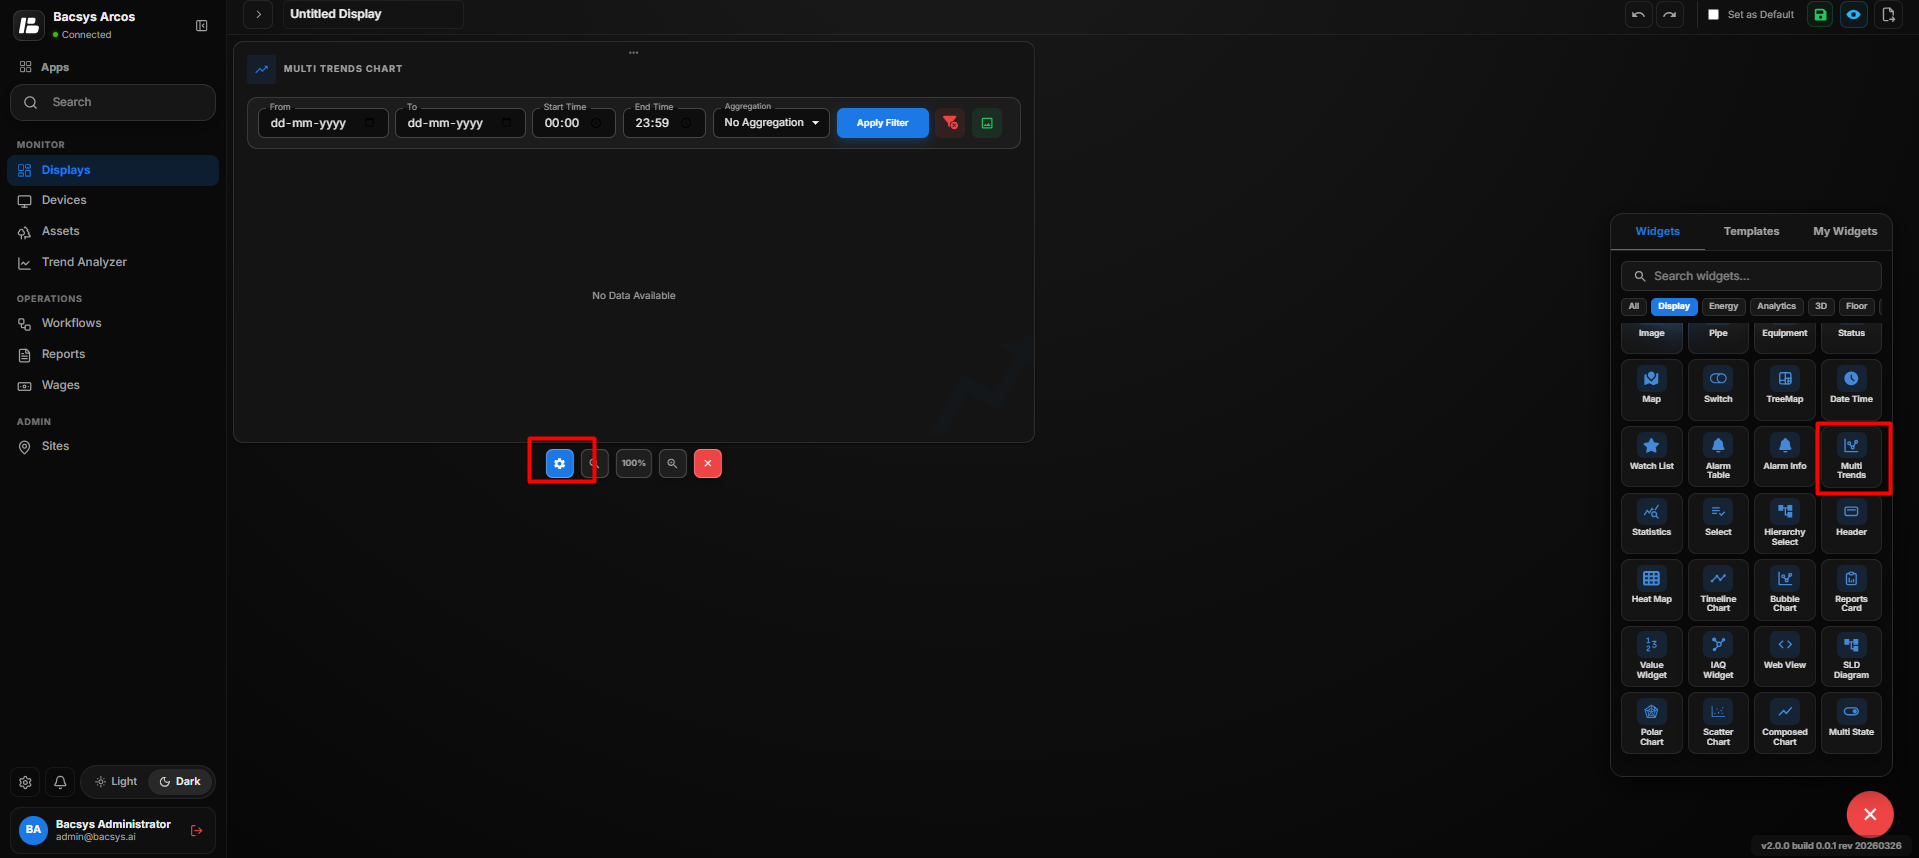
The Multi Trends Widget is used to display trend data for multiple points in a single widget. It allows users to select multiple points and view their trend information together.
Note: Only points that have trend data available can be selected for the Multi Trends Widget.
Add the Multi Trends Widget
- Click the + icon.
- Drag and drop the Multi Trends Widget onto the display.
- Select the Multi Trends Widget to view the available widget actions:
- Zoom In
- Zoom Out
- Settings
- Remove Widget
- Click Settings to open the Configure Data panel.
Multi Trends Widget Settings
| Option | Description |
|---|---|
| Title | Enter a title for the Multi Trends Widget. |
| Subtitle | Enter an optional subtitle to provide additional information about the trends. |
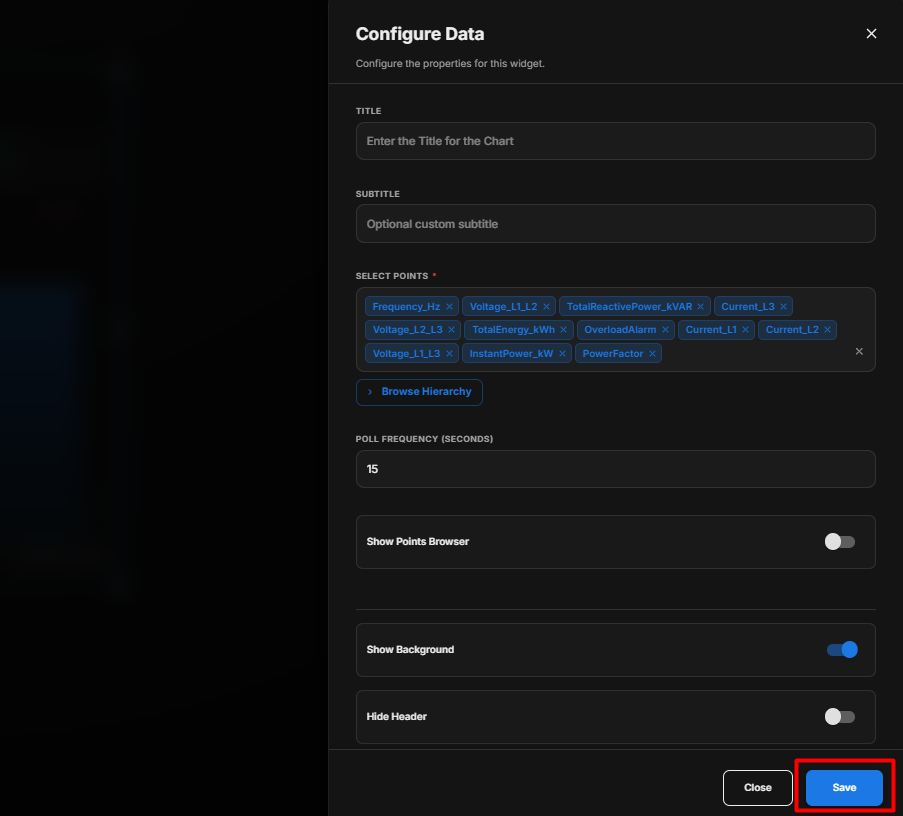
| Select Points | Select the points that should be displayed in the trend chart. Only points with trend data available should be selected. Click Browse Hierarchy to navigate through Network → Device → Point and select the required points. |
| Poll Frequency (Seconds) | Specify how frequently the widget retrieves or refreshes the selected point data. |
| Show Points Browser | Enable the toggle to display the points browser, allowing users to view or select the available trend points. |
| Show Background | Use the toggle button to show or hide the widget background. |
| Hide Header | Use the toggle button to show or hide the widget header, including the title and subtitle. |
Select Points for Multi Trends
When selecting points for the Multi Trends Widget:
- Click Browse Hierarchy.
- Navigate through Network → Device → Point.
- Select the required points.
- Make sure that the selected points have trend data available.
- Points without available trend data should not be used for the Multi Trends Widget.
- Review the selected points before saving the configuration.
Configure the Multi Trends Widget
- Enter the required Title.
- Enter an optional Subtitle.
- Under Select Points, click Browse Hierarchy.
- Navigate through Network → Device → Point.
- Select the required trend-enabled points.
- Set the required Poll Frequency (Seconds).
- Enable Show Points Browser if the points browser should be visible.
- Configure Show Background according to your requirement.
- Configure Hide Header according to your requirement.
- Review all the configured settings.
- Click Save.
Trend Availability
The Multi Trends Widget requires trend data for the selected points.
| Point Condition | Multi Trends Behavior |
|---|---|
| Trend Available | The point can be selected and its trend data can be displayed. |
| Trend Not Available | The point does not have trend data available and should not be selected for trend visualization. |
Save the Configuration
After clicking Save, the Multi Trends Widget displays the trend data of the selected trend-enabled points together in the widget.
Add and Configure the Statistic Widget
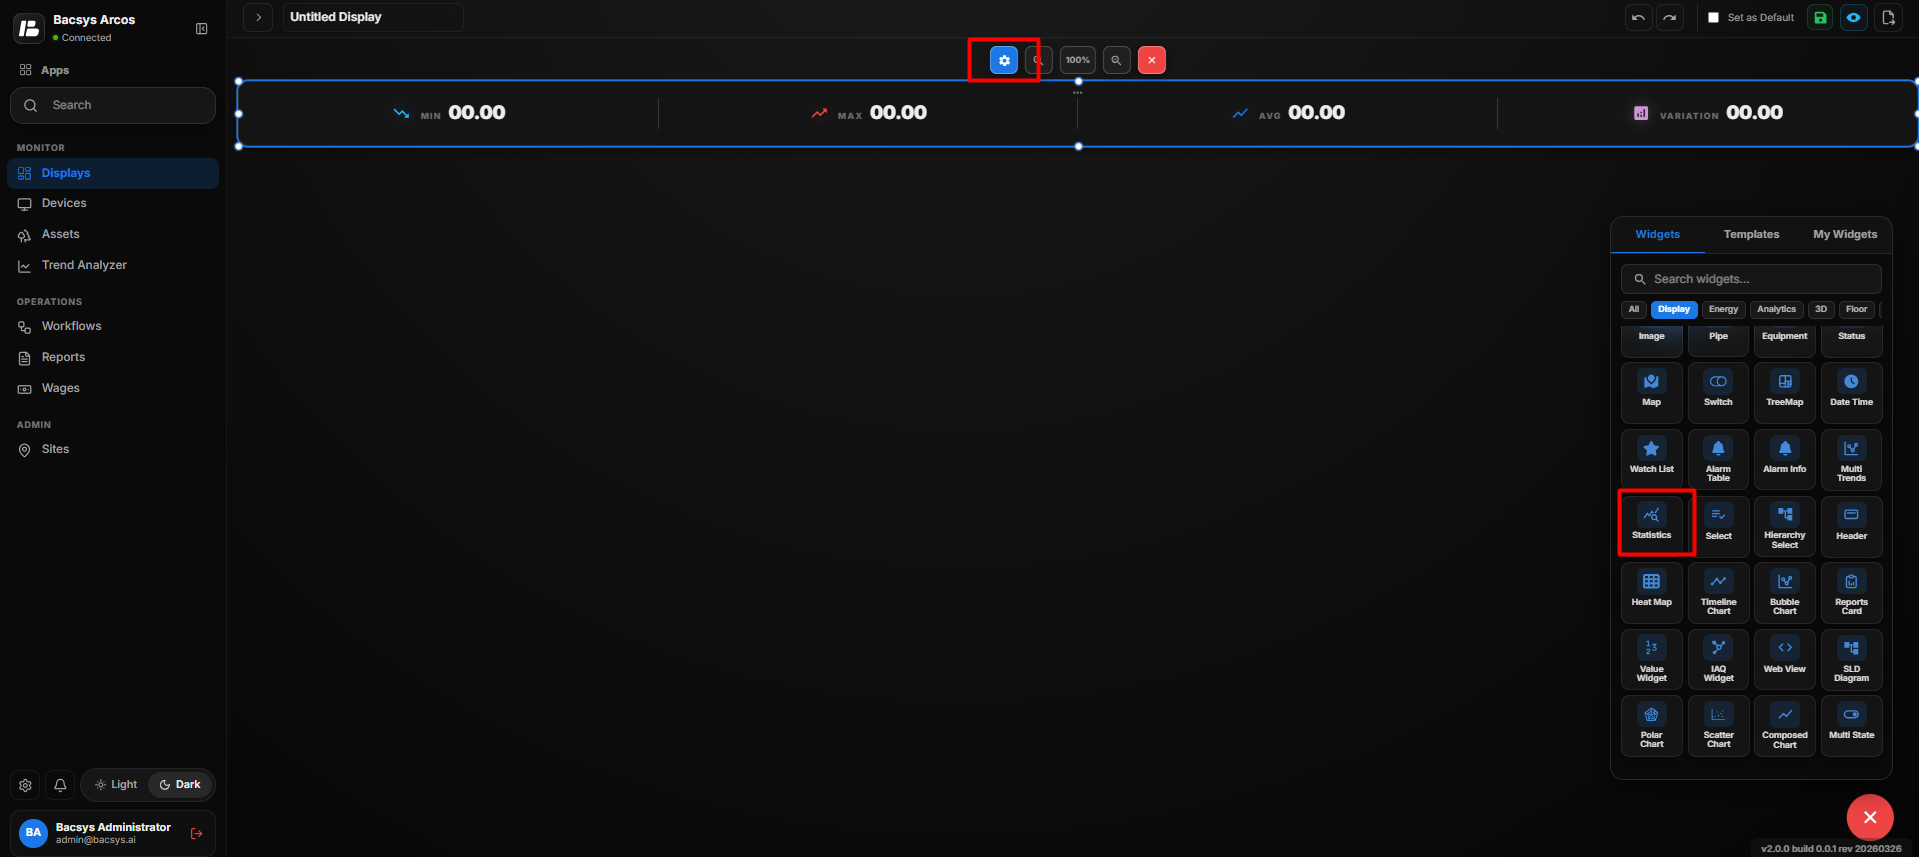
The Statistic Widget is used to display statistical information for a selected point. It provides key values such as the Minimum (MIN), Maximum (MAX), Average (AVG), and Variation for the selected point over a specified date.
Add the Statistic Widget
- Click the + icon.
- Drag and drop the Statistic Widget onto the display.
- Select the Statistic Widget to view the available widget actions:
- Zoom In
- Zoom Out
- Settings
- Remove Widget
- Click Settings to open the Configure Data panel.
Statistic Widget Settings
| Option | Description |
|---|---|
| Title | Enter a title for the Statistic Widget. |
| Select Point | Select the point for which statistical information should be displayed. Click Browse Hierarchy to navigate through Network → Device → Point and select the required point. |
| Select Interval | Select the time interval used to calculate the statistics. The available interval shown is Day Wise. |
| Date | Select the date for which the statistical values should be calculated. Enter the date in DD-MM-YYYY format or use the calendar picker. |
| Show Background | Use the toggle button to show or hide the widget background. |
| Hide Header | Use the toggle button to show or hide the widget header. |
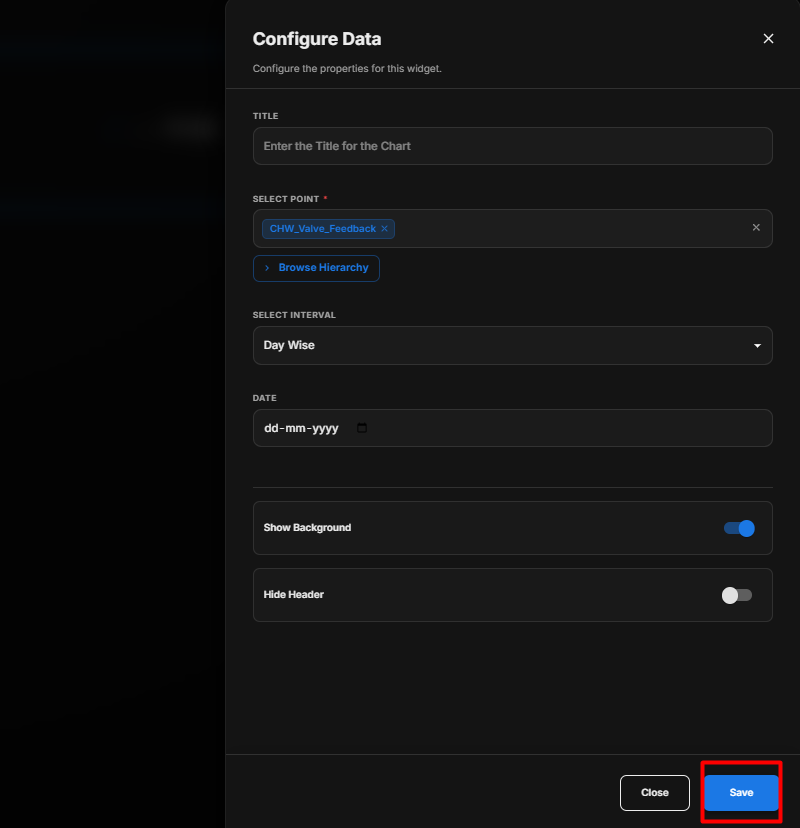
Configure the Statistic Widget
- Enter the required Title.
- Under Select Point, click Browse Hierarchy.
- Navigate through Network → Device → Point.
- Select the required point.
- Under Select Interval, select Day Wise.
- Select the required Date using the date field or calendar picker.
- Configure Show Background according to your requirement.
- Configure Hide Header according to your requirement.
- Review all the configured settings.
- Click Save.
Statistic Information
After saving the configuration, the Statistic Widget displays the calculated statistics for the selected point and date.
| Statistic | Description |
|---|---|
| MIN | Displays the minimum value recorded for the selected point during the selected interval. |
| MAX | Displays the maximum value recorded for the selected point during the selected interval. |
| AVG | Displays the average value recorded for the selected point during the selected interval. |
| VARIATION | Displays the variation calculated from the selected point's data during the selected interval. |
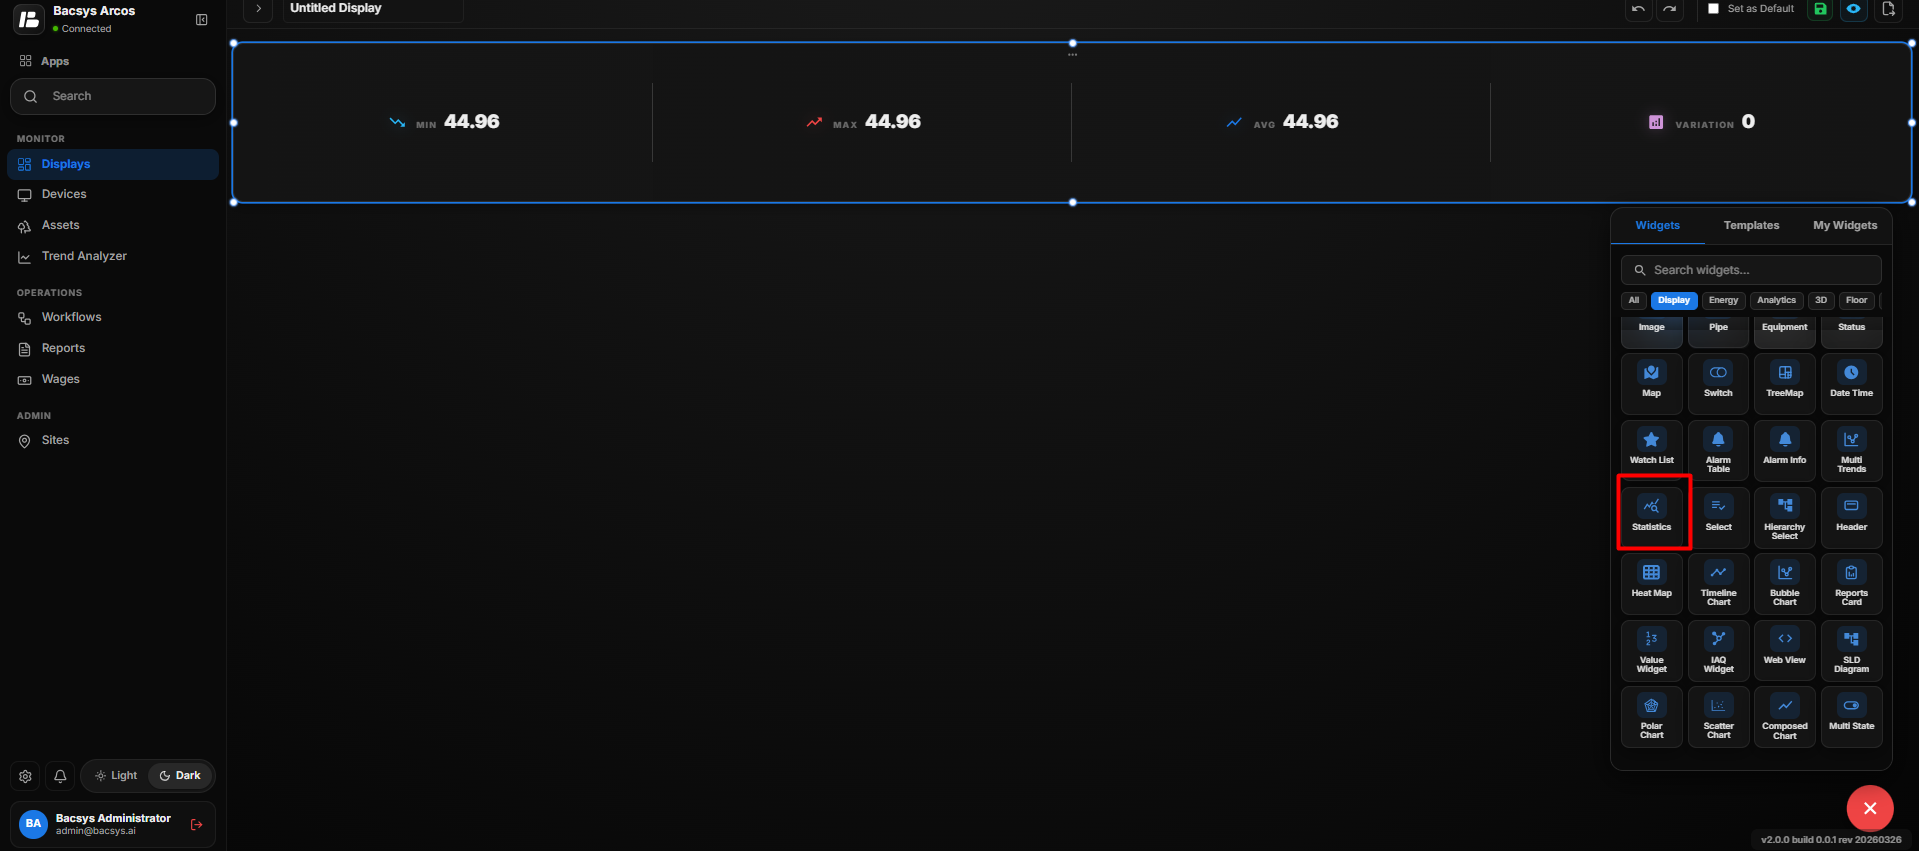
Save the Configuration
After clicking Save, the Statistic Widget is updated on the display and shows the Minimum, Maximum, Average, and Variation values based on the selected point, interval, and date.
Add and Configure the Select Widget
The Select Widget is used to display one or more selected display pages directly within the widget. Users can select the required displays from the available display list.
Add the Select Widget
- Click the + icon.
- Drag and drop the Select Widget onto the display.
- Select the Select Widget to view the available widget actions:
- Zoom In
- Zoom Out
- Settings
- Remove Widget
- Click Settings to open the Configure Data panel.
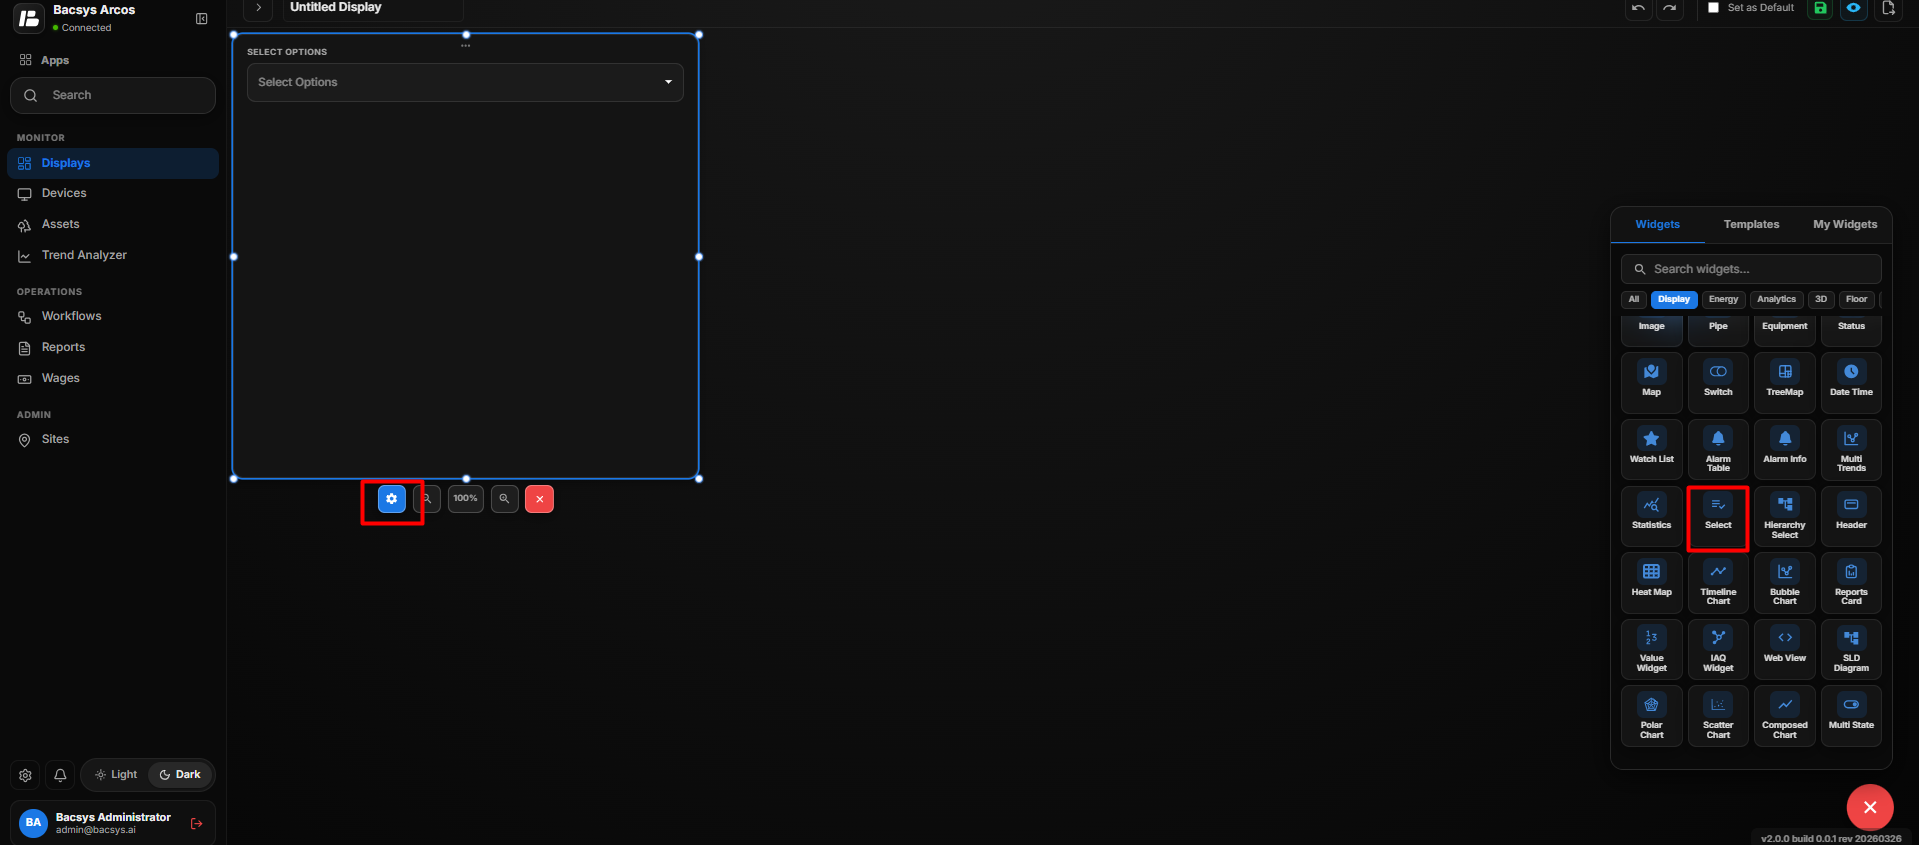
Select Widget Settings
| Option | Description |
|---|---|
| Title | Enter a title for the Select Widget. |
| Select Display Page | Select the display pages that should be shown in the widget. Use the search field to find the required displays and select them from the available list. |
| Show Background | Use the toggle button to show or hide the widget background. |
| Hide Header | Use the toggle button to show or hide the widget header, including the title. |
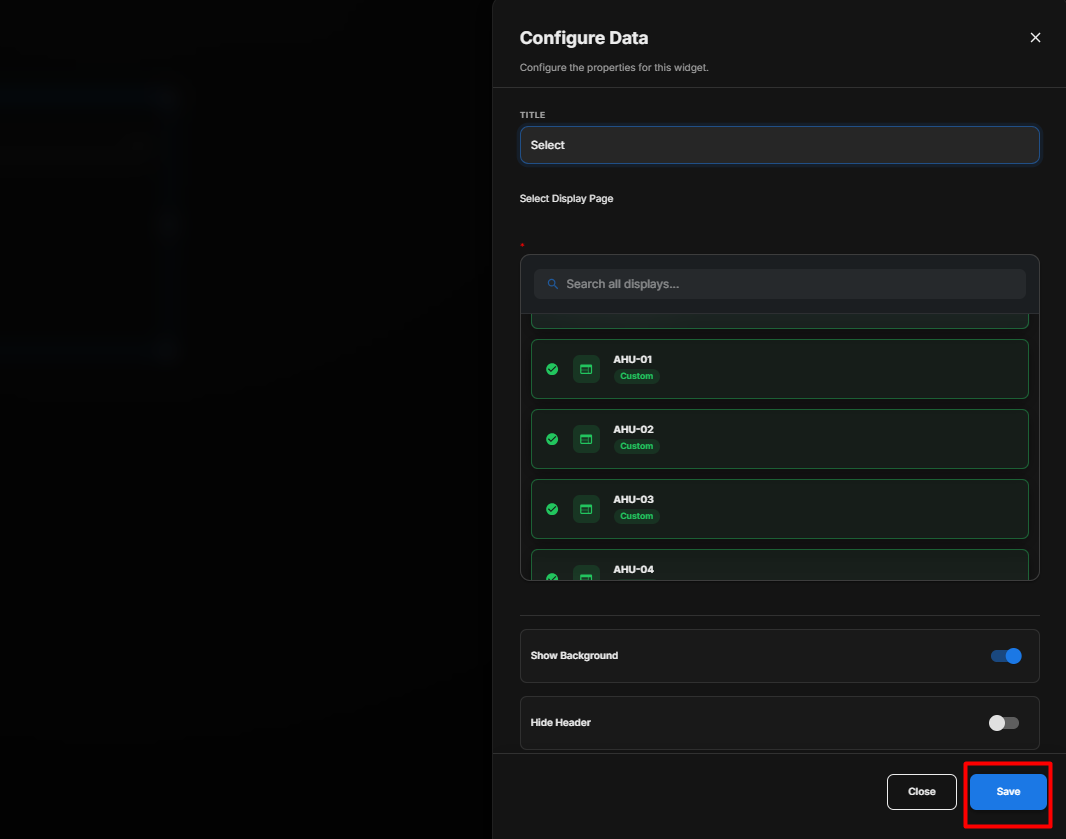
Select Display Pages
- Under Select Display Page, use the search field to find the required display.
- Select the display from the available list.
- You can select multiple display pages.
- Each selected display is added to the widget.
- The number of displays selected in the configuration determines how many displays are displayed in the Select Widget.
Configure the Select Widget
- Enter the required Title.
- Under Select Display Page, search for the required display.
- Select one or more display pages from the list.
- Configure Show Background according to your requirement.
- Configure Hide Header according to your requirement.
- Review the selected display pages.
- Click Save.
Display Behavior
The Select Widget displays the selected display pages within the widget.
For example, if you select:
- AHU-01
- AHU-02
- AHU-03
- AHU-04
the widget displays all four selected display pages.
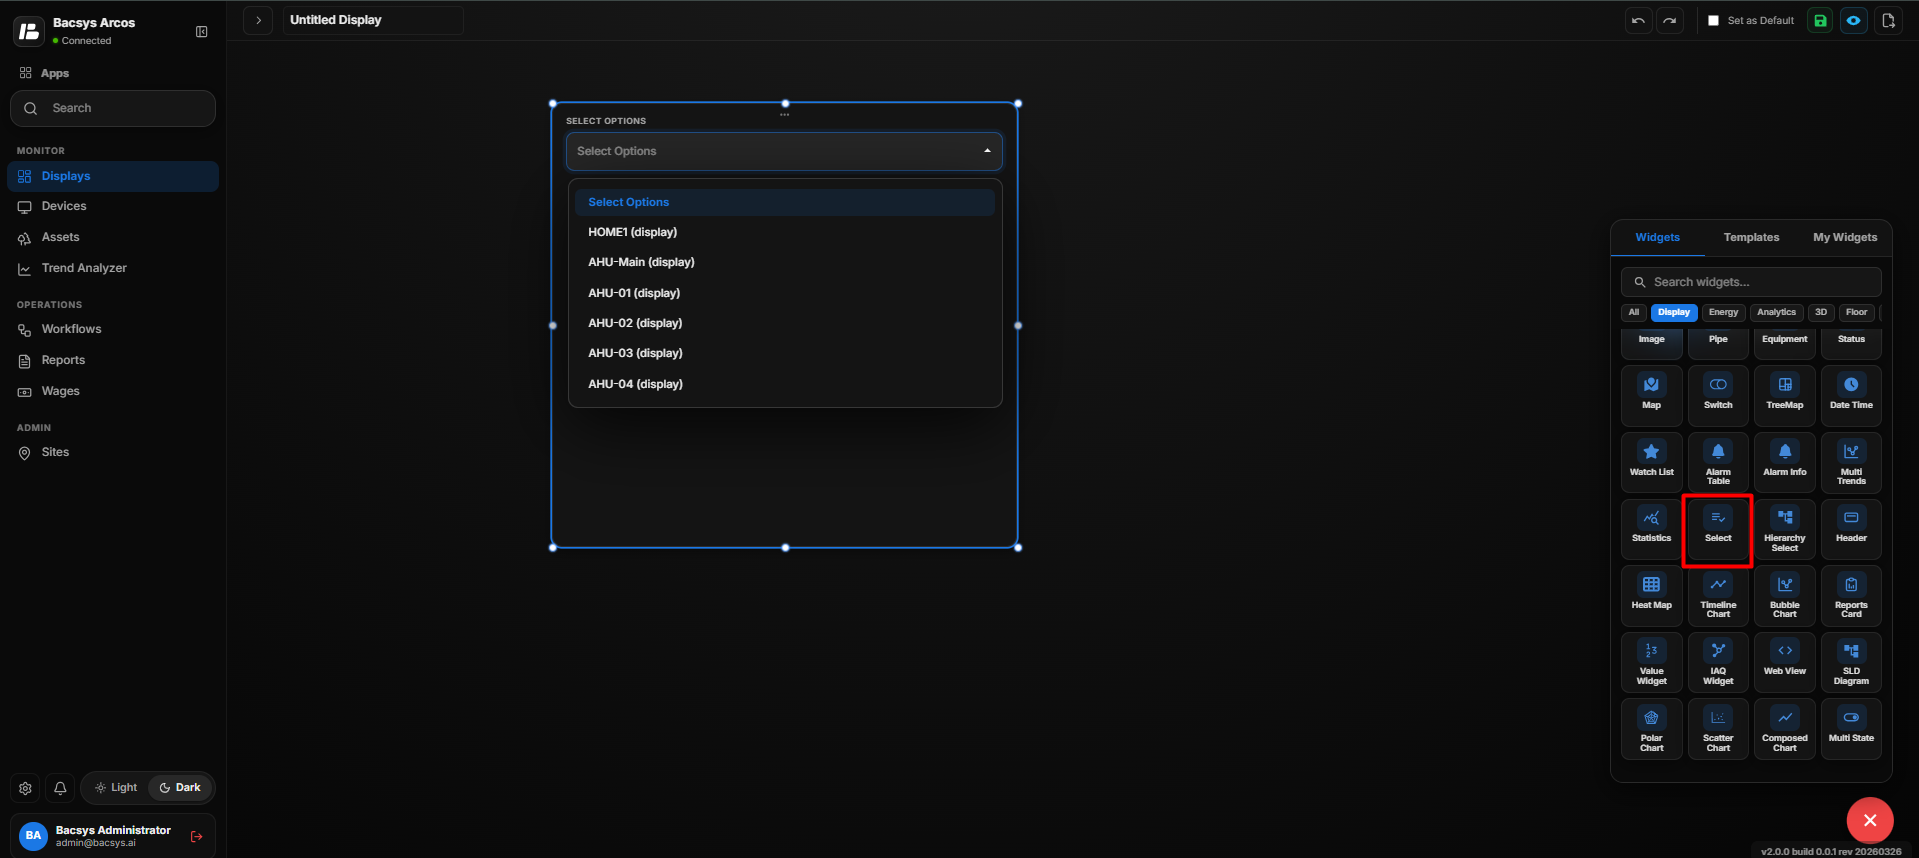
Note: The number of displays shown in the Select Widget depends on the number of display pages selected under Select Display Page.
Save the Configuration
After clicking Save, the Select Widget is updated on the display and shows the selected display pages according to the configured settings.
Add and Configure the Hierarchy Select Widget
The Hierarchy Select Widget is used to organize and navigate multiple displays in a structured hierarchy. It allows users to add dashboards, create folders, arrange displays, and choose how the hierarchy is displayed.
The widget provides two View Types:
- Tree View
- Dropdown
Add the Hierarchy Select Widget
- Click the + icon.
- Drag and drop the Hierarchy Select Widget onto the display.
- Select the Hierarchy Select Widget to view the available widget actions:
- Zoom In
- Zoom Out
- Settings
- Remove Widget
- Click Settings to open the Configure Data panel.
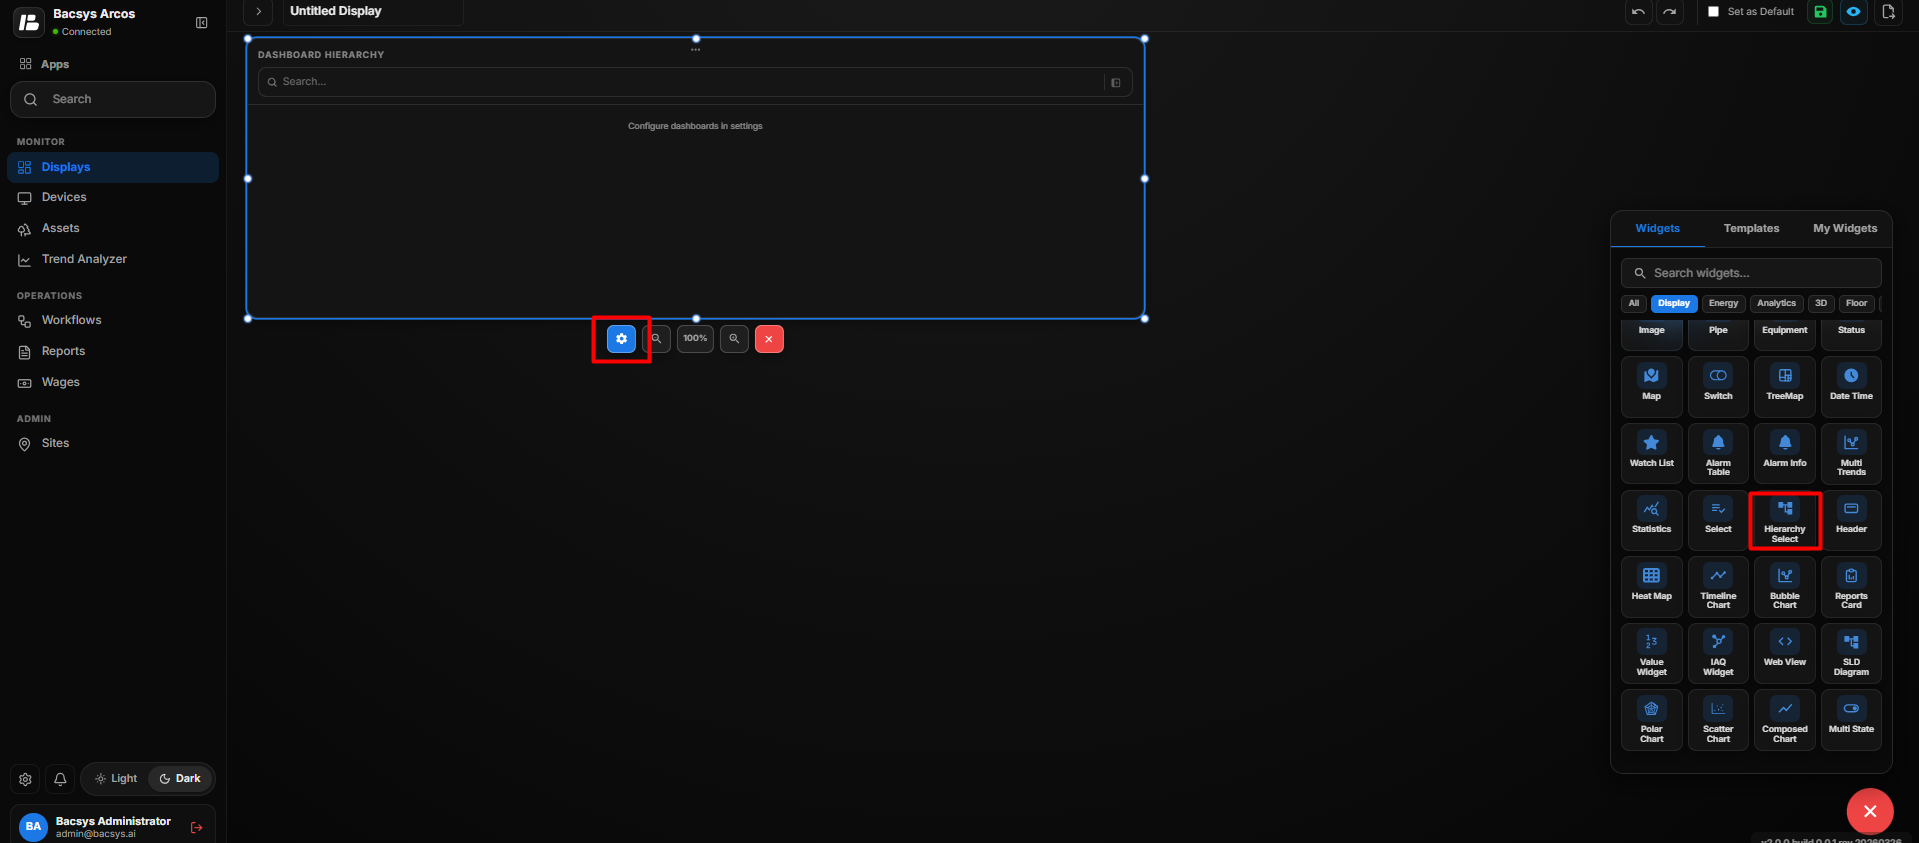
Hierarchy Select Widget Settings
| Option | Description |
|---|---|
| Widget Title | Enter a title for the widget, such as Site Navigation. |
| View Type | Select how the configured displays should be presented. The available options are Tree View and Dropdown. |
| Add Folder | Enter a folder name and click + Folder to create a folder in the hierarchy. |
| Hierarchy | Displays the configured folders and dashboards. The hierarchy can be organized and reordered as required. |
| Add Dashboards | Search for and select the displays that should be added to the hierarchy. |
| Show Background | Use the toggle button to show or hide the widget background. |
| Hide Header | Use the toggle button to show or hide the widget header. |
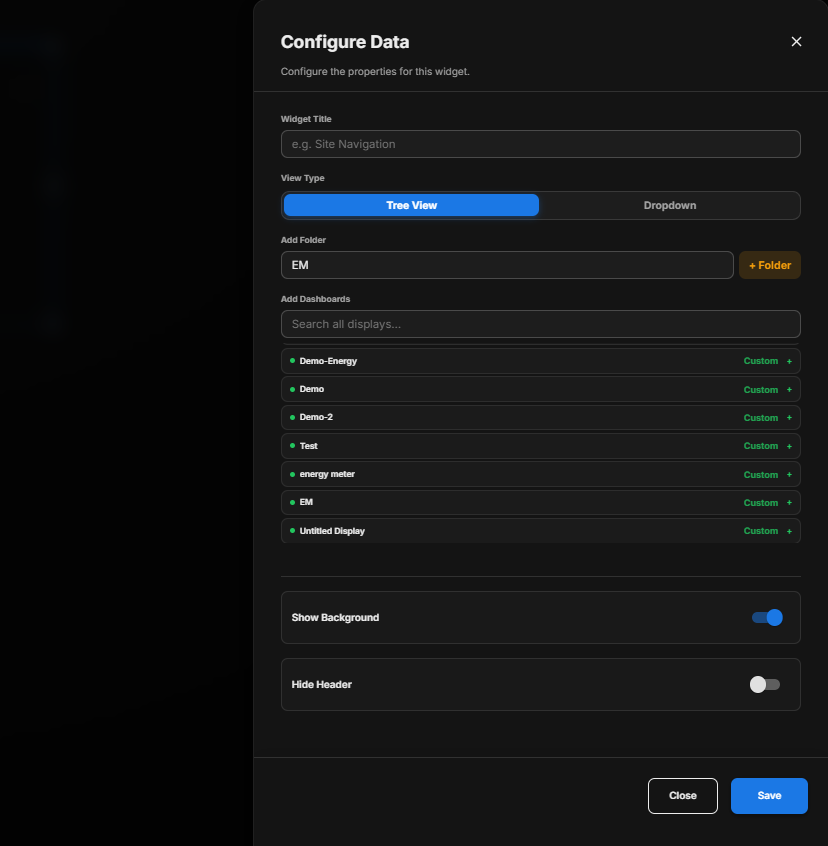
Add Dashboards
The Add Dashboards section allows you to select the displays that should be available in the Hierarchy Select Widget.
- Use the Search all displays field to find the required display.
- Select the required display by clicking the + icon next to it.
- The selected display is added to the hierarchy.
- Repeat the process to add multiple displays.
- Review the selected displays before saving.
For example, the following displays can be added:
- HOME1
- AHU-Main
- AHU-01
- AHU-02
- AHU-03
- AHU-04
- AHU-05
Add Folder
The Add Folder option allows you to create folders directly within the Hierarchy Select Widget. Folders can be used to organize dashboards and displays into a structured hierarchy.
- Enter the required folder name in the Folder Name field.
- Click + Folder.
- The folder is added to the hierarchy.
- Add the required dashboards to the hierarchy.
- Organize the dashboards under the appropriate folder.
- Click Save to apply the configuration.
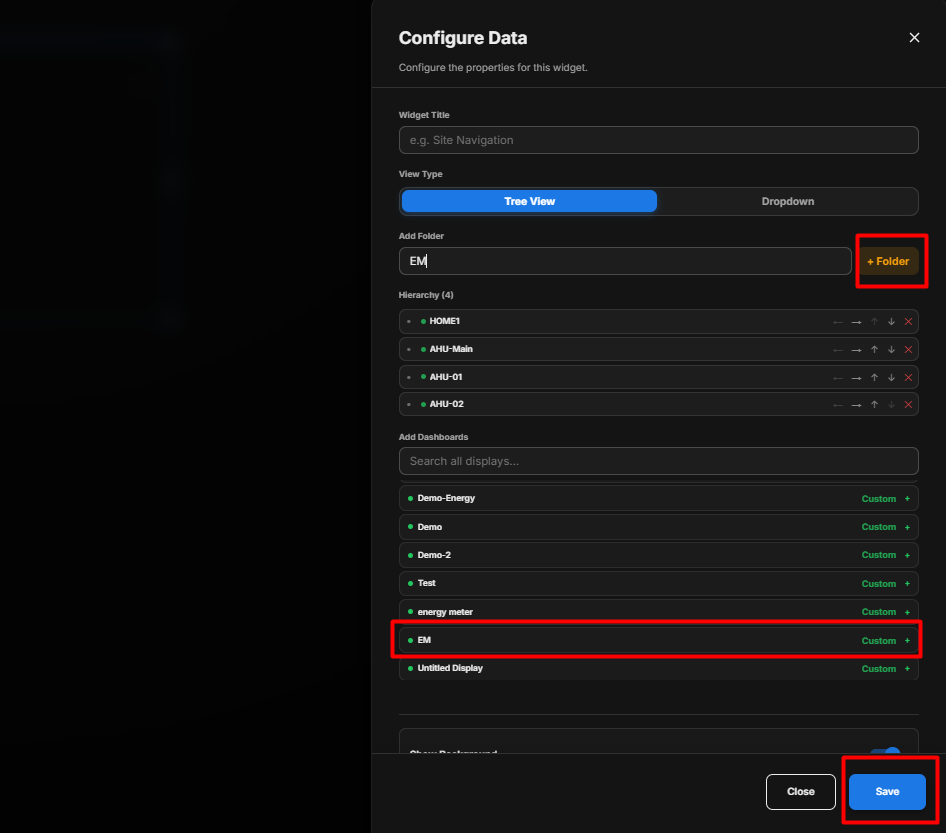
Note: A folder is added only when you click + Folder. Entering a folder name without clicking + Folder does not add the folder.
Organize the Hierarchy
After adding folders and dashboards, the Hierarchy section displays the configured items.
You can use the available hierarchy controls to:
- Move an item to the left.
- Move an item to the right.
- Move an item upward.
- Move an item downward.
- Remove an item from the hierarchy.
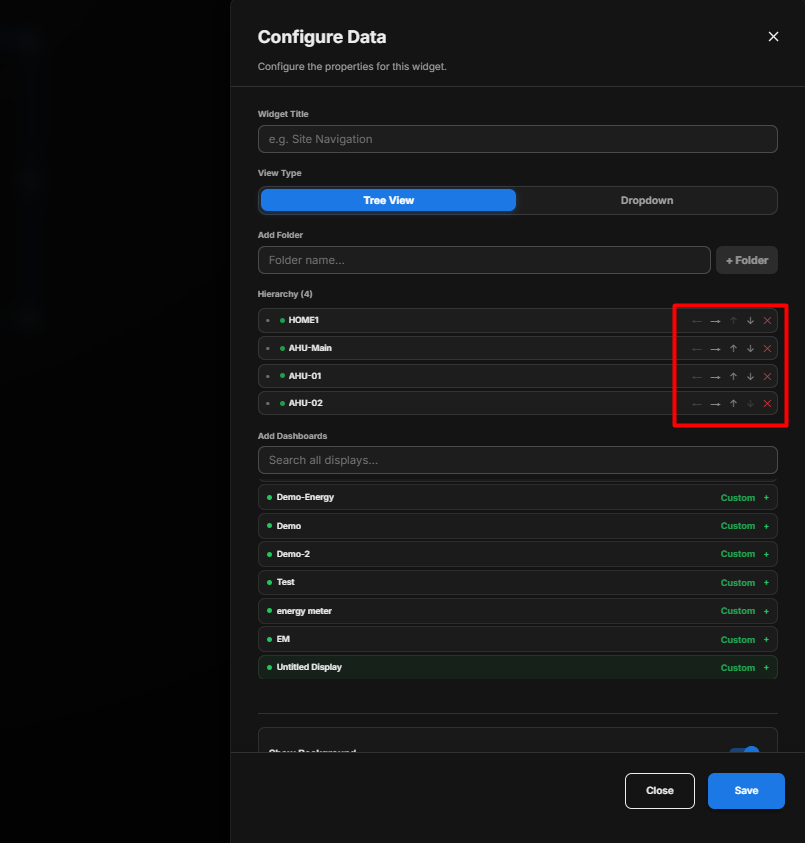
This allows you to create the required structure for navigating between displays.
View Type: Tree View
When Tree View is selected, the configured dashboards and folders are displayed as a hierarchical tree structure, allowing the user to view and navigate through the selected displays.
Configure Tree View
- Under View Type, select Tree View.
- Add folders using Add Folder if required.
- Under Add Dashboards, search for the required displays.
- Click the + icon to add the displays.
- Organize the displays and folders in the Hierarchy section.
- Arrange the items in the required order.
- Configure Show Background according to your requirement.
- Configure Hide Header according to your requirement.
- Review the hierarchy.
- Click Save.
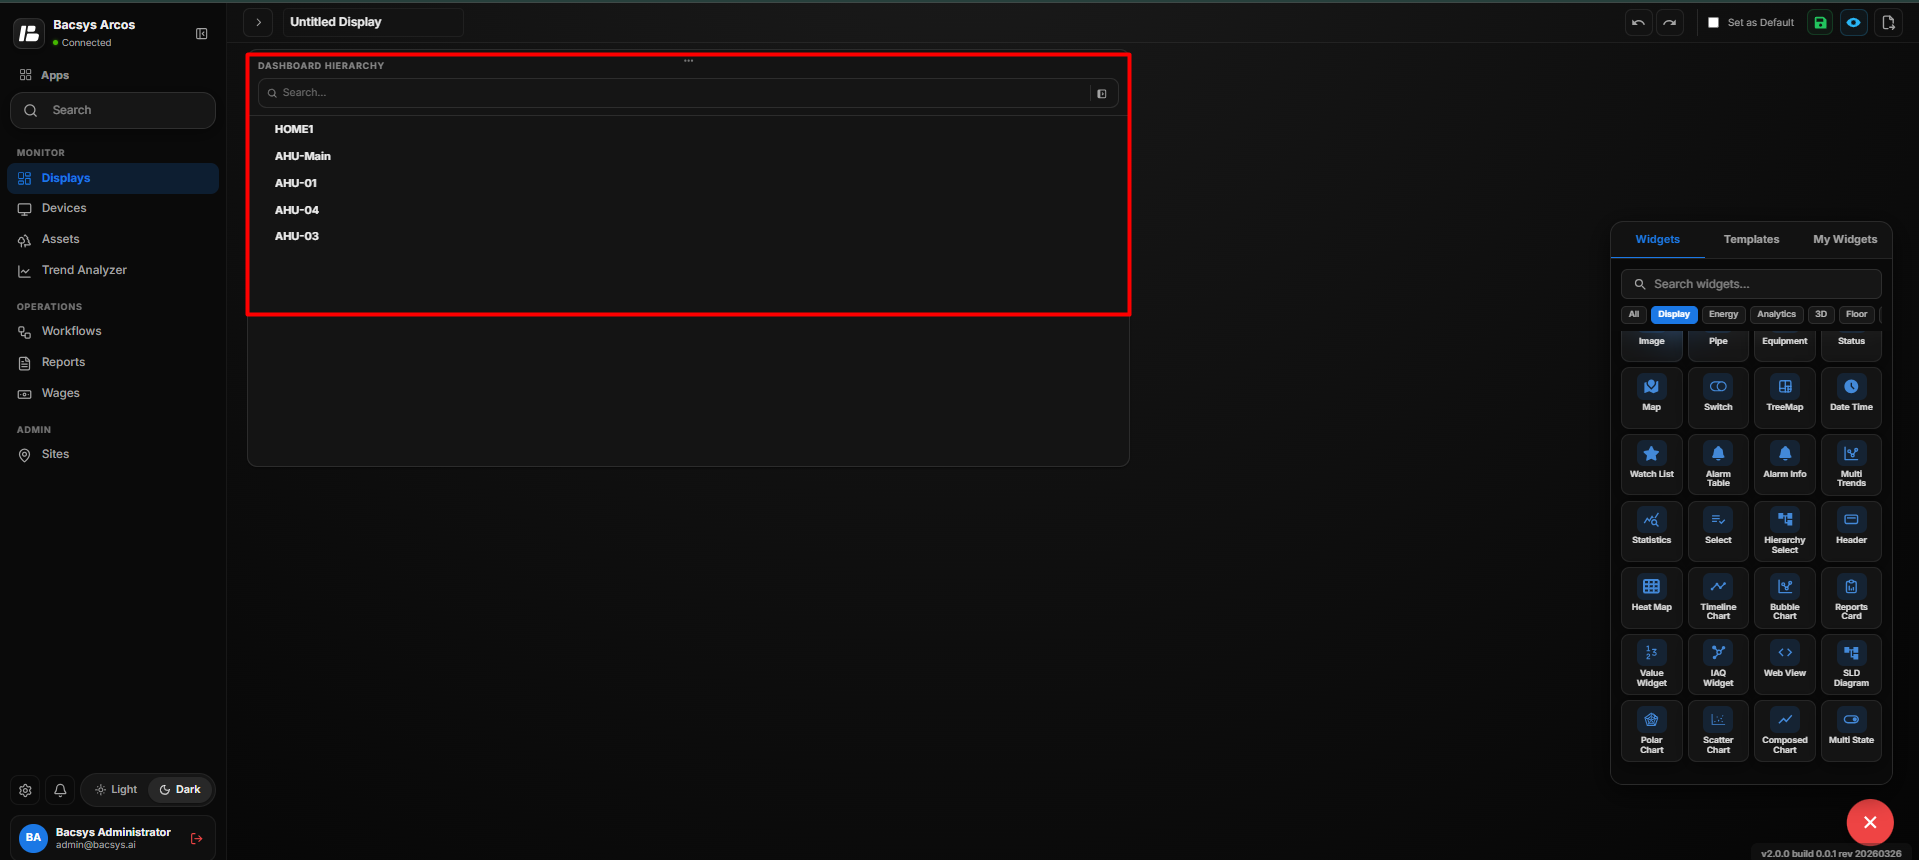
After saving, the selected displays are shown in a tree structure on the display.
Use the Tree View
- Open the Tree View hierarchy.
- View the configured folders and displays.
- If folders are configured, expand the required folder to view the displays inside it.
- Select the required display from the hierarchy.
- The selected display is opened for navigation.
Note: The displays shown in the Tree View depend on the dashboards selected under Add Dashboards and the hierarchy configured in the settings.
View Type: Dropdown
When Dropdown is selected, the configured dashboards and folders are displayed in a dropdown list, allowing the user to select and navigate to the required display.
Configure Dropdown
- Under View Type, select Dropdown.
- Add folders using Add Folder if required.
- Under Add Dashboards, search for the required displays.
- Click the + icon to add the displays.
- Organize the displays and folders in the Hierarchy section.
- Arrange the items in the required order.
- Configure Show Background according to your requirement.
- Configure Hide Header according to your requirement.
- Review the hierarchy.
- Click Save.
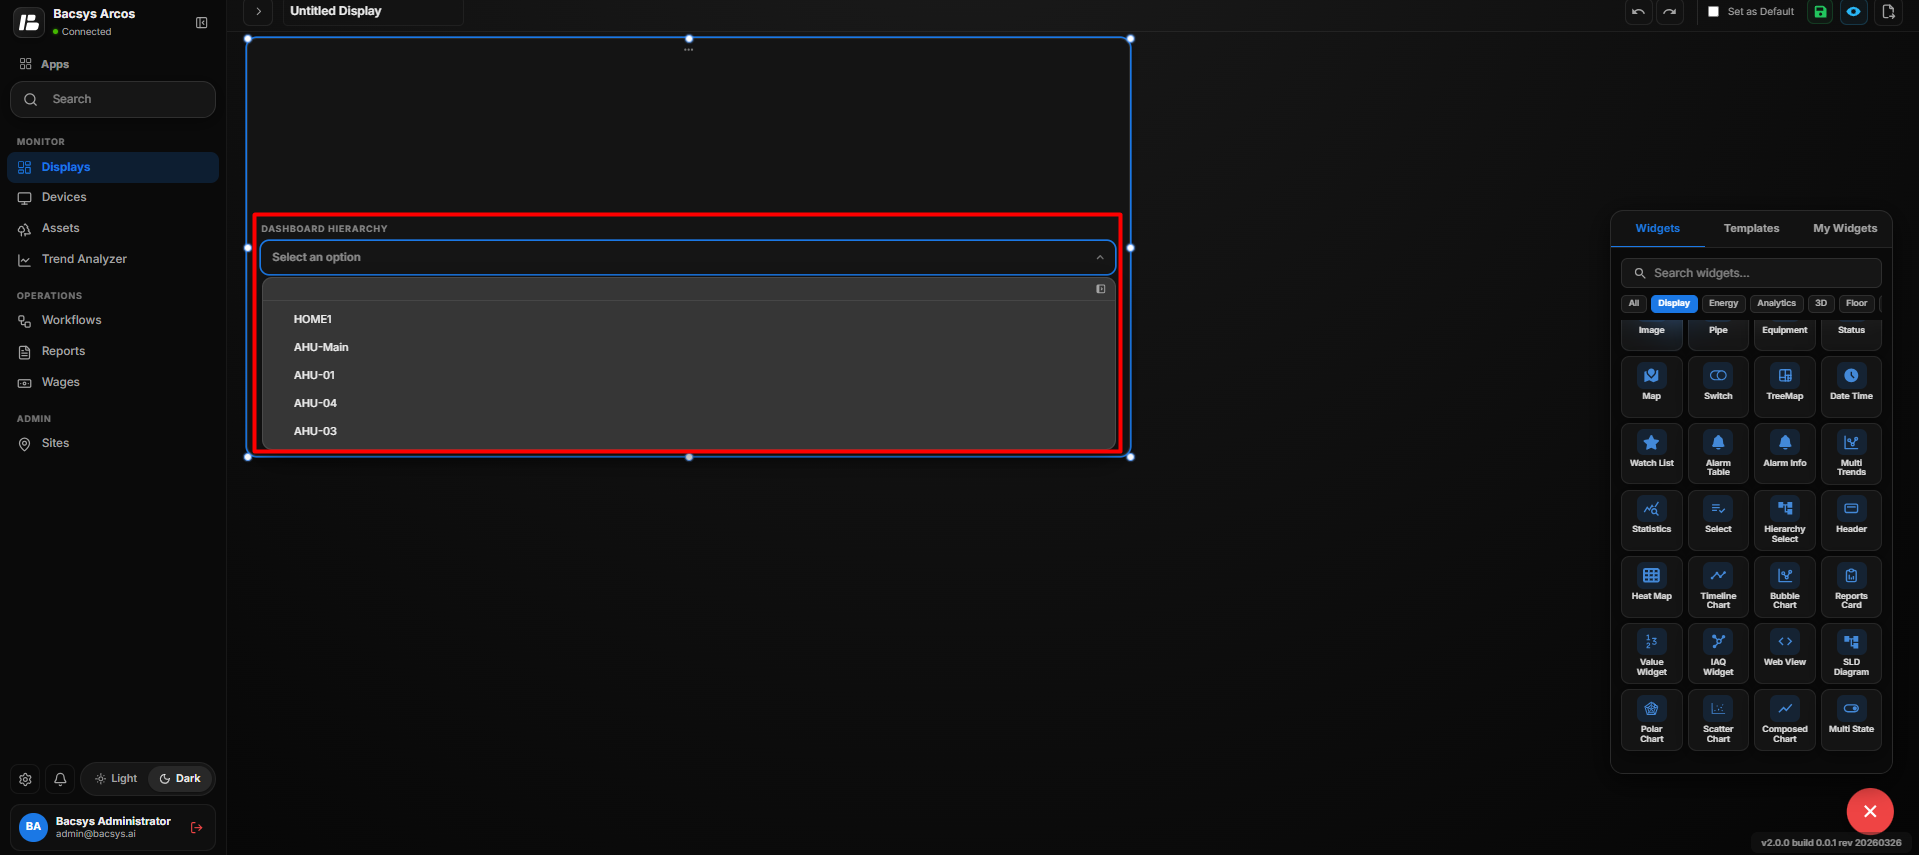
After saving, the selected displays are available in the Dashboard Hierarchy dropdown.
Use the Dropdown
- Click the Dashboard Hierarchy dropdown.
- The configured displays are displayed as a list.
- Select the required display from the list.
- The selected display is opened for navigation.
Note: The displays available in the dropdown depend on the dashboards selected under Add Dashboards.
Add and Configure the Header Widget
The Header Widget is used to display a header section on the display. When the Header Widget is dragged and dropped onto the display, it displays the configured display information along with the current date and time.
Add the Header Widget
- Click the + icon.
- Drag and drop the Header Widget onto the display.
- The Header Widget is added to the display and displays the header information along with the current date and time.
- Select the Header Widget to view the available widget actions:
- Zoom In
- Zoom Out
- Settings
- Remove Widget
- Click Settings to open the Configure Data panel.
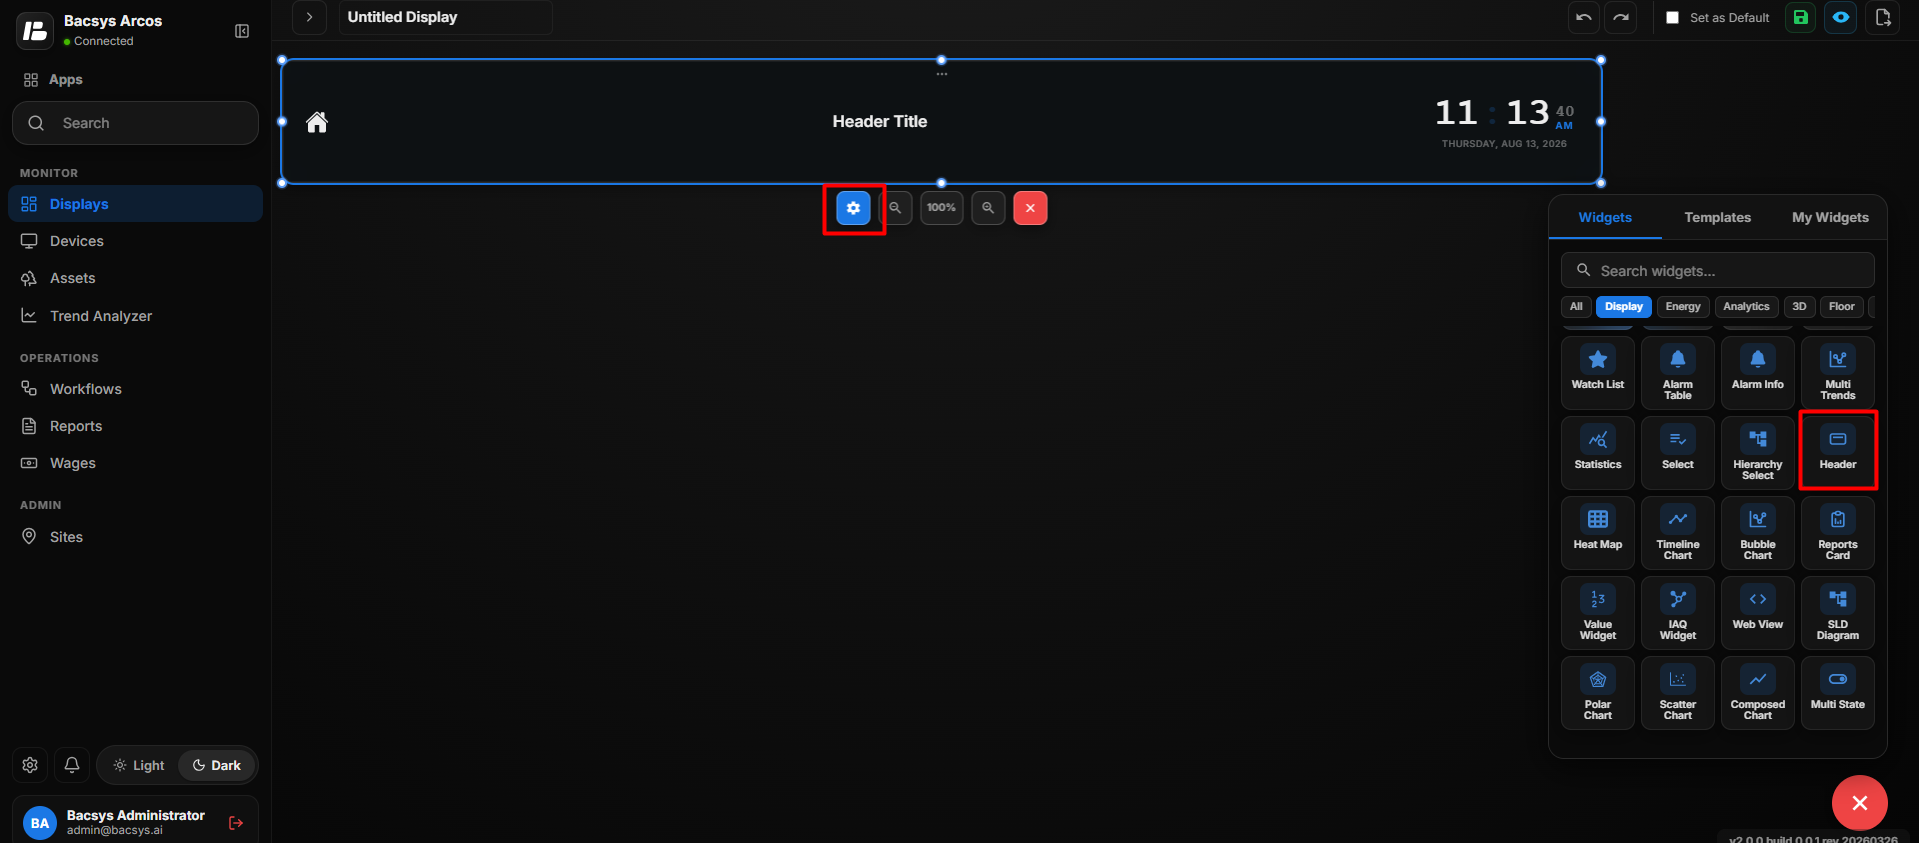
Header Widget Settings
| Option | Description |
|---|---|
| Title | Enter the title that should be displayed in the Header Widget. |
| Select Display Page | Select the display page that should be associated with the Header Widget. Use the search field to find and select the required display. |
| Button Color | Select the color used for the header navigation or display button from the available colors. |
| Image | Upload an image or logo to be displayed in the Header Widget. |
| Show Background | Use the toggle button to show or hide the widget background. |
| Hide Header | Use the toggle button to show or hide the widget header. |
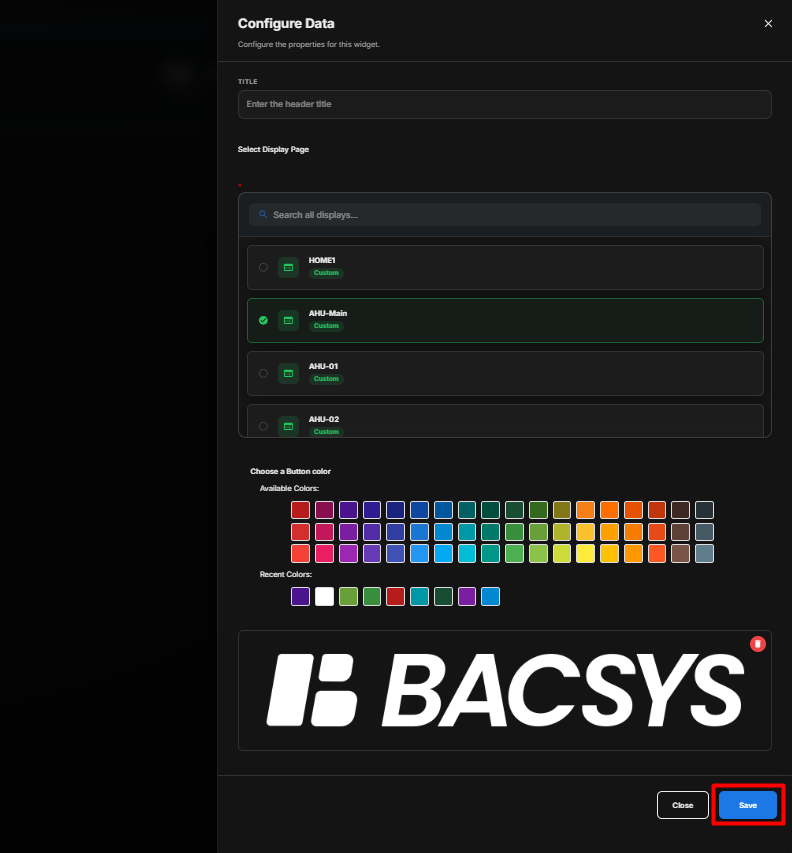
Configure the Header Widget
- Enter the required Title.
- Under Select Display Page, search for the required display.
- Select the required display page.
- Select the required Button Color.
- If required, upload an Image or logo.
- Configure Show Background according to your requirement.
- Configure Hide Header according to your requirement.
- Review all the configured settings.
- Click Save.
Date and Time Display
When the Header Widget is added to the display, the current date and time are displayed in the header.
The date and time are updated automatically so that the Header Widget always shows the current time.
Header Display
The Header Widget can display:
- Header Title
- Selected Display
- Uploaded Image or Logo
- Current Date and Time
- Navigation/Display Button
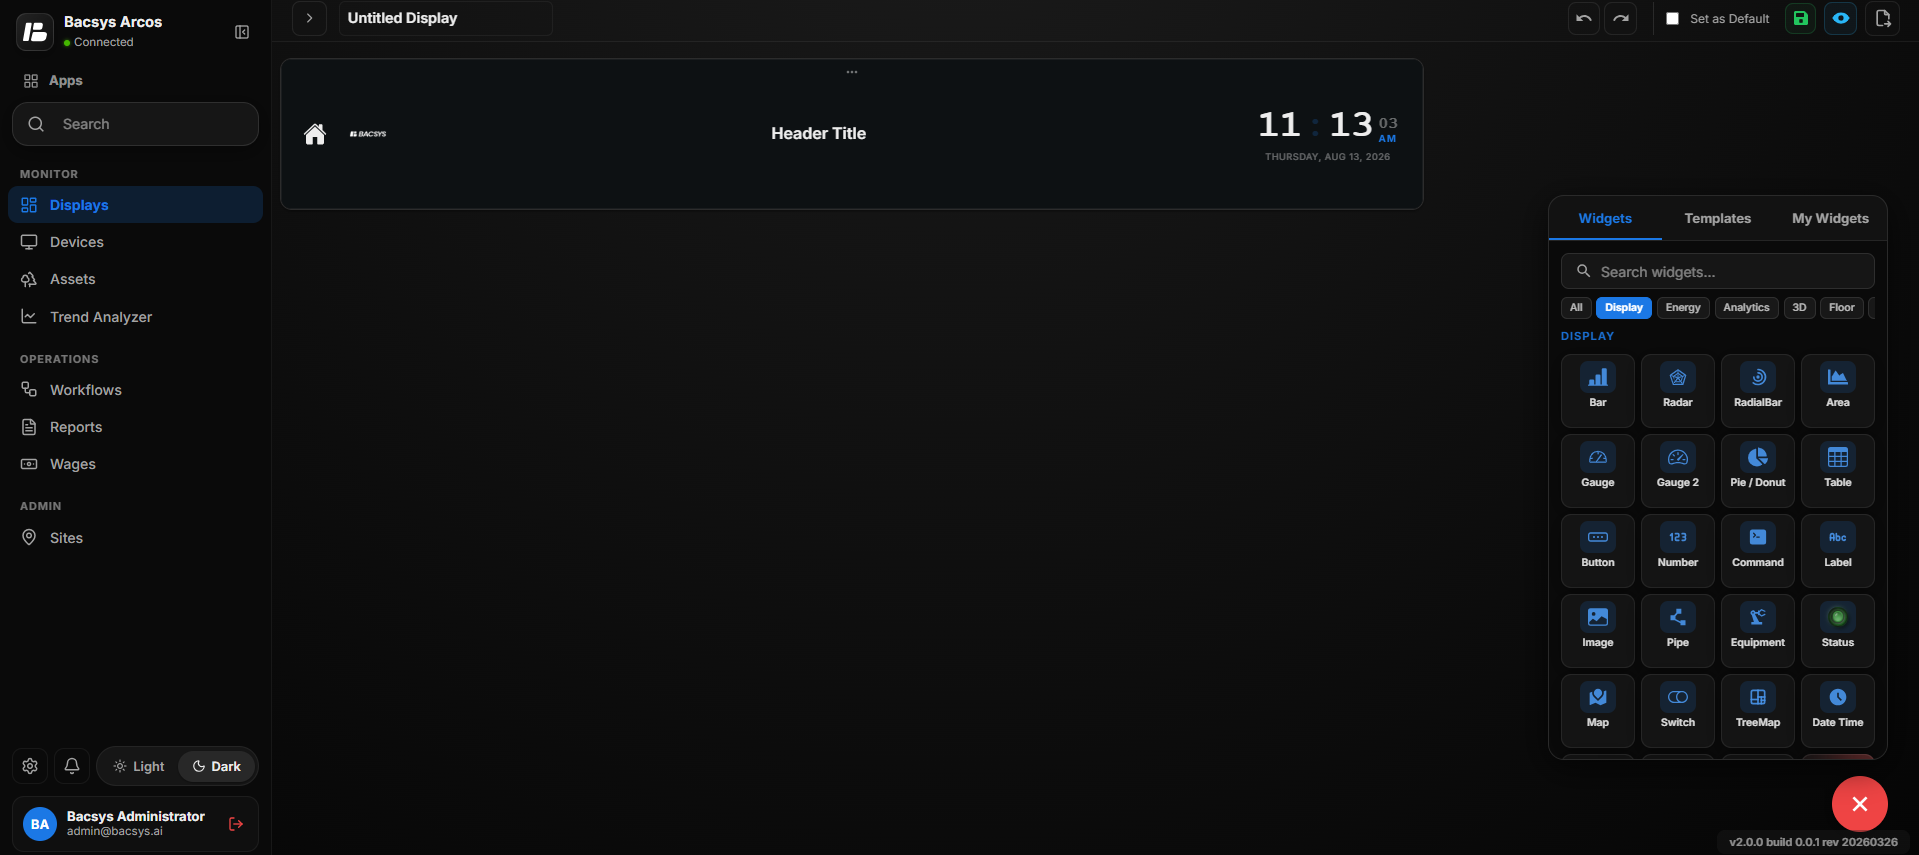
Save the Configuration
After clicking Save, the Header Widget is updated on the display with the configured title, selected display, image, button color, and appearance settings.
The current date and time continue to be displayed automatically in the Header Widget.
Add and Configure the Heatmap Widget
The Heatmap Widget is used to visualize data intensity variations using color gradients. It allows users to select points and a date range to view how the selected point values vary over time.
Add the Heatmap Widget
- Click the + icon.
- Drag and drop the Heatmap Widget onto the display.
- Select the Heatmap Widget to view the available widget actions:
- Zoom In
- Zoom Out
- Settings
- Remove Widget
- Click Settings to open the Configure Data panel.
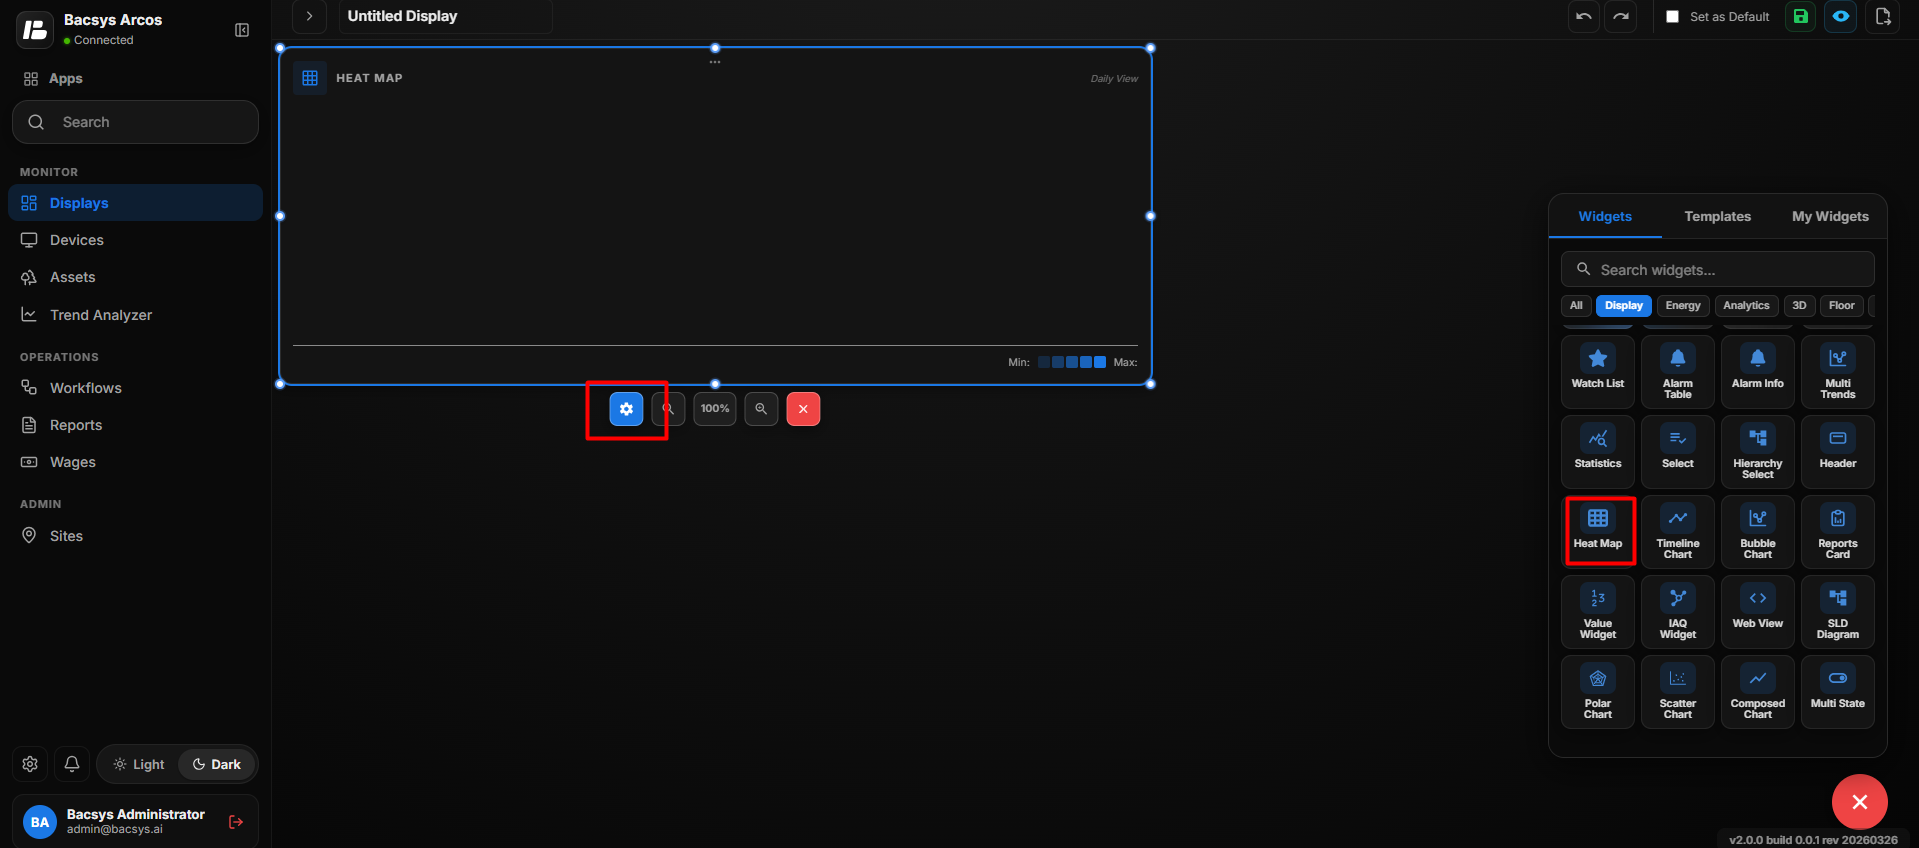
Heatmap Widget Settings
| Option | Description |
|---|---|
| Title | Enter a title for the Heatmap Widget. |
| Subtitle | Enter an optional subtitle to provide additional information about the displayed data. |
| Select Points | Select the points that should be displayed in the Heatmap. Click Browse Hierarchy to navigate through Network → Device → Point and select the required points. |
| Select Date Ranges | Select the date range for which the point data should be displayed in the Heatmap. |
| Poll Frequency (Seconds) | Specify how frequently the widget retrieves or refreshes the selected point data. |
| Show Background | Use the toggle button to show or hide the widget background. |
| Hide Header | Use the toggle button to show or hide the widget header, including the title and subtitle. |
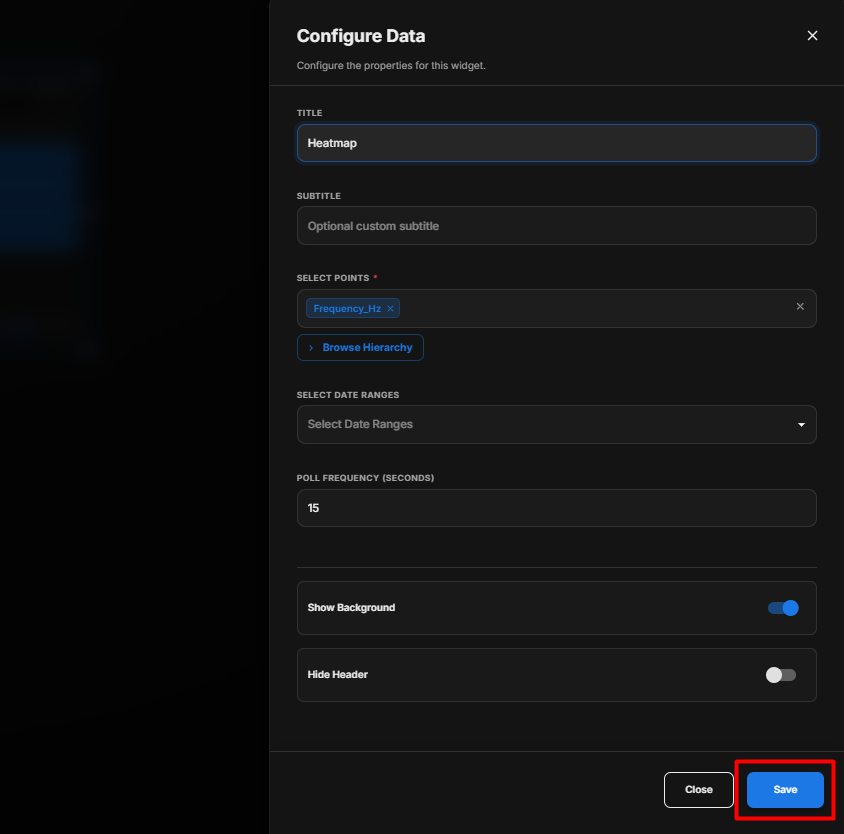
Configure the Heatmap Widget
- Enter the required Title.
- Enter an optional Subtitle.
- Under Select Points, click Browse Hierarchy.
- Navigate through Network → Device → Point.
- Select the required points.
- Under Select Date Ranges, select the required time range.
- Set the required Poll Frequency (Seconds).
- Configure Show Background according to your requirement.
- Configure Hide Header according to your requirement.
- Review all the configured settings.
- Click Save.
Heatmap Visualization
After saving the configuration, the Heatmap Widget displays the selected point data using color gradients.
The color intensity represents variations in the data values, making it easier to identify:
- Higher-value periods
- Lower-value periods
- Changes in point values
- Data intensity patterns over the selected date range
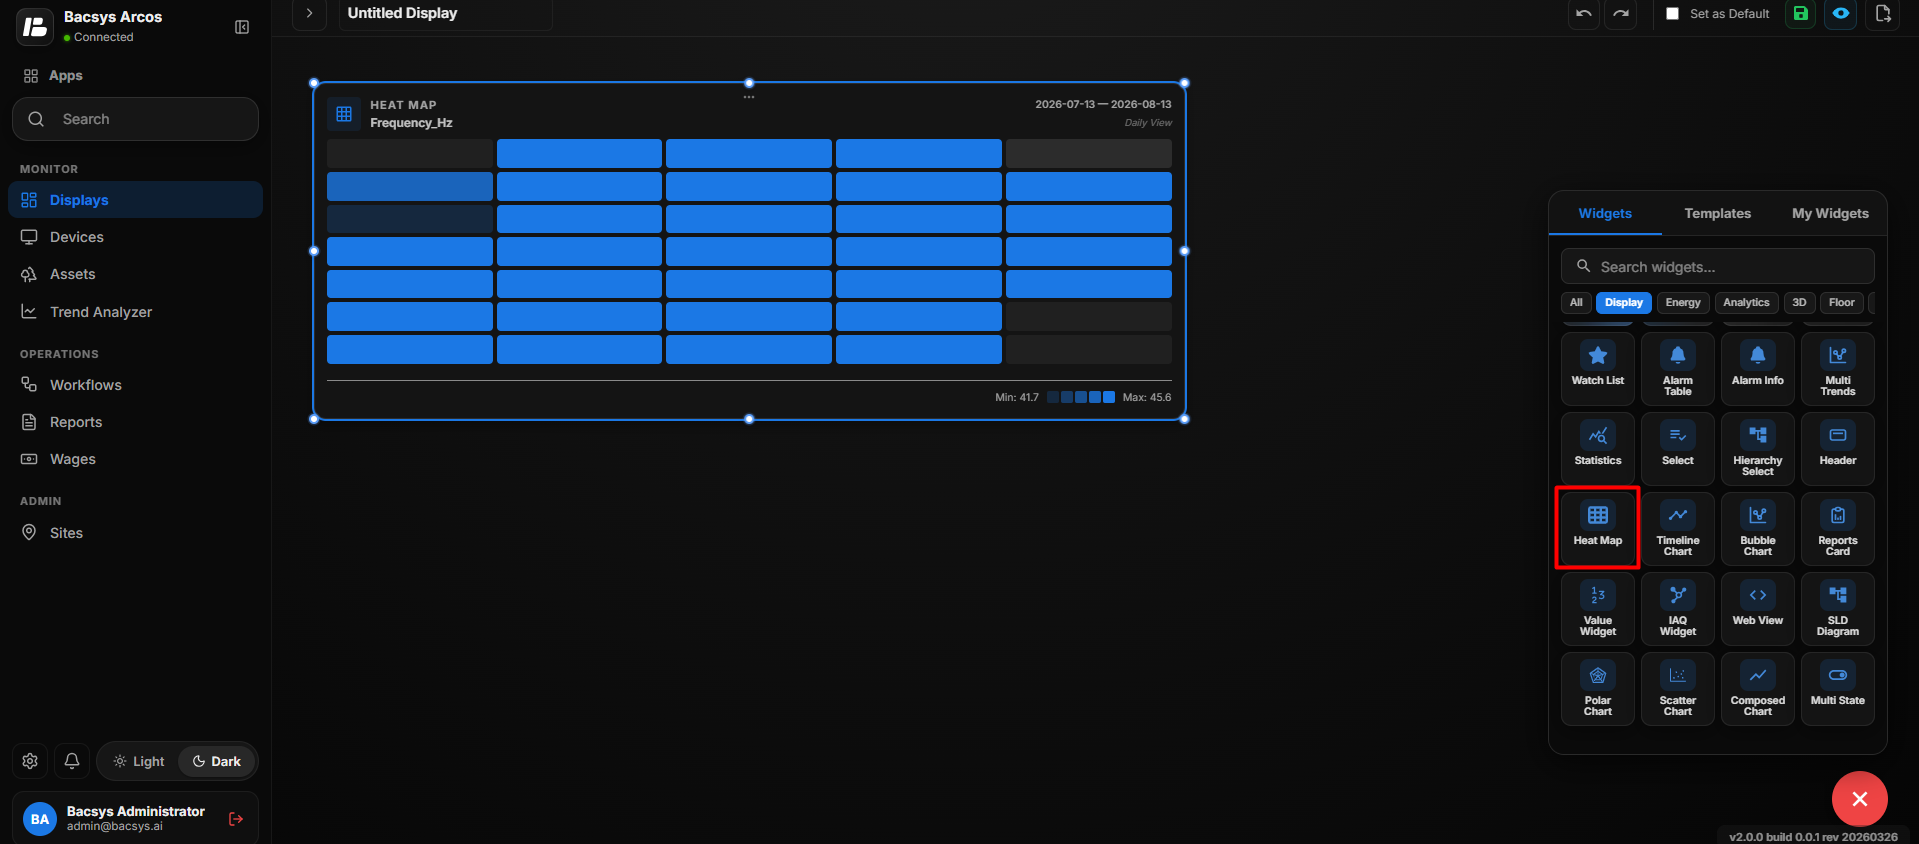
Save the Configuration
After clicking Save, the Heatmap Widget is updated on the display with the selected points, date range, and configured appearance settings.
Add and Configure the Timeline Chart Widget
The Timeline Chart Widget is used to display events or data points along a time-based horizontal axis. It is useful for monitoring changes in binary points over a selected time range.
Note: Only Binary points can be selected for the Timeline Chart Widget.
Add the Timeline Chart Widget
- Click the + icon.
- Drag and drop the Timeline Chart Widget onto the display.
- Select the Timeline Chart Widget to view the available widget actions:
- Zoom In
- Zoom Out
- Settings
- Remove Widget
- Click Settings to open the Configure Data panel.
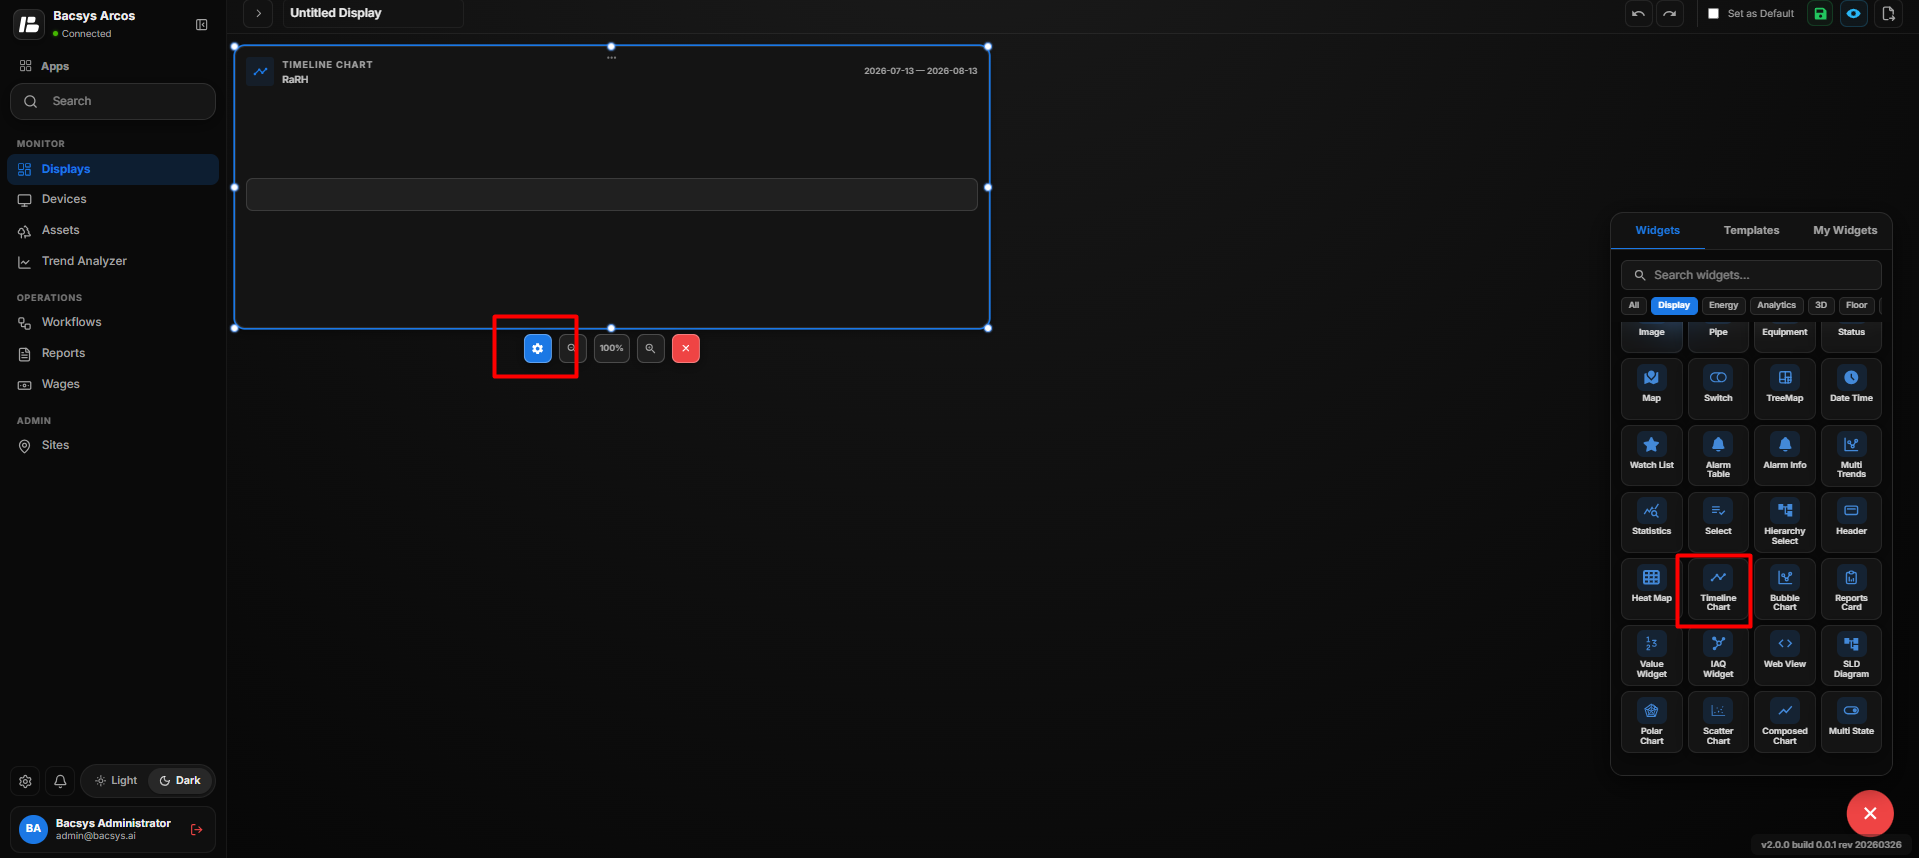
Timeline Chart Widget Settings
| Option | Description |
|---|---|
| Title | Enter a title for the Timeline Chart Widget. |
| Subtitle | Enter an optional subtitle to provide additional information about the chart. |
| Select Points | Select the Binary points that should be displayed in the Timeline Chart. Click Browse Hierarchy to navigate through Network → Device → Point and select the required points. |
| Select Date Ranges | Select the time range for which the binary point events should be displayed. |
| Poll Frequency (Seconds) | Specify how frequently the widget retrieves or refreshes the selected point data. |
| Status Threshold (For Analog Points) | This setting is available for analog points, but analog points cannot be selected for the Timeline Chart. |
| Show Background | Use the toggle button to show or hide the widget background. |
| Hide Header | Use the toggle button to show or hide the widget header, including the title and subtitle. |
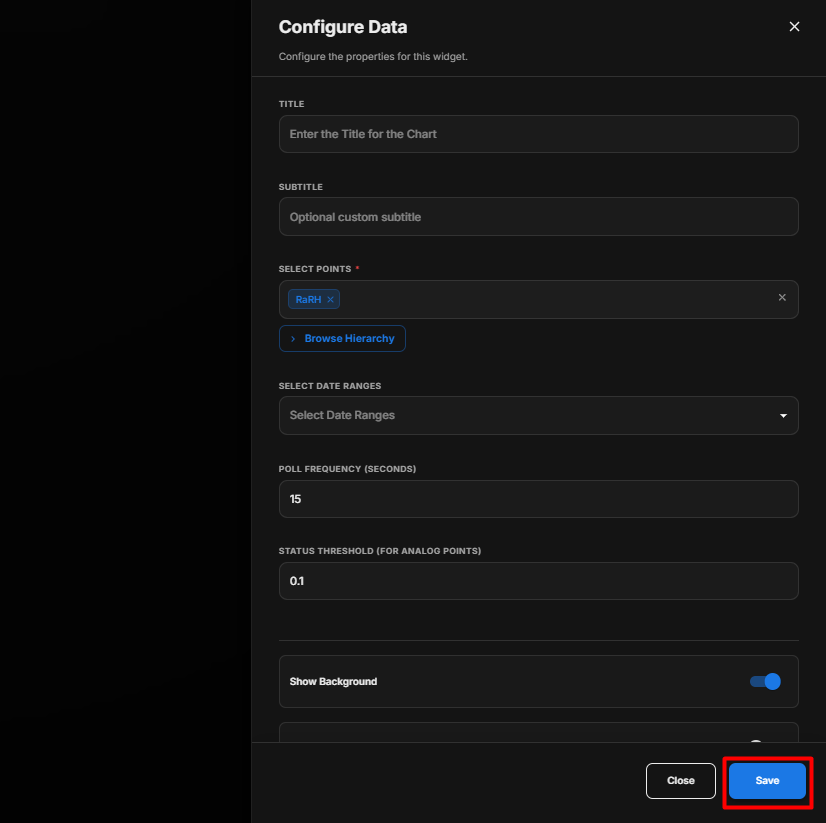
Select Binary Points
The Timeline Chart supports Binary points only.
- Under Select Points, click Browse Hierarchy.
- Navigate through Network → Device → Point.
- Select the required Binary point.
- Multiple binary points can be selected if required.
- Make sure the selected points are binary points before saving.
Configure the Timeline Chart
- Enter the required Title.
- Enter an optional Subtitle.
- Under Select Points, click Browse Hierarchy.
- Navigate through Network → Device → Point.
- Select the required Binary points.
- Under Select Date Ranges, select the required time range.
- Set the required Poll Frequency (Seconds).
- Configure Show Background according to your requirement.
- Configure Hide Header according to your requirement.
- Review all the configured settings.
- Click Save.
Timeline Visualization
After saving the configuration, the Timeline Chart displays the selected binary point events along a horizontal time axis.
The chart helps users identify:
- When a binary point changed state.
- The duration of a particular state.
- State changes across the selected time range.
- Event patterns for the selected binary points.
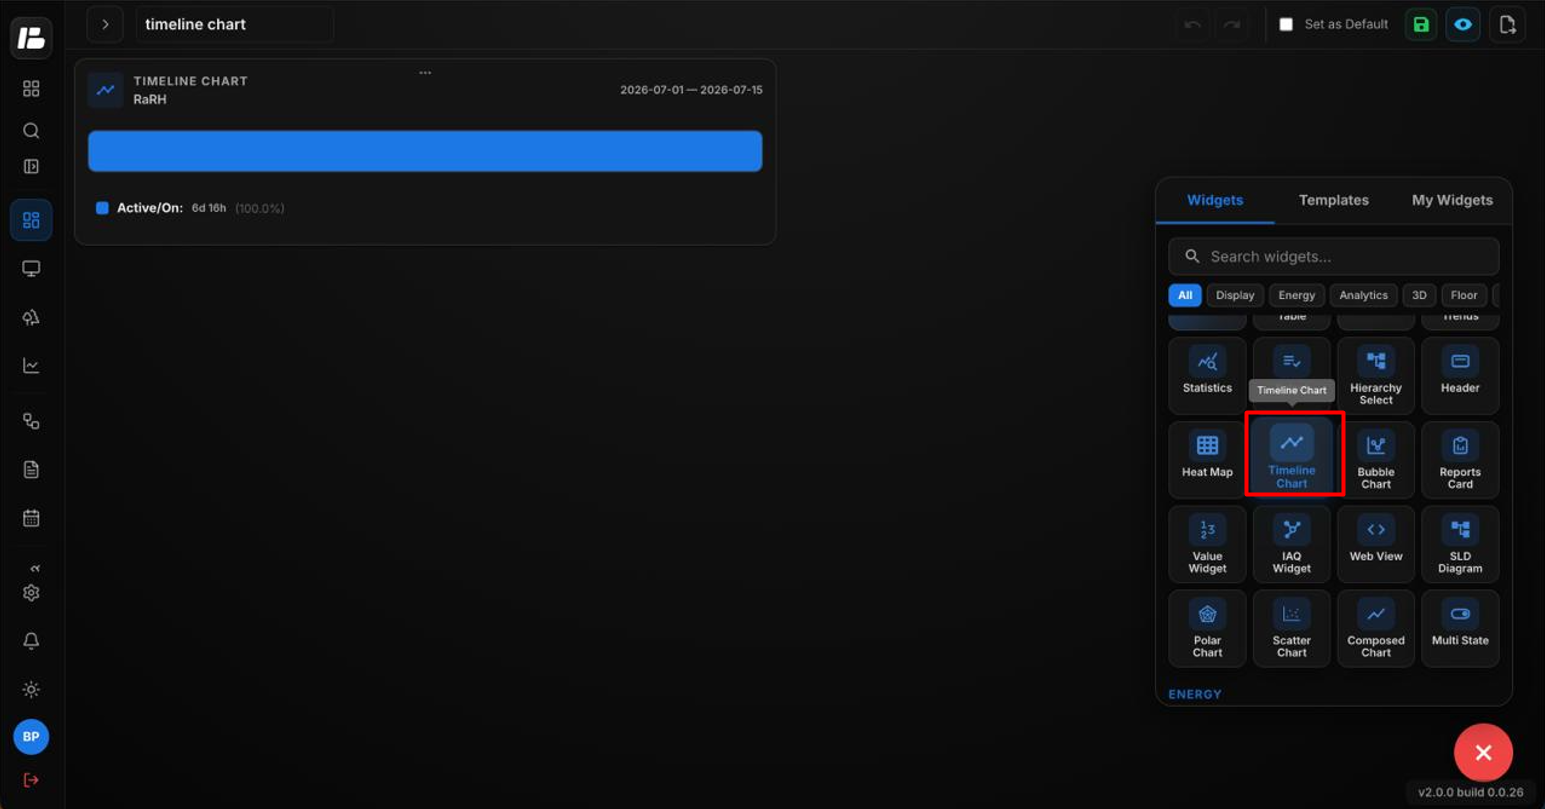
Save the Configuration
After clicking Save, the Timeline Chart Widget is updated on the display and shows the selected Binary point events according to the configured time range.
Important: The Timeline Chart Widget supports Binary points only. Analog points should not be selected for this widget.
Add and Configure the Bubble Chart Widget
The Bubble Chart Widget is used to represent three-dimensional data using bubbles of varying sizes. It allows users to select multiple points and visualize their values in a bubble-based chart.
Note: A maximum of 5 points can be selected for the Bubble Chart Widget.
Add the Bubble Chart Widget
- Click the + icon.
- Drag and drop the Bubble Chart Widget onto the display.
- Select the Bubble Chart Widget to view the available widget actions:
- Zoom In
- Zoom Out
- Settings
- Remove Widget
- Click Settings to open the Configure Data panel.
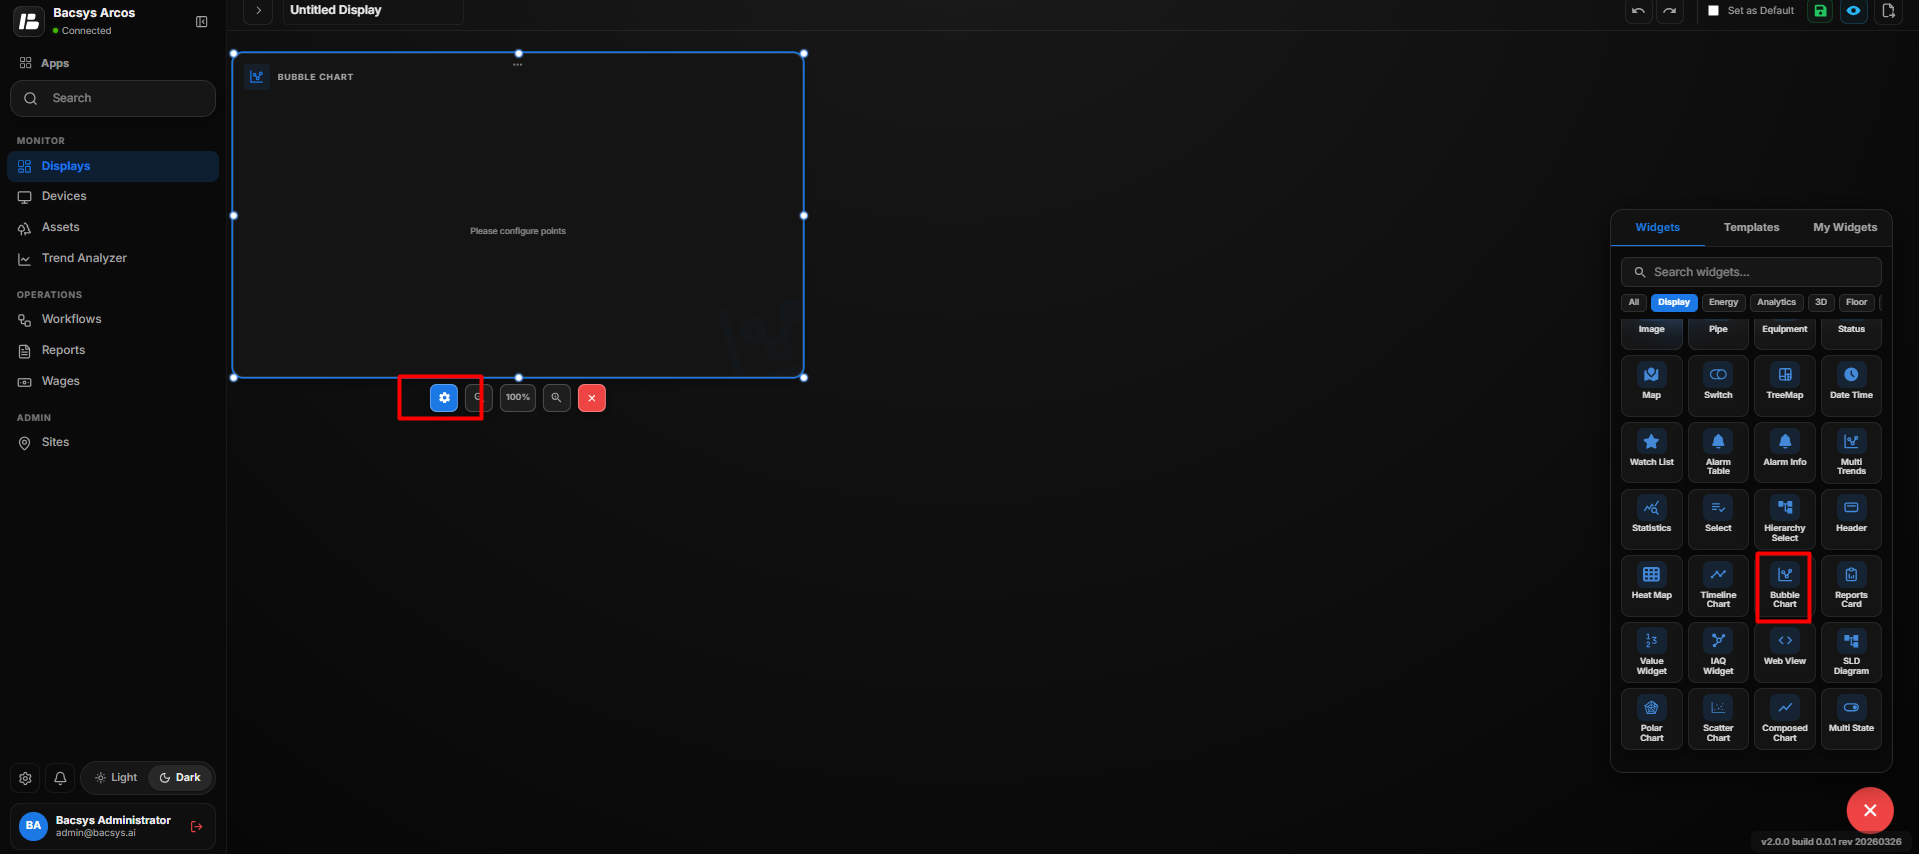
Bubble Chart Widget Settings
| Option | Description |
|---|---|
| Title | Enter a title for the Bubble Chart Widget. |
| Subtitle | Enter an optional subtitle to provide additional information about the chart. |
| Select Type | Select the type of data to be displayed. The available option shown is Instantaneous Value. |
| Select Points | Select the points that should be displayed in the Bubble Chart. A maximum of 5 points can be selected. Click Browse Hierarchy to navigate through Network → Device → Point and select the required points. |
| Poll Frequency (Seconds) | Specify how frequently the widget retrieves or refreshes the selected point values. |
| Show Background | Use the toggle button to show or hide the widget background. |
| Hide Header | Use the toggle button to show or hide the widget header, including the title and subtitle. |
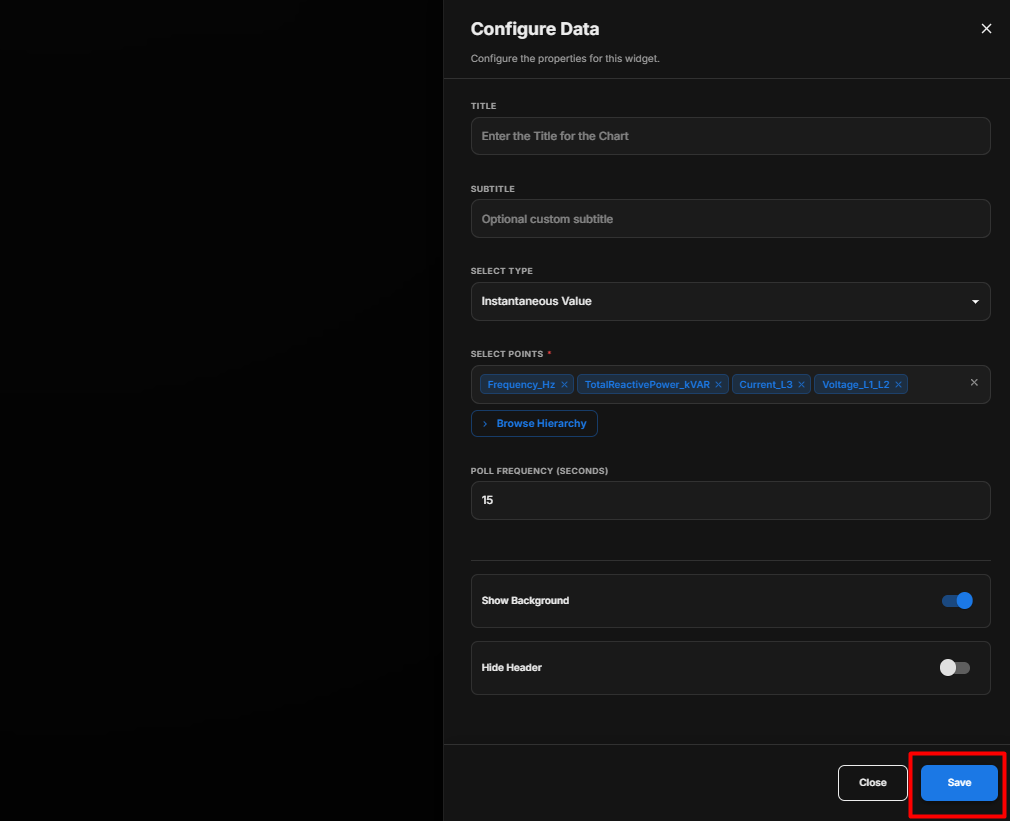
Select Points
The Bubble Chart supports a maximum of 5 points.
- Under Select Points, click Browse Hierarchy.
- Navigate through Network → Device → Point.
- Select the required points.
- Make sure that no more than 5 points are selected.
- Review the selected points before saving.
Configure the Bubble Chart
- Enter the required Title.
- Enter an optional Subtitle.
- Under Select Type, select Instantaneous Value.
- Under Select Points, click Browse Hierarchy.
- Navigate through Network → Device → Point.
- Select up to 5 points.
- Set the required Poll Frequency (Seconds).
- Configure Show Background according to your requirement.
- Configure Hide Header according to your requirement.
- Review all the configured settings.
- Click Save.
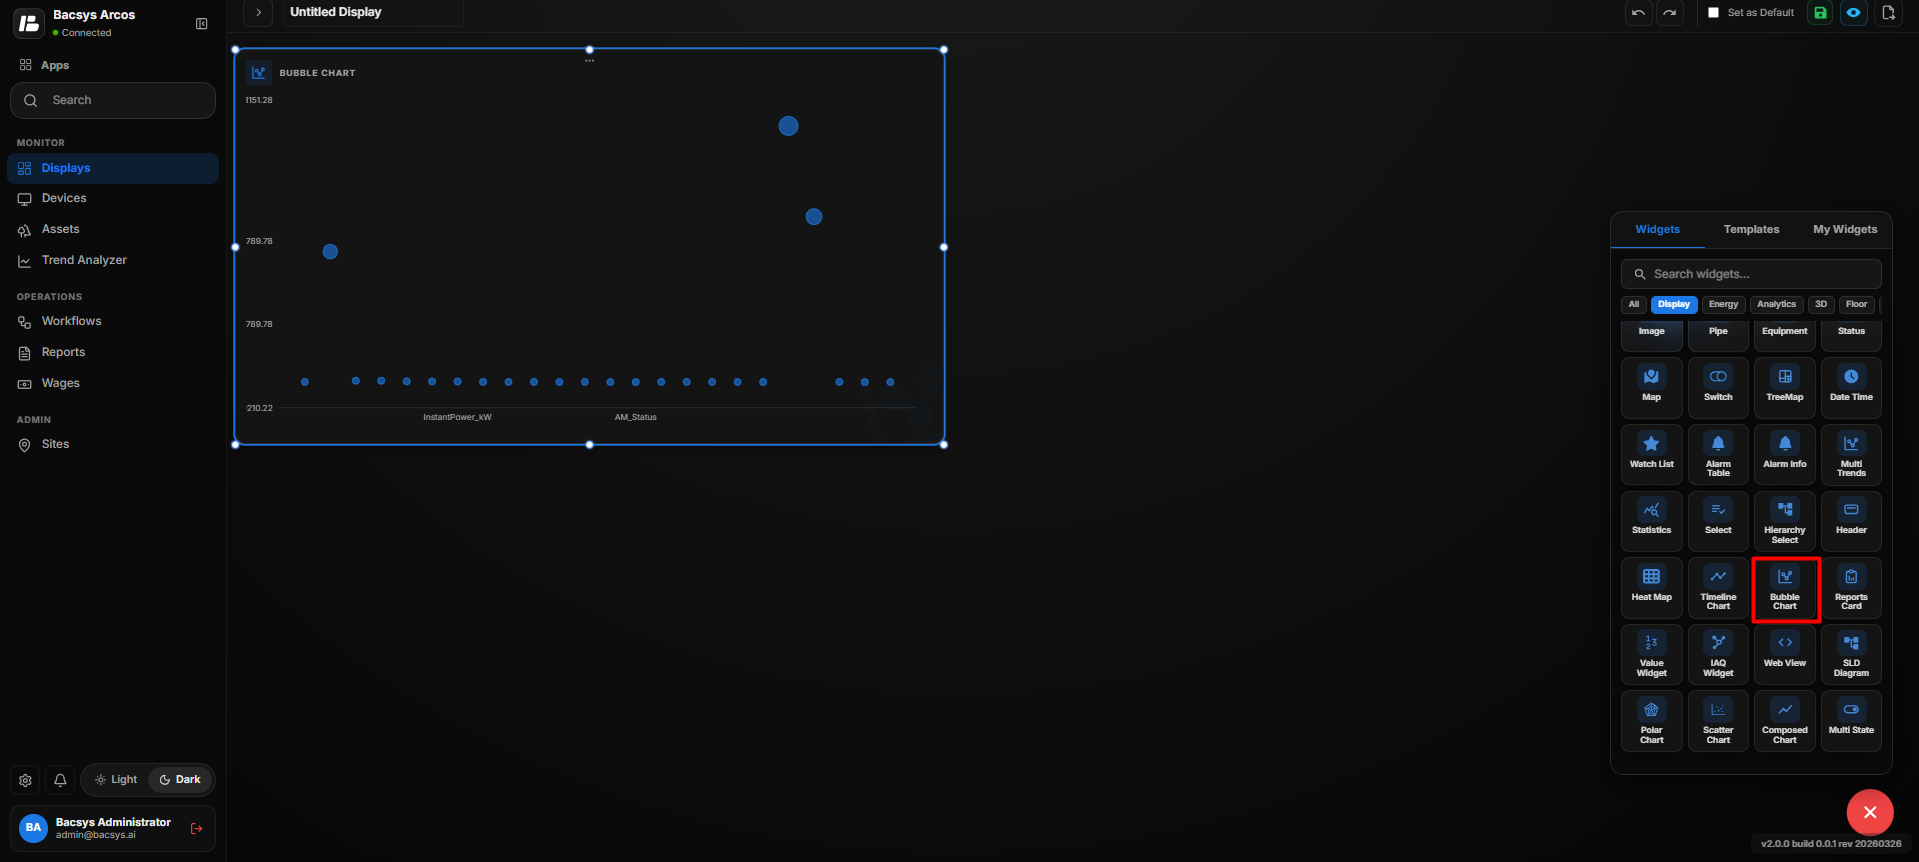
Bubble Chart Visualization
After saving the configuration, the Bubble Chart displays the selected point data using bubbles of different sizes.
The bubble visualization helps users compare the selected point values in a single chart.
Save the Configuration
After clicking Save, the Bubble Chart Widget is updated on the display with the selected points and configured settings.
Note: The Bubble Chart Widget supports a maximum of 5 selected points.
Bubble Chart – Trend Value
The Bubble Chart Widget also supports Trend Value in addition to Instantaneous Value.
When Trend Value is selected, the widget uses trend data from the selected points for the configured date range.
Trend Value Settings
| Option | Description |
|---|---|
| Title | Enter a title for the Bubble Chart Widget. |
| Subtitle | Enter an optional subtitle to provide additional information about the chart. |
| Select Type | Select Trend Value to display trend-based data. |
| Select Points | Select the points that have trend data available. Click Browse Hierarchy to navigate through Network → Device → Point and select the required trend-enabled points. |
| Select Date Ranges | Select the date range for which the trend data should be displayed. |
| Poll Frequency (Seconds) | Specify how frequently the widget retrieves or refreshes the selected data. |
| Show Background | Use the toggle button to show or hide the widget background. |
| Hide Header | Use the toggle button to show or hide the widget header, including the title and subtitle. |
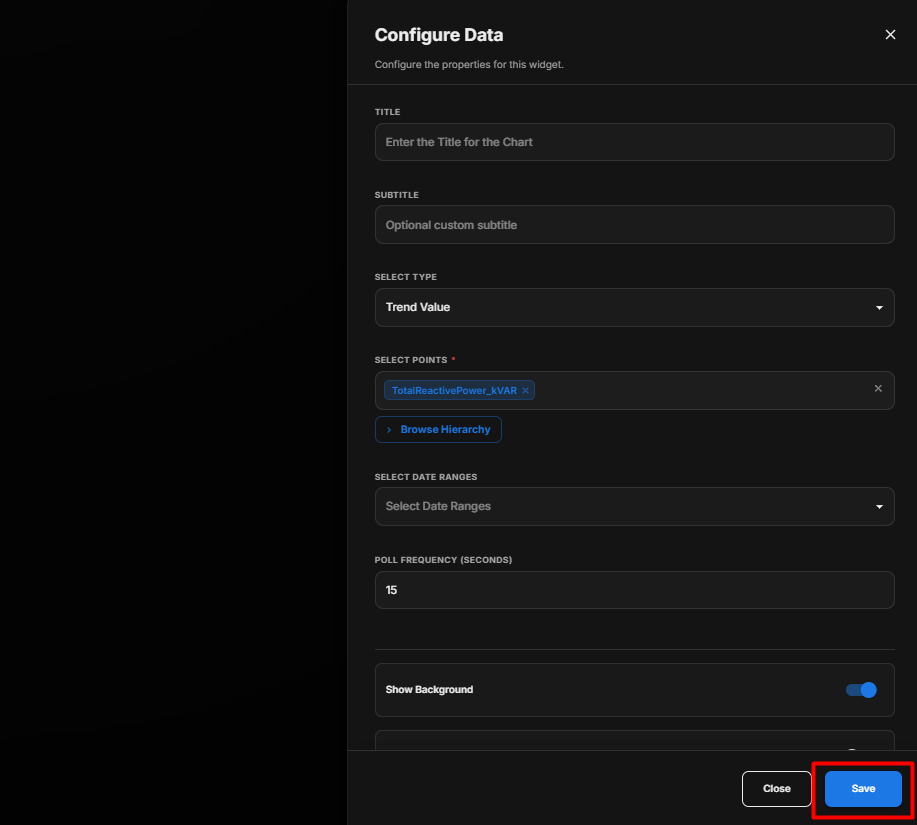
Configure Bubble Chart – Trend Value
- Enter the required Title.
- Enter an optional Subtitle.
- Under Select Type, select Trend Value.
- Under Select Points, click Browse Hierarchy.
- Navigate through Network → Device → Point.
- Select the required points.
- Make sure the selected points have trend data available.
- Under Select Date Ranges, select the required date range.
- Set the required Poll Frequency (Seconds).
- Configure Show Background according to your requirement.
- Configure Hide Header according to your requirement.
- Review all the configured settings.
- Click Save.
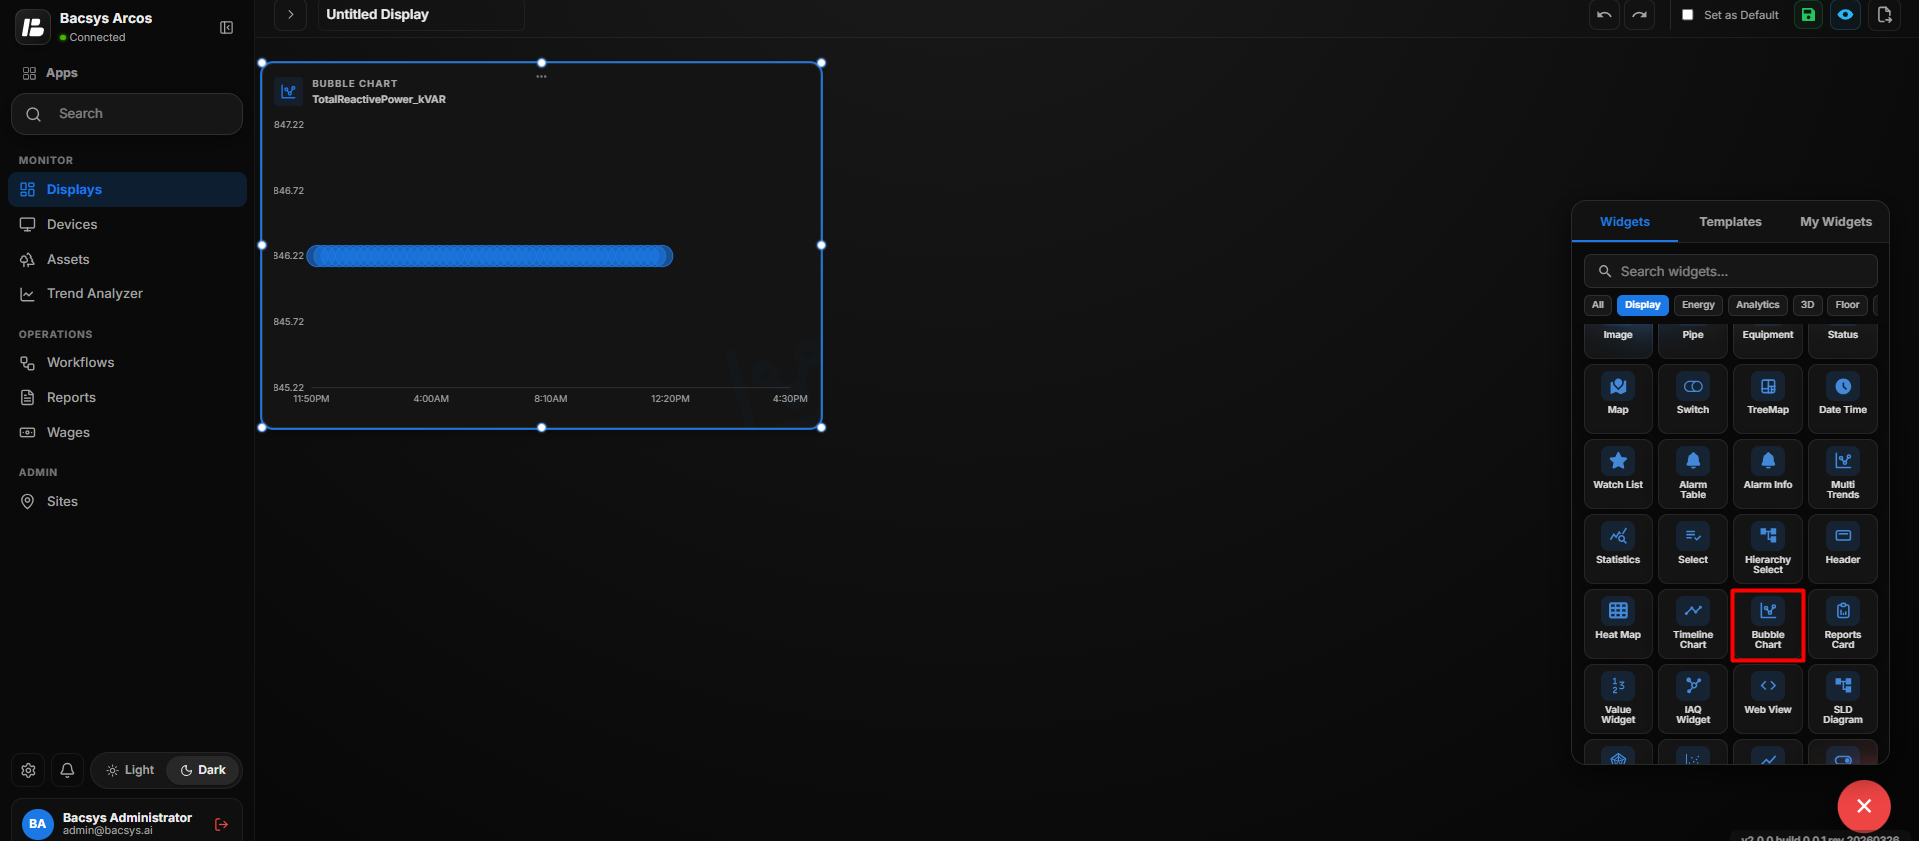
Bubble Chart Types
The Bubble Chart supports two data types:
| Select Type | Description |
|---|---|
| Instantaneous Value | Displays the current values of the selected points using the Bubble Chart visualization. |
| Trend Value | Displays data from the selected points' available trend history for the selected date range. |
Note: When Trend Value is selected, make sure the selected points have trend data available before configuring the date range.
Add and Configure the Reports Card Widget
The Reports Card Widget is used to generate and display report data for a selected date range. After generating the report, users can view the data using different chart types such as Area, Bar, Line, and Stacked charts. The generated chart can also be downloaded as an image.
Add the Reports Card Widget
- Click the + icon.
- Drag and drop the Reports Card Widget onto the display.
- Select the Reports Card Widget to view the available widget actions:
- Zoom In
- Zoom Out
- Settings
- Remove Widget
- Click Settings to open the Configure Data panel.
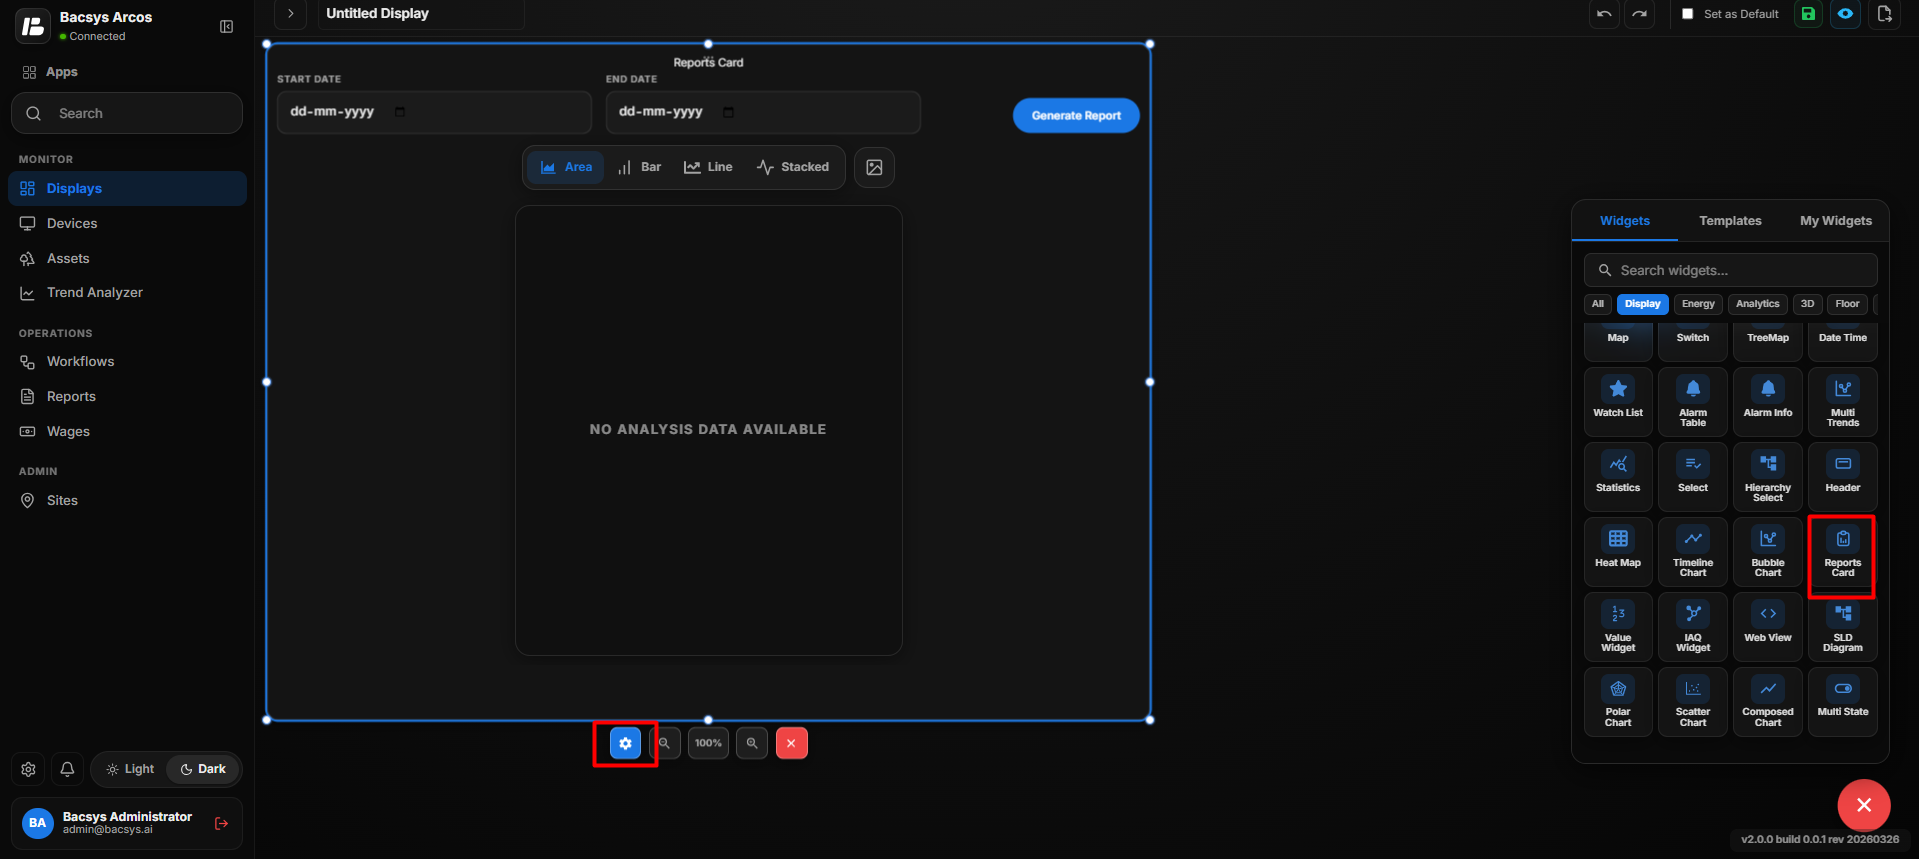
Reports Card Settings
| Option | Description |
|---|---|
| Title | Enter the title that should be displayed on the Reports Card. |
| Select Report | Select the report that should be displayed in the Reports Card. Only one report can be selected. |
| Show Background | Use the toggle button to show or hide the widget background. |
| Hide Header | Use the toggle button to show or hide the widget header. |
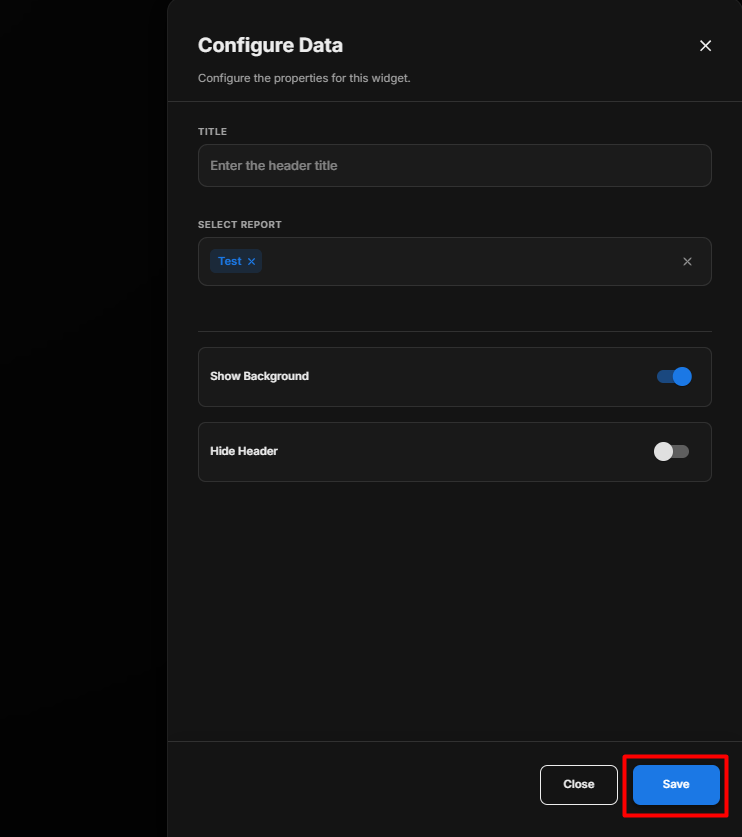
Configure the Reports Card
- Enter the required Title.
- Under Select Report, select the required report.
- Configure Show Background according to your requirement.
- Configure Hide Header according to your requirement.
- Review all the configured settings.
- Click Save.
Generate the Report
After configuring and saving the Reports Card:
- Select the required Start Date.
- Select the required End Date.
- Click Generate Report.
- The report data is generated for the selected date range.
- If no data is available for the selected period, No Analysis Data Available is displayed.
Chart Types
After generating the report, the report data can be viewed using different chart types.
| Chart Type | Description |
|---|---|
| Area | Displays the report data using an area chart. |
| Bar | Displays the report data using a bar chart. |
| Line | Displays the report data using a line chart. |
| Stacked | Displays the report data using a stacked chart. |
Select the required chart type to change how the report data is visualized.
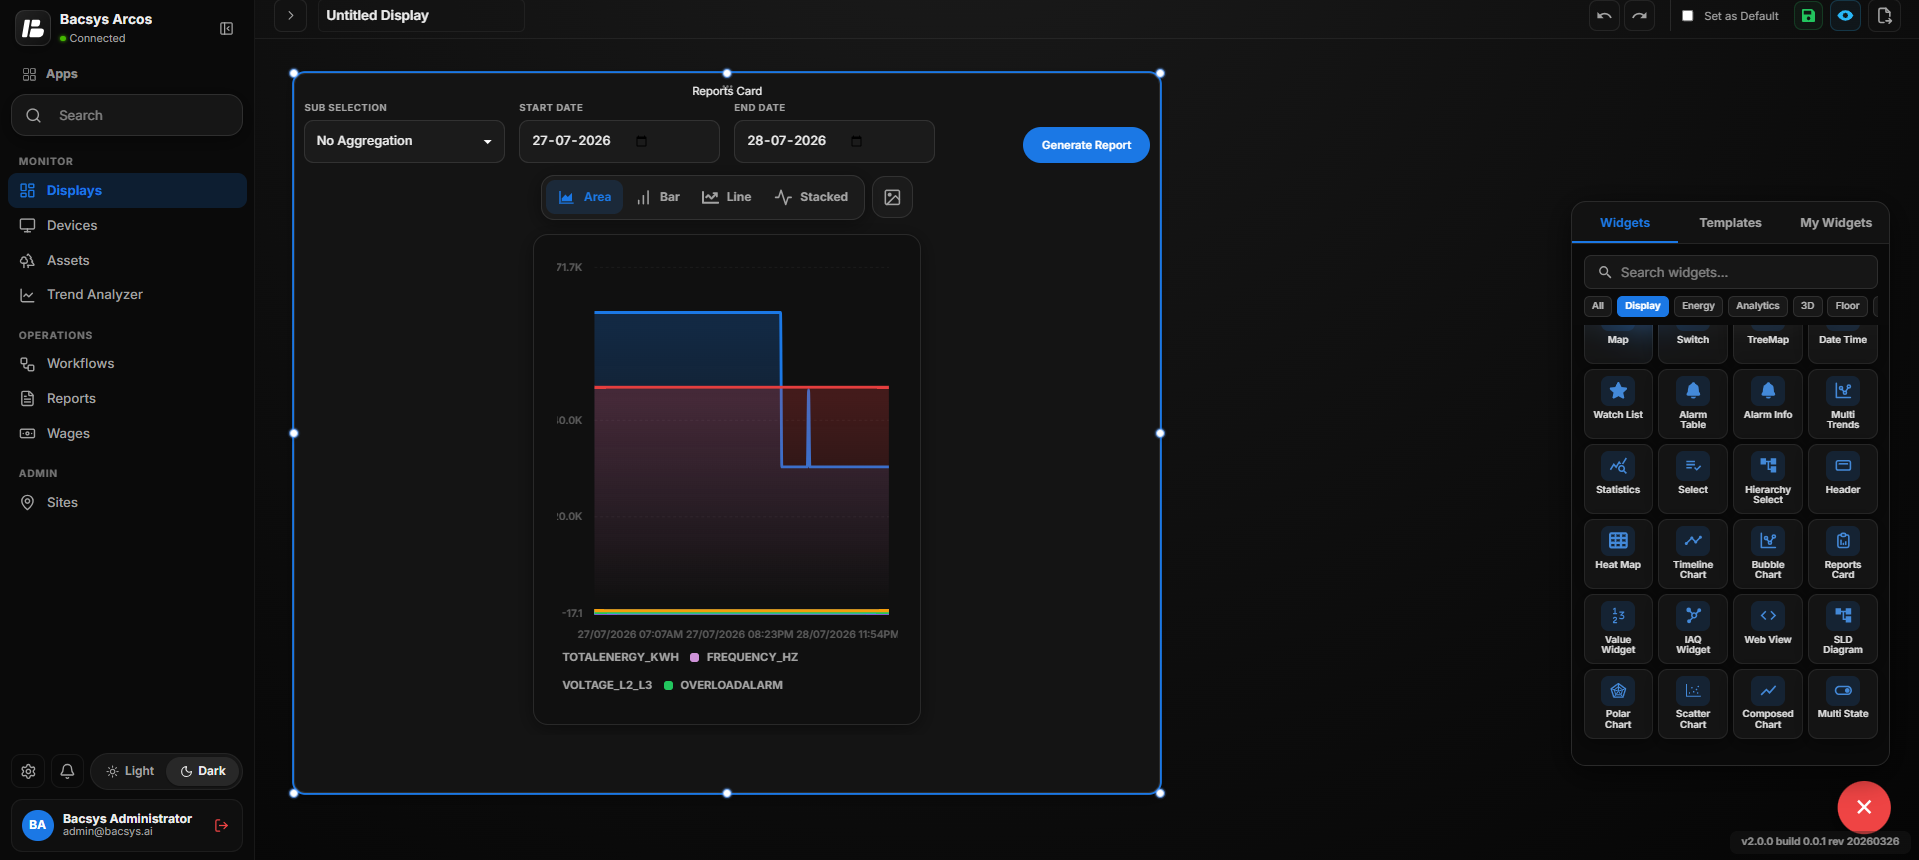
Download the Report Chart
The Reports Card also provides an Image button.
- Generate the report using the required Start Date and End Date.
- Select the required chart type.
- Click the Image button.
- The displayed chart is downloaded as an image.
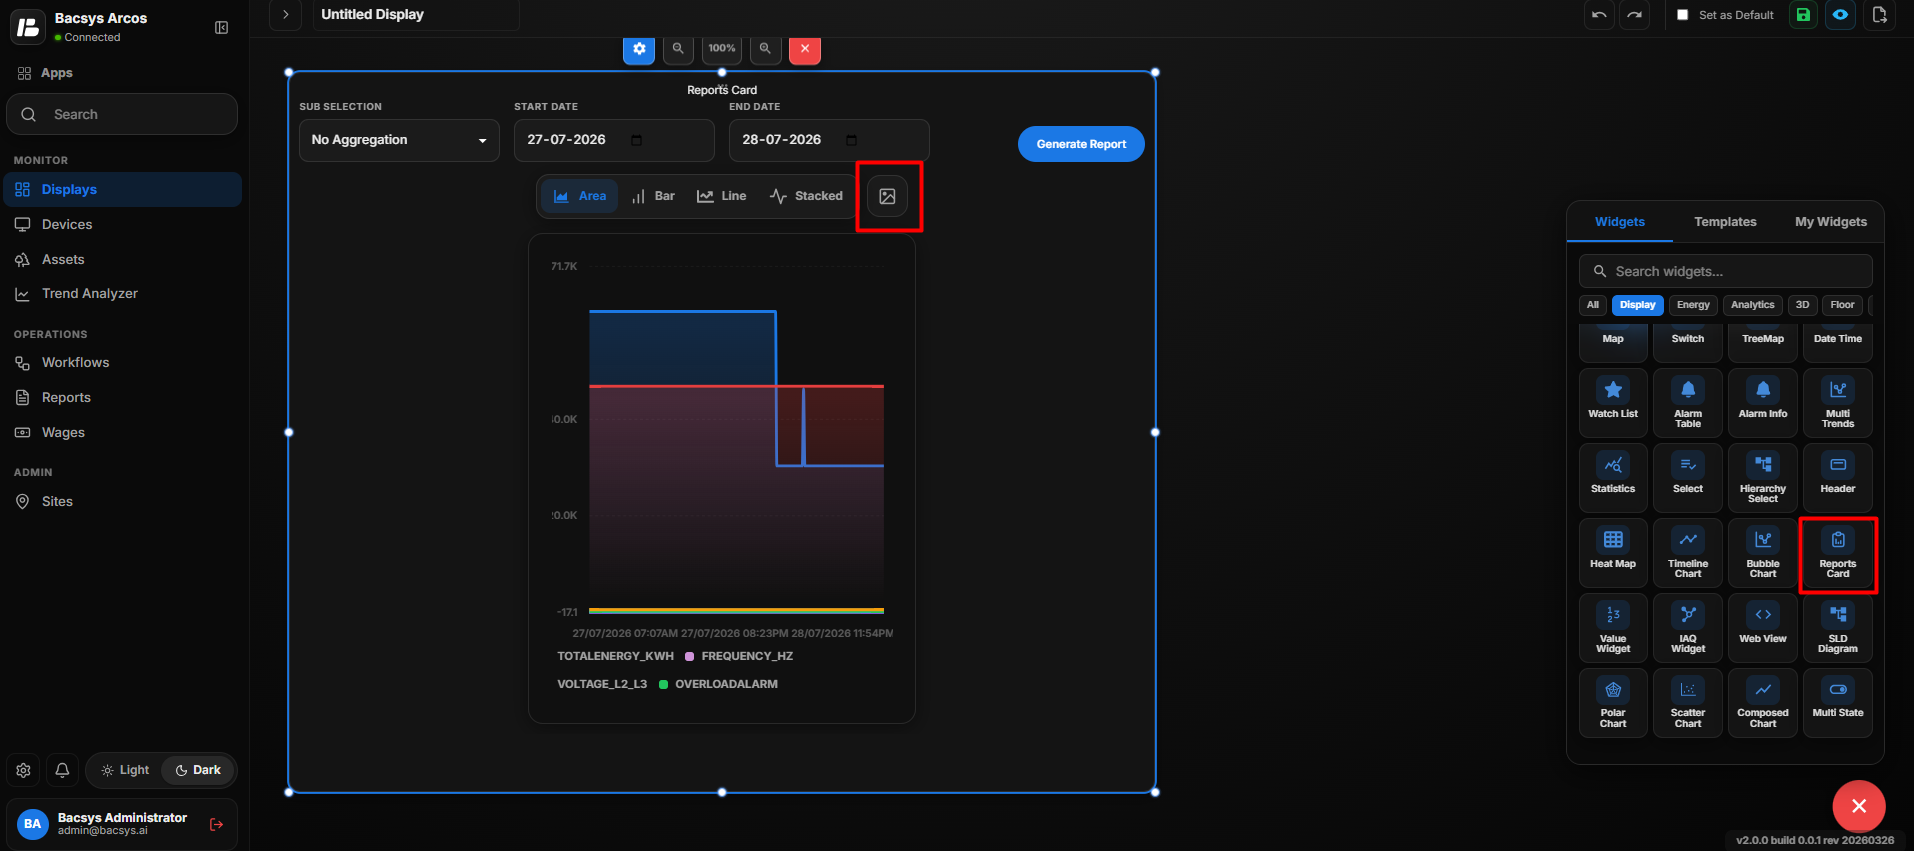
Reports Card Workflow
Add Reports Card Widget
        ↓
Open Settings
        ↓
Enter Title
        ↓
Select Report
        ↓
Configure Background / Header
        ↓
Save
        ↓
Select Start Date
        ↓
Select End Date
        ↓
Generate Report
        ↓
View Report Data
        ↓
Select Chart Type
        ↓
Area / Bar / Line / Stacked
        ↓
Download Chart as Image (Optional)
Add and Configure the Value Widget
The Value Widget is used to display the current value of a selected point in a clear and simple format. Users can customize the text appearance, background color, and other display options.
Add the Value Widget
- Click the + icon.
- Drag and drop the Value Widget onto the display.
- Select the Value Widget to view the available widget actions:
- Zoom In
- Zoom Out
- Settings
- Remove Widget
- Click Settings to open the Configure Data panel.
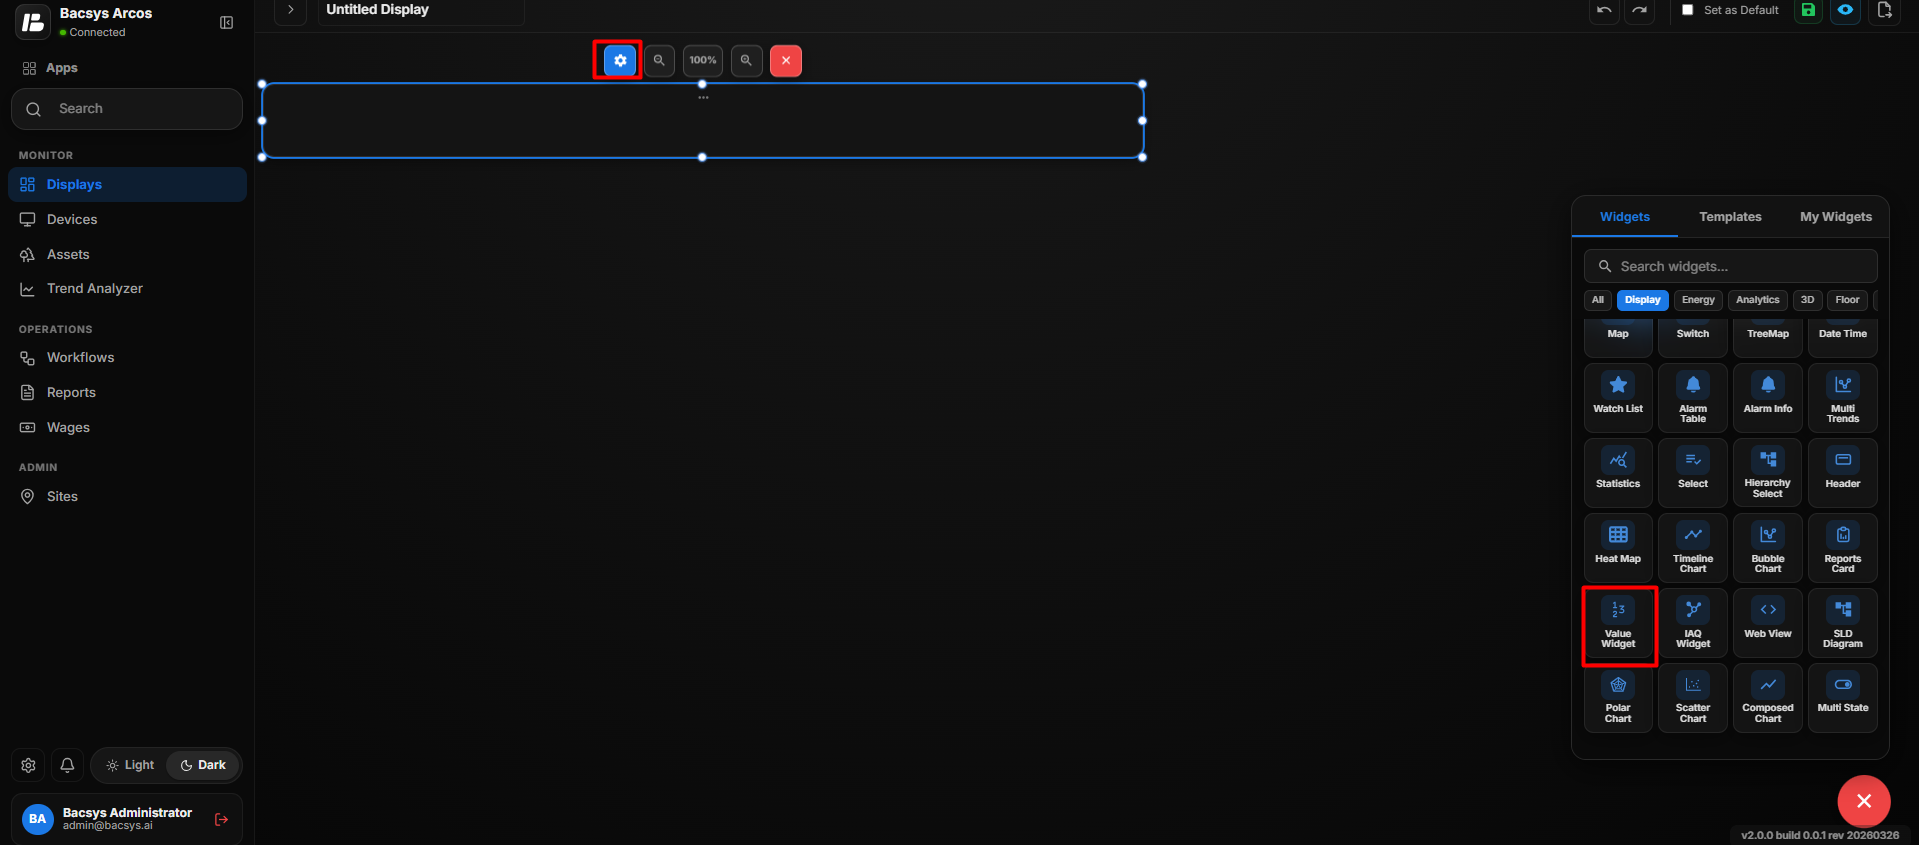
Value Widget Settings
| Option | Description |
|---|---|
| Select Point | Select the point whose current value should be displayed. Click Browse Hierarchy to navigate through Network → Device → Point and select the required point. |
| Font Size | Enter the required font size for the displayed value. |
| Show Status Indicator | Enable the toggle to display a status indicator along with the point value. |
| Background Color | Select the background color for the Value Widget from the available colors. Recently used colors are also available for quick selection. |
| Font Color | Select the color of the displayed value from the available colors. |
| Bold Text | Enable the toggle to display the point value in bold text. |
| Italic Text | Enable the toggle to display the point value in italic text. |
| All Caps | Enable the toggle to display the text in capital letters. |
| Show Background | Use the toggle button to show or hide the widget background. |
| Hide Header | Use the toggle button to show or hide the widget header. |
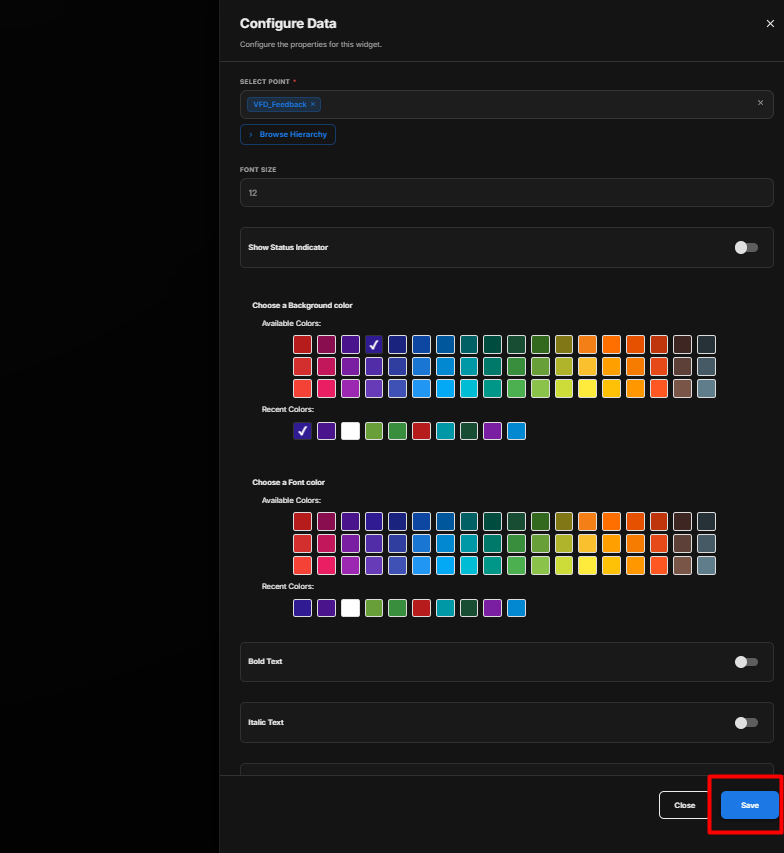
Configure the Value Widget
- Under Select Point, click Browse Hierarchy.
- Navigate through Network → Device → Point.
- Select the required point.
- Enter the required Font Size.
- Enable Show Status Indicator if a status indicator should be displayed.
- Select the required Background Color.
- Select the required Font Color.
- Enable Bold Text if the value should appear in bold.
- Enable Italic Text if the value should appear in italic style.
- Enable All Caps if the text should appear in capital letters.
- Configure Show Background according to your requirement.
- Configure Hide Header according to your requirement.
- Review all the configured settings.
- Click Save.
Value Display
After saving the configuration, the Value Widget displays the current value of the selected point.
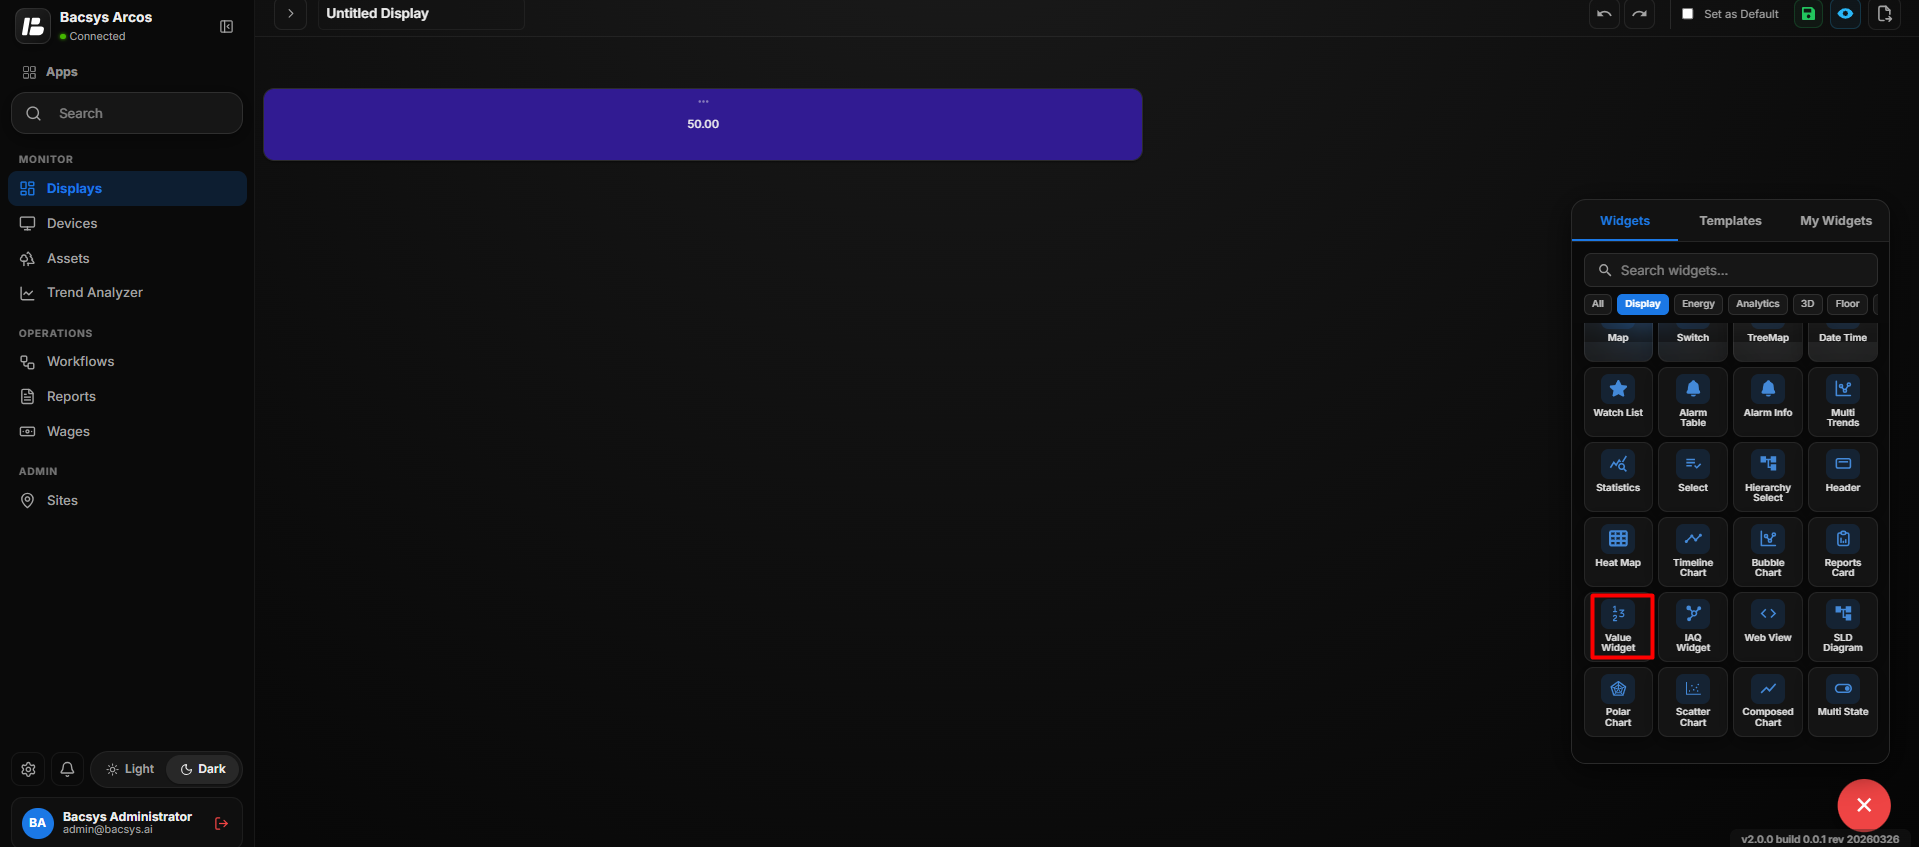
Add and Configure the IAQ Widget
The IAQ (Indoor Air Quality) Widget is used to display important indoor air quality and environmental measurements in a single widget. It can display values such as Temperature, Humidity, CO₂, TVOC, PM2.5, PM10, NO₂, and IAQ Index.
Add the IAQ Widget
- Click the + icon.
- Drag and drop the IAQ Widget onto the display.
- Select the IAQ Widget to view the available widget actions:
- Zoom In
- Zoom Out
- Settings
- Remove Widget
- Click Settings to open the Configure Data panel.
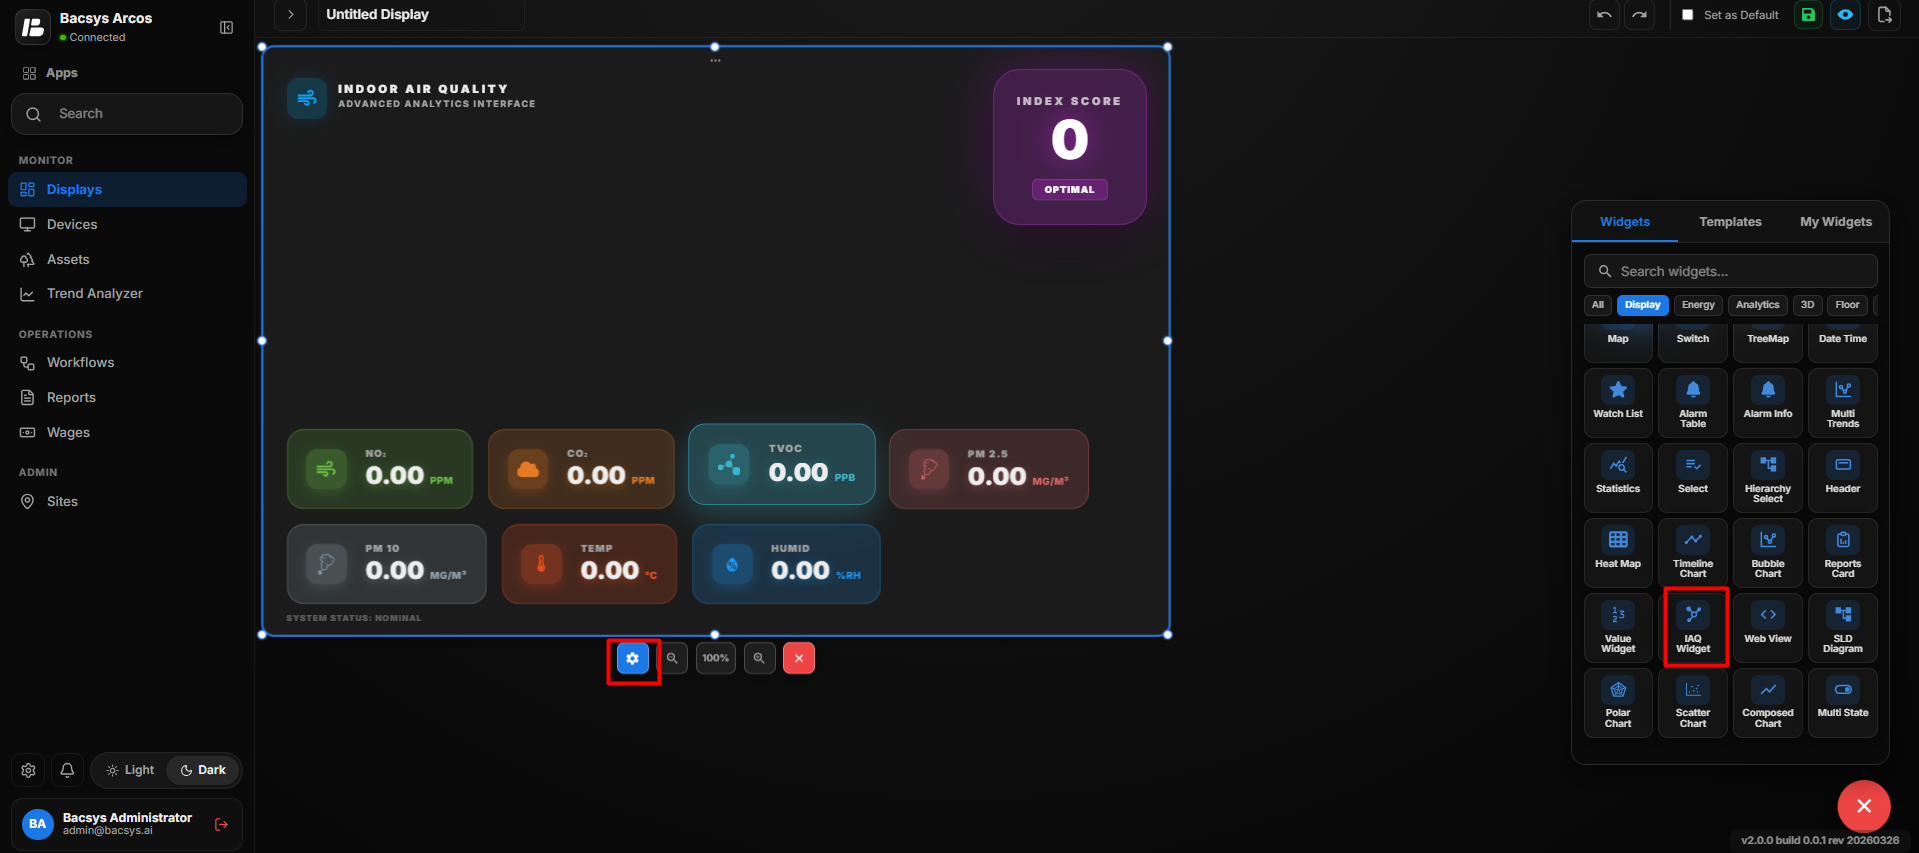
IAQ Widget Settings
| Option | Description |
|---|---|
| Title | Enter a title for the IAQ Widget. |
| Image | Upload an image or logo to be displayed in the IAQ Widget. You can drag and drop an image or click Browse Files to select one. |
| Temperature | Select the point that provides the indoor temperature value. Click Browse Hierarchy to select the required point. |
| Humidity | Select the point that provides the indoor humidity value. |
| CO₂ | Select the point that provides the carbon dioxide (CO₂) value. |
| TVOC | Select the point that provides the Total Volatile Organic Compounds (TVOC) value. |
| PM 2.5 | Select the point that provides the PM2.5 particulate matter value. |
| PM 10 | Select the point that provides the PM10 particulate matter value. |
| NO₂ | Select the point that provides the nitrogen dioxide (NO₂) value. |
| IAQ Index | Select the point that provides the Indoor Air Quality (IAQ) index value. |
| Show Background | Use the toggle button to show or hide the widget background. |
| Hide Header | Use the toggle button to show or hide the widget header. |
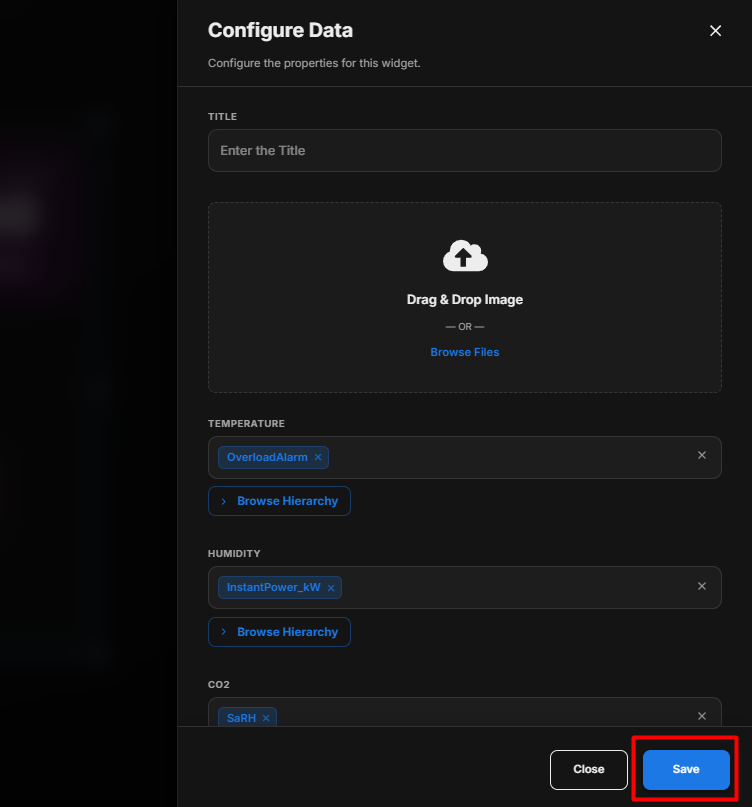
Select IAQ Points
The IAQ Widget allows you to configure individual points for different indoor air quality measurements.
- Under the required IAQ measurement, click Browse Hierarchy.
- Navigate through Network → Device → Point.
- Select the appropriate point for that measurement.
- Repeat the process for each IAQ measurement that you want to display.
The available measurements include:
- Temperature
- Humidity
- CO₂
- TVOC
- PM 2.5
- PM 10
- NO₂
- IAQ Index
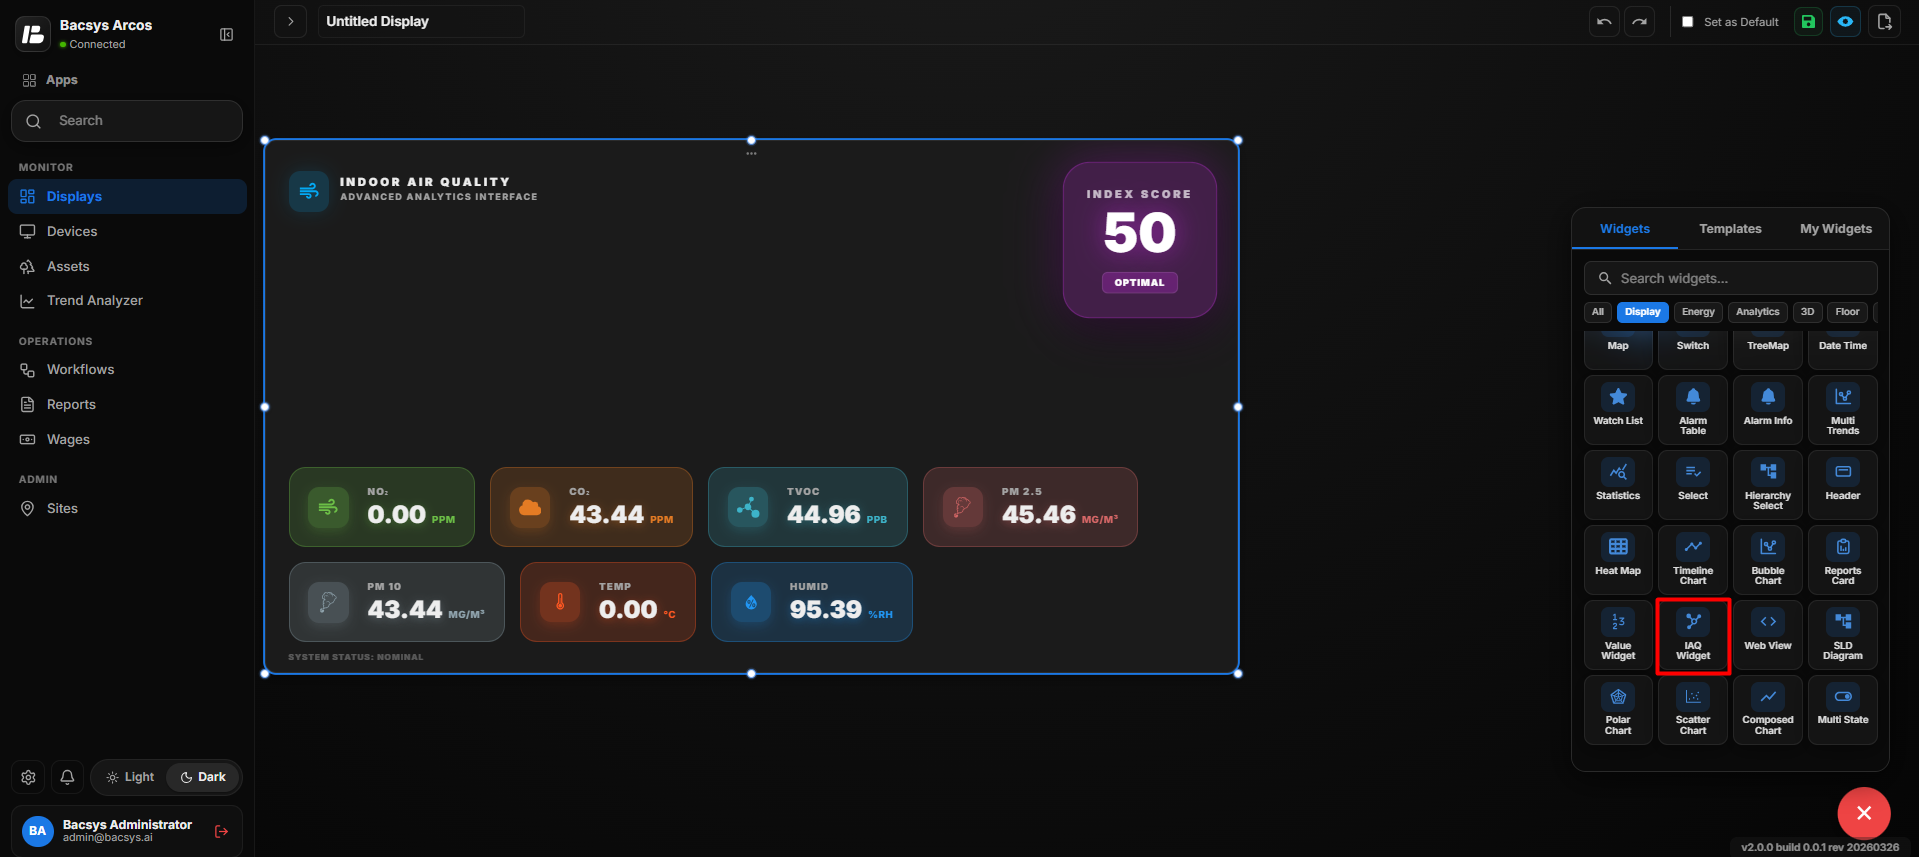
Note: Select the point that corresponds to the correct measurement. For example, select a temperature point for Temperature and a CO₂ point for CO₂.
Configure the IAQ Widget
- Enter the required Title.
- If required, upload an Image using Drag & Drop Image or Browse Files.
- Select the required Temperature point.
- Select the required Humidity point.
- Select the required CO₂ point.
- Select the required TVOC point.
- Select the required PM 2.5 point.
- Select the required PM 10 point.
- Select the required NO₂ point.
- Select the required IAQ Index point.
- Configure Show Background according to your requirement.
- Configure Hide Header according to your requirement.
- Review all the configured settings.
- Click Save.
IAQ Measurements
| Measurement | Description |
|---|---|
| Temperature | Displays the indoor temperature value. |
| Humidity | Displays the indoor relative humidity value. |
| CO₂ | Displays the carbon dioxide concentration. |
| TVOC | Displays the total volatile organic compounds level. |
| PM 2.5 | Displays the concentration of fine particulate matter with a diameter of 2.5 micrometers or smaller. |
| PM 10 | Displays the concentration of particulate matter with a diameter of 10 micrometers or smaller. |
| NO₂ | Displays the nitrogen dioxide concentration. |
| IAQ Index | Displays the configured Indoor Air Quality index value. |
Save the Configuration
After clicking Save, the IAQ Widget is updated on the display with the configured IAQ points and appearance settings.
The widget uses the selected points to display the corresponding indoor air quality and environmental measurements.
Add and Configure the Web View Widget
The Web View Widget allows users to create and display a custom widget using HTML, CSS, and JavaScript. Users can create their own widget layout, define data bindings, use predefined templates, and preview the widget before saving it.
Add the Web View Widget
- Click the + icon.
- Drag and drop the Web View Widget onto the display.
- Select the Web View Widget.
- Click Settings to open the Web View Widget Editor.
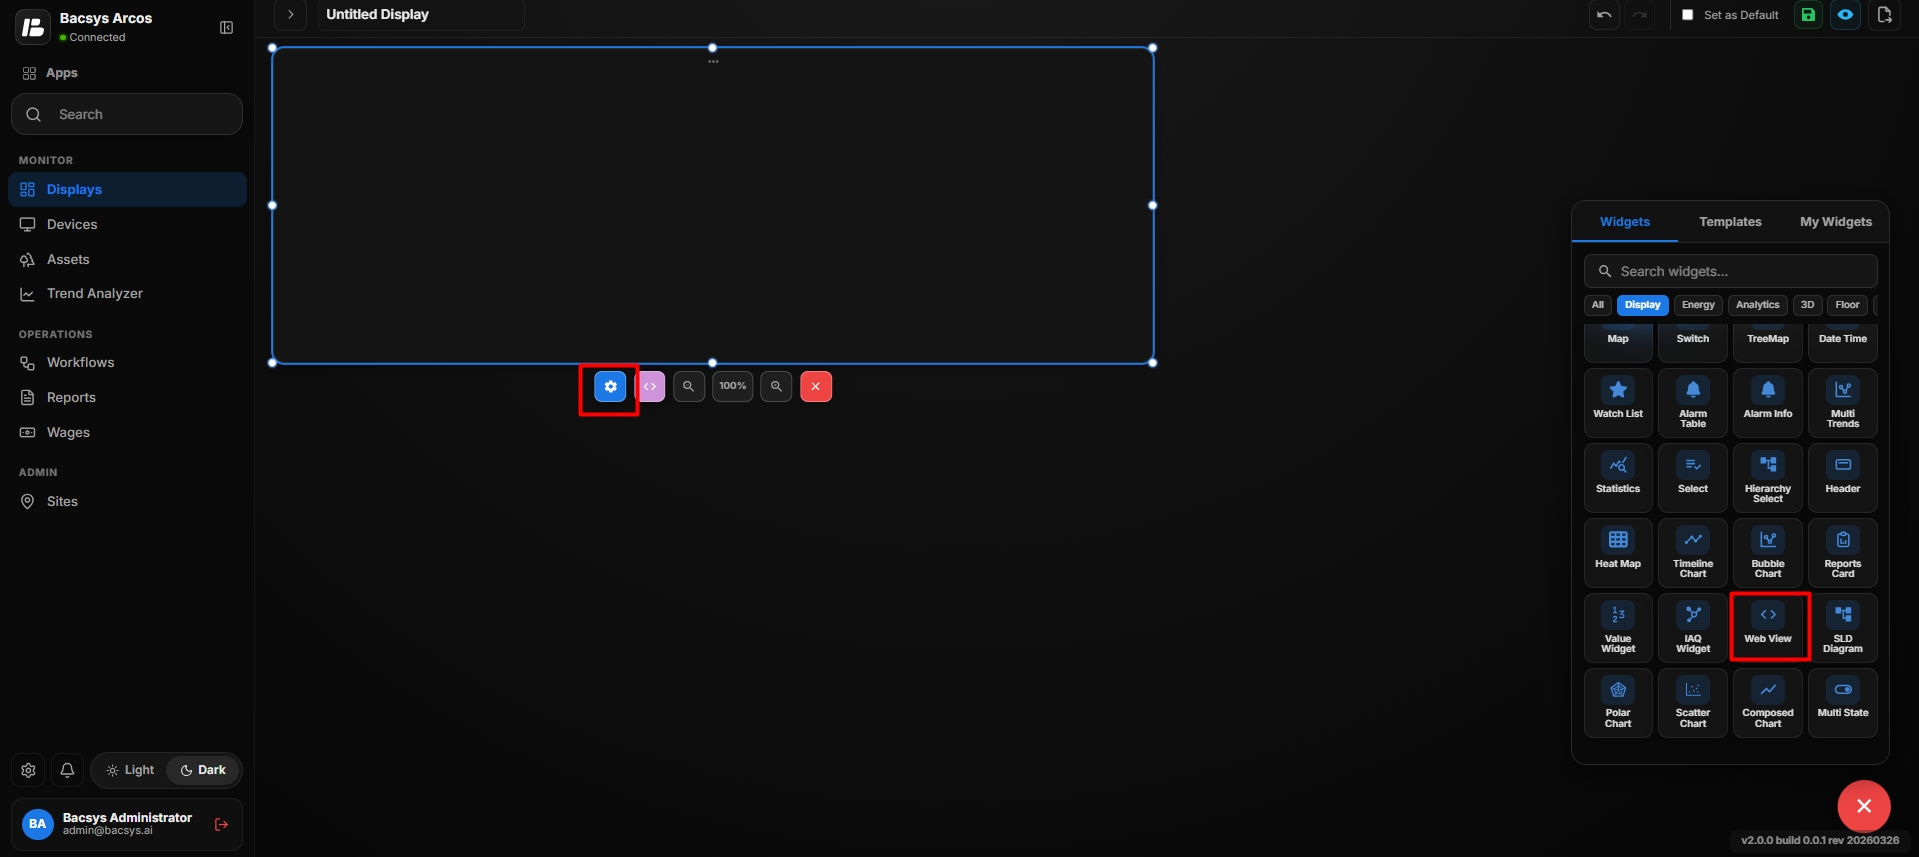
Web View Widget Editor
The Web View Widget Editor provides an editor where users can create and configure their own custom widget.
The editor contains the following sections:
- Bindings
- Docs
- Code Editor
- Preview
- Templates
Use Template
The Use Template option provides predefined widget templates that can be used as a starting point for creating a custom widget.
Available templates include:
- Blank
- Live Value Card
- Trend Table
- Bar Chart
- Line Chart
- Duty Cycle (Direct API)
- Consumption Compare (Direct API)
- Multi-Meter Comparison (Direct API)
- Radial Gauge
- KPI Card with Sparkline
- Consumption Heatmap Calendar
- Equipment Status Board
Select a template to automatically load the corresponding widget structure into the editor. The template can then be customized according to the requirement.
Create a Custom Widget
Users can also create a widget from scratch by selecting Blank.
The code editor provides an HTML structure where users can define:
- HTML for the widget structure
- CSS for styling and layout
- JavaScript for widget behavior and data handling
Users can modify the code to create their required widget design and functionality.
Bindings
The Bindings section allows users to define named data bindings that can be referenced from the widget's JavaScript code.
- Click Add Binding.
- Enter the required binding details.
- Define the binding name.
- Configure the required point or data source.
- Use the binding in the widget code to receive live point values.
Bindings allow the custom widget to display live data from configured points.
Generate Bindings
The Generate Bindings option can be used to create bindings for the custom widget.
After configuring the required bindings, they can be referenced from the JavaScript code to display live values in the widget.
Preview
The Preview section displays a preview of the custom widget layout.
Users can use the preview to verify:
- Widget layout
- Styling
- Data display
- Binding behavior
- Overall appearance
The preview can be used to check the widget before saving it.
Sample Data
The Sample Data option can be used to display sample values in the preview.
This allows users to verify how the widget will look when data is available.
Copy AI Spec
The Copy AI Spec option allows users to copy the widget specification so that it can be used as input for creating or modifying the widget with AI-assisted development.
Save as Widget
After creating and configuring the custom widget, click Save as Widget to save the custom Web View widget for reuse.
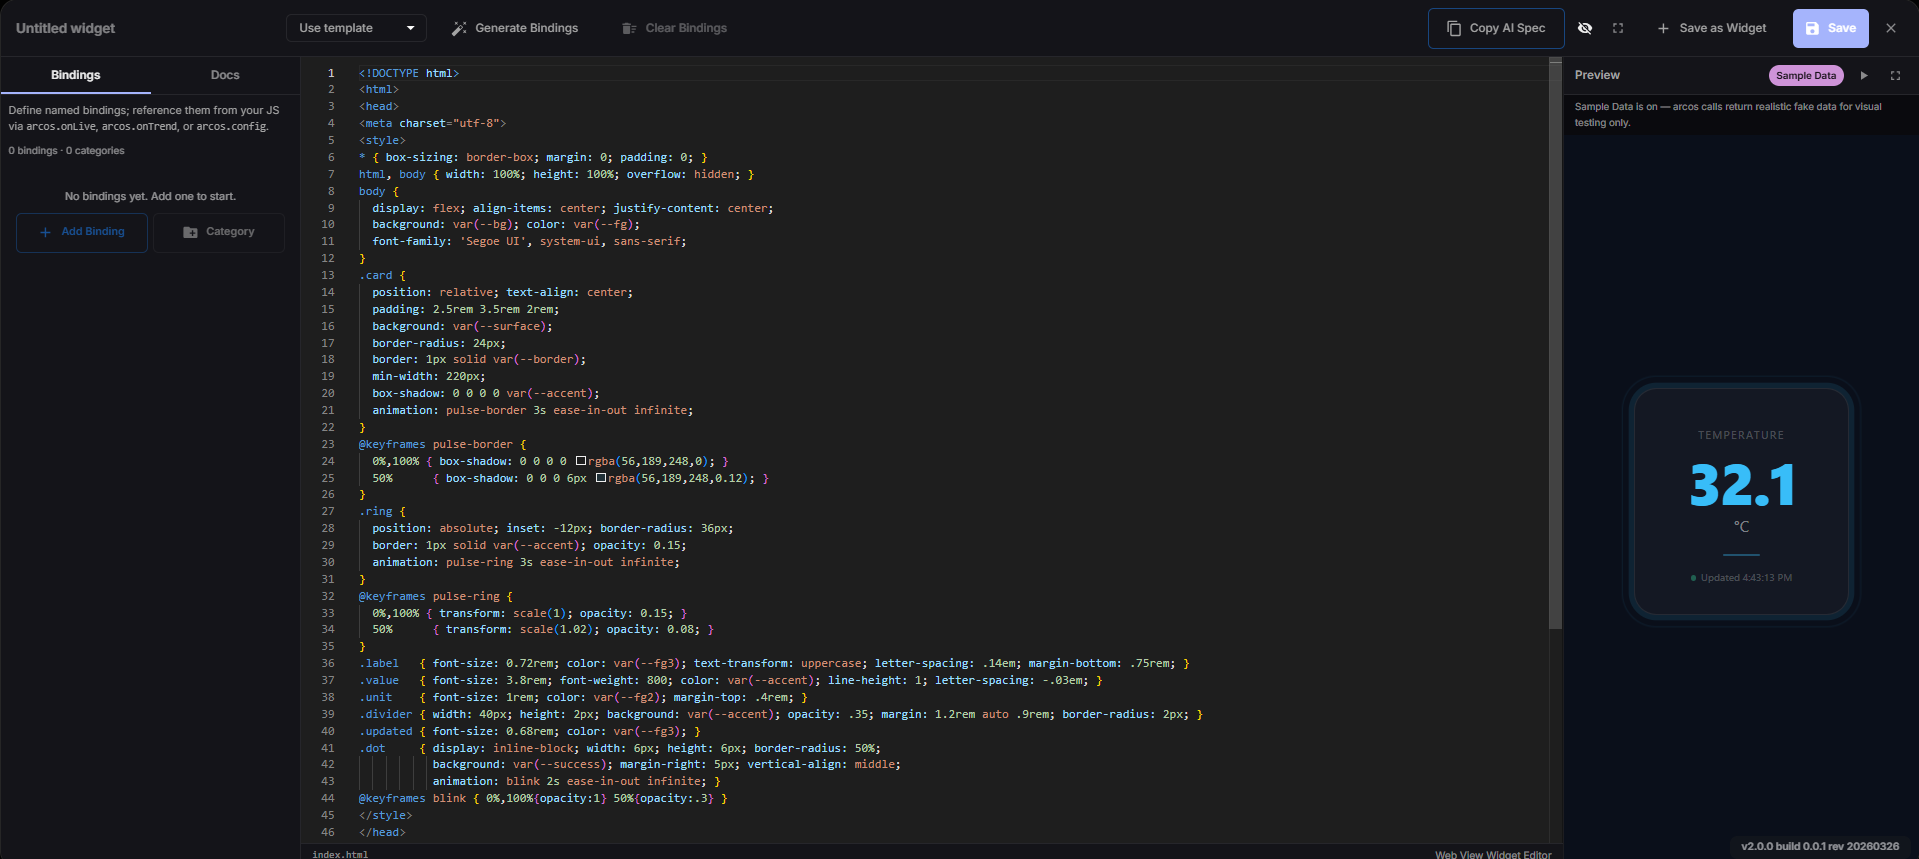
Save the Web View Widget
- Select a predefined Template or start with Blank.
- Modify the HTML, CSS, and JavaScript according to the requirement.
- Add the required Bindings.
- Configure the required data points.
- Use the bindings in the widget code.
- Check the widget in the Preview section.
- Verify the widget layout and data.
- Click Save as Widget if the widget needs to be saved as a reusable widget.
- Click Save to save the current configuration.
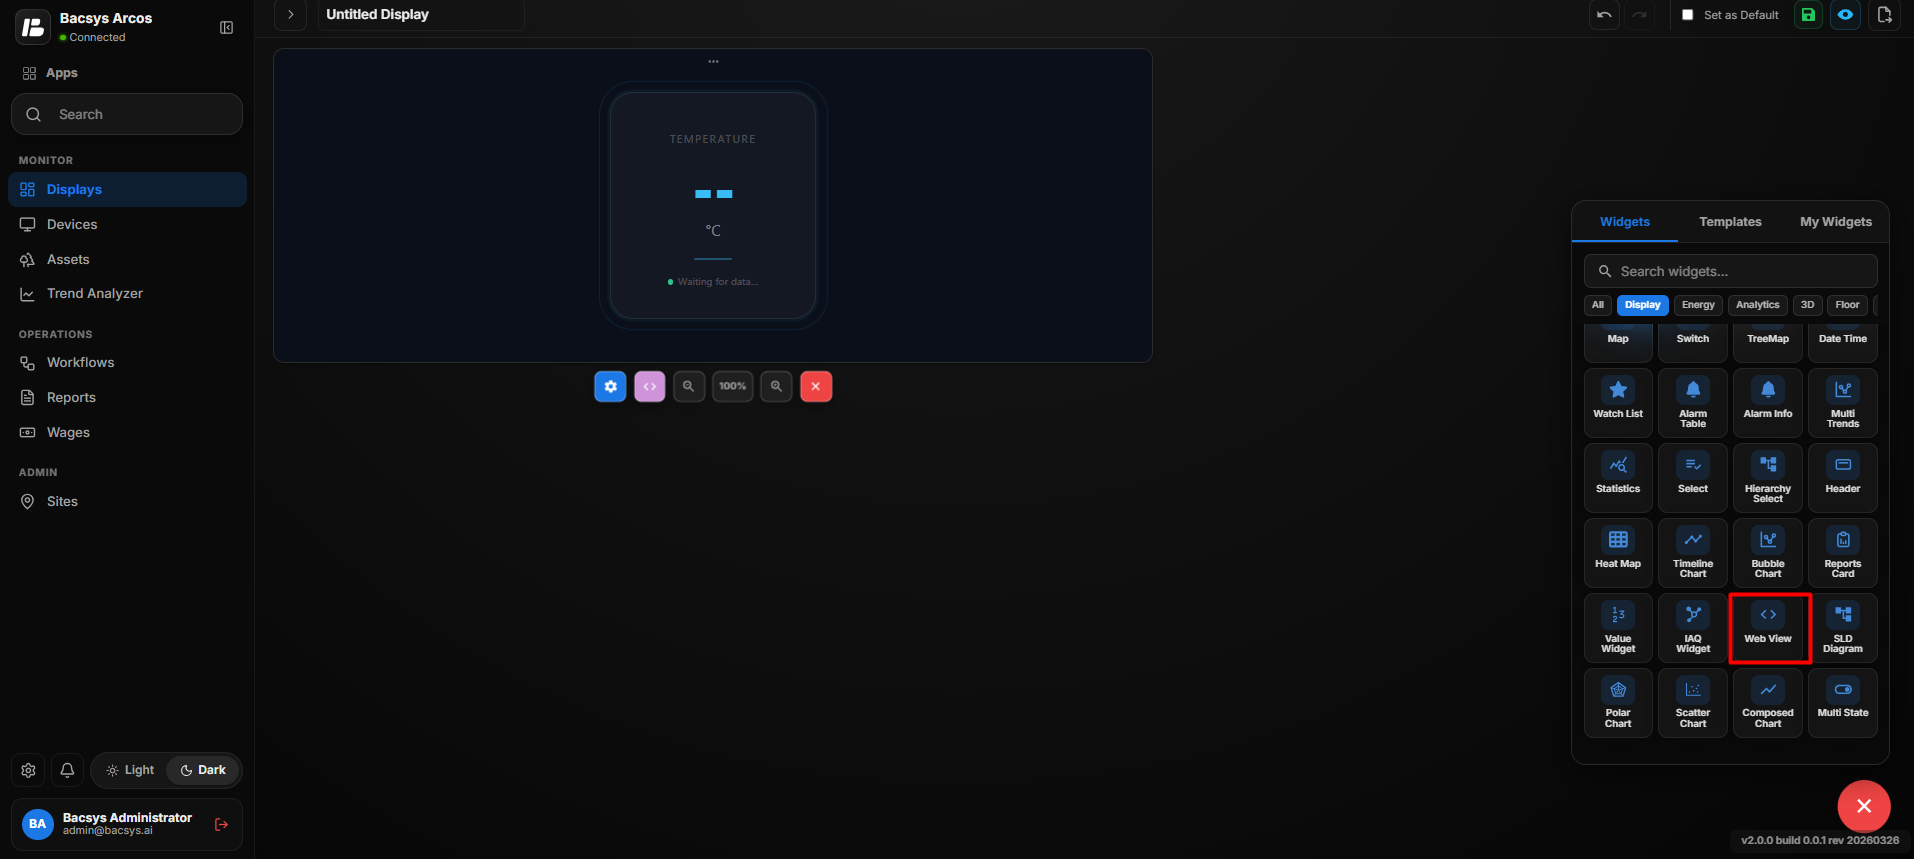
Web View Widget Use
The Web View Widget can be used when the standard prebuilt widgets do not provide the required design or functionality. It allows users to create a custom widget using web technologies and connect it to live BACsys point data through bindings.
Add and Configure the SLD Widget
The SLD (Single-Line Diagram) Widget allows users to create electrical system diagrams by adding predefined electrical symbols and components to the display. Users can drag and drop or click the required symbols to build an SLD layout.
Add the SLD Widget
- Click the + icon.
- Drag and drop the SLD Widget onto the display.
- Select the SLD Widget to open the Widget Picker.
- The Widget Picker displays the available SLD symbols grouped into different categories.
- Use the Zoom In and Zoom Out controls to adjust the SLD diagram view.
- Use Fit to View to automatically fit the SLD diagram within the available canvas area.
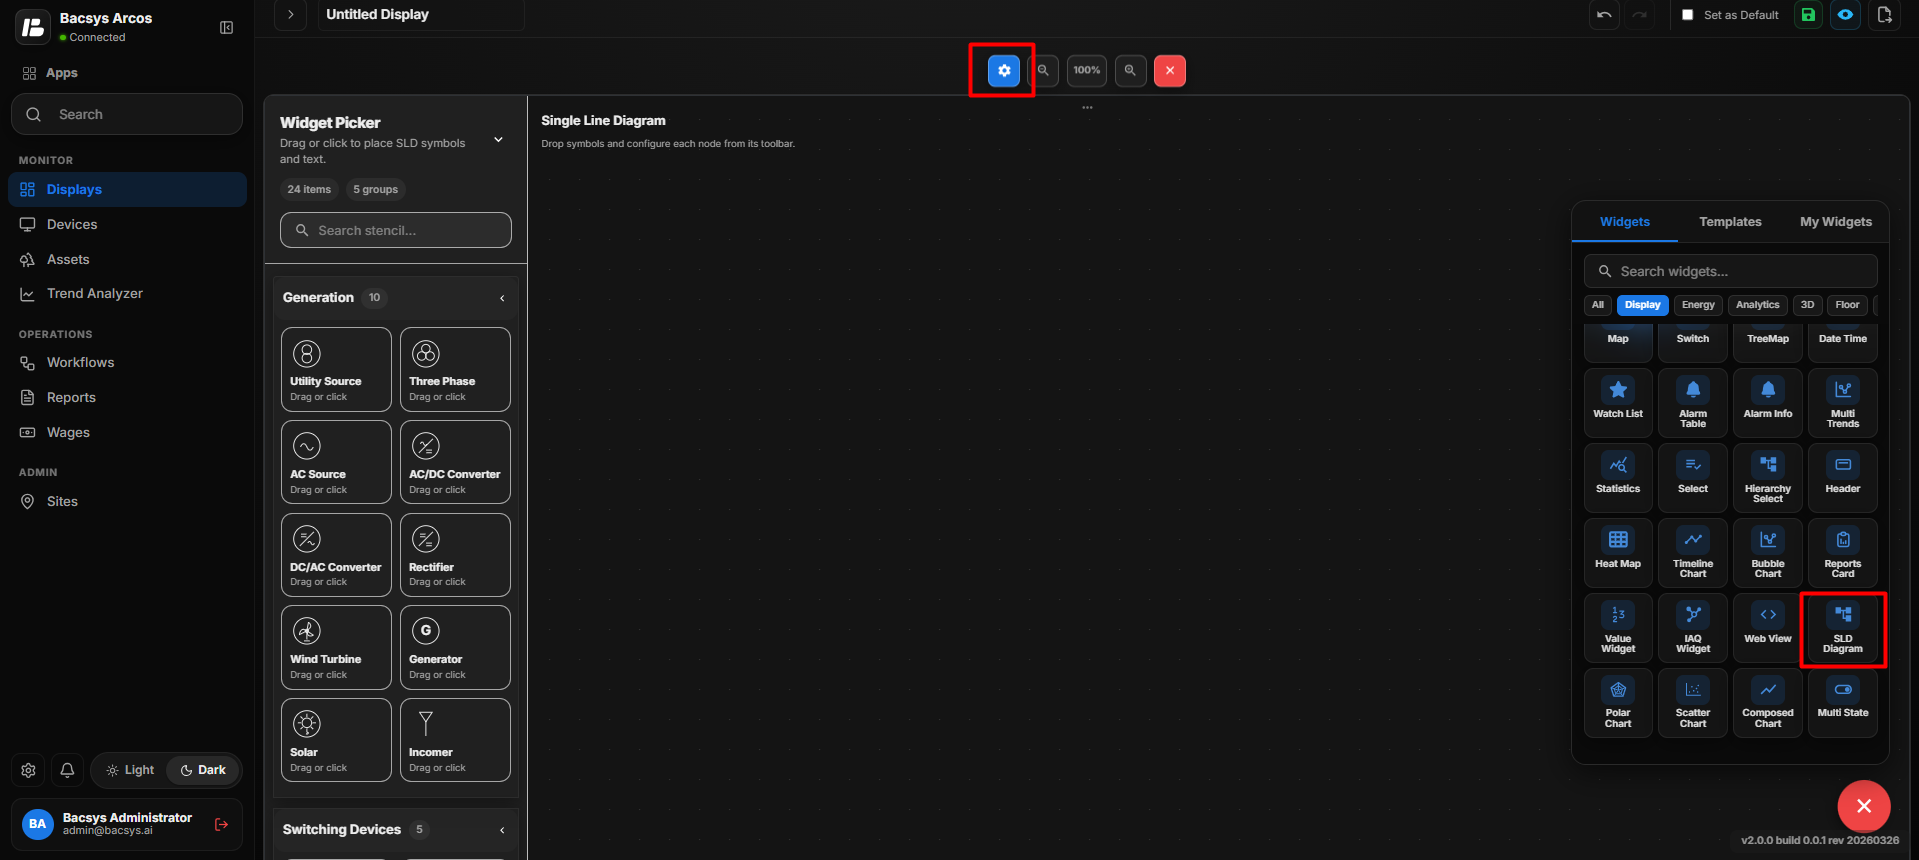
Widget Picker
The Widget Picker contains predefined symbols that can be added to the SLD diagram.
It includes:
- 24 Items
- 5 Groups
- Search Stencil – Use the search field to quickly find a required symbol.
SLD Symbol Groups
| Group | Available Symbols | Description |
|---|---|---|
| Generation | Utility Source, Three Phase, AC Source, AC/DC Converter, DC/AC Converter, Rectifier, Wind Turbine, Generator, Solar, Incomer | Represents power generation and power supply components. |
| Switching Devices | Busbar, Fused Switch, Selector Switch, Changeover Switch, Isolator | Represents devices used for switching, isolation, and electrical distribution. |
| Monitoring | Indicator, Meter | Represents electrical monitoring and measurement components. |
| Loads | Plug Load, Load, Motor, Converter Load, Battery, Ground | Represents different types of electrical loads and connection components. |
| General | Text | Allows users to add text or labels to the SLD diagram. |
Add an SLD Symbol
There are two ways to add a symbol to the diagram:
-
Drag and Drop
- Select the required symbol from the Widget Picker.
- Drag the symbol onto the SLD canvas.
- Drop it at the required location.
-
Click to Add
- Click the required symbol in the Widget Picker.
- The symbol is added to the SLD canvas.
- Position it as required.
Generation
The Generation group contains components related to power generation and power sources.
Available symbols:
- Utility Source
- Three Phase
- AC Source
- AC/DC Converter
- DC/AC Converter
- Rectifier
- Wind Turbine
- Generator
- Solar
- Incomer
These symbols can be used to represent power sources and generation equipment in the SLD.
Switching Devices
The Switching Devices group contains components used for switching, isolation, and electrical distribution.
Available symbols:
- Busbar
- Fused Switch
- Selector Switch
- Changeover Switch
- Isolator
These components can be placed between electrical sources and loads to represent the switching arrangement.
Monitoring
The Monitoring group contains components used to represent electrical monitoring devices.
Available symbols:
- Indicator
- Meter
These can be used to represent status indicators and measurement devices within the SLD.
Loads
The Loads group contains components representing electrical loads and related connection elements.
Available symbols:
- Plug Load
- Load
- Motor
- Converter Load
- Battery
- Ground
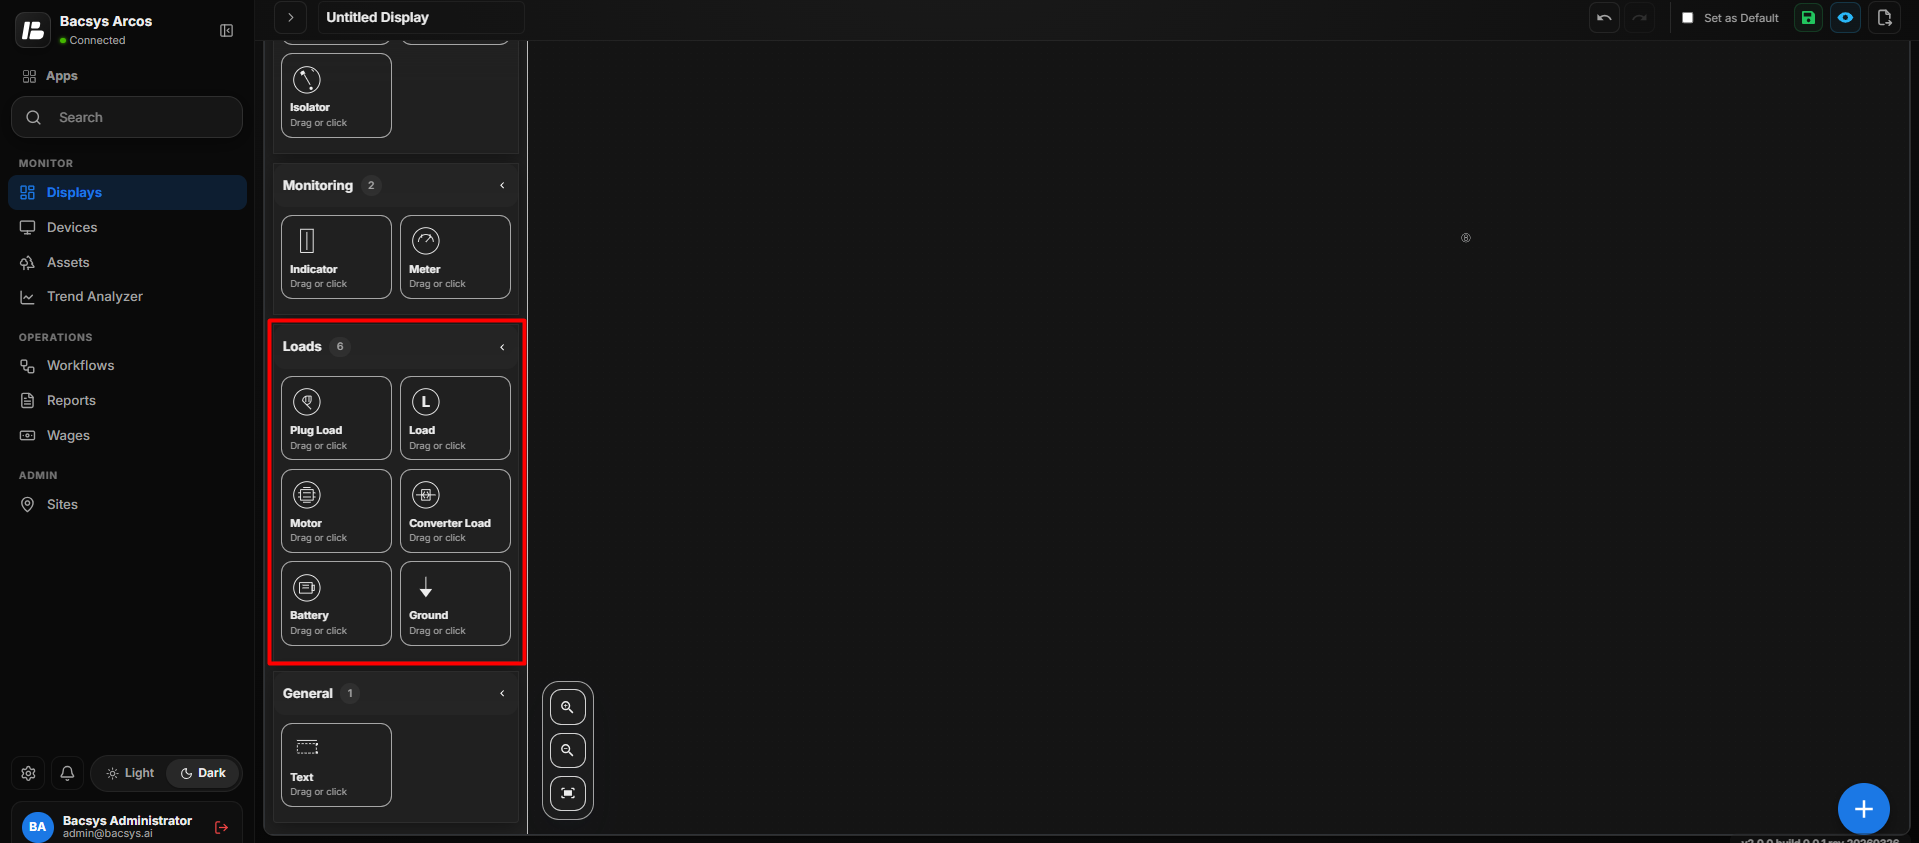
These symbols can be used to represent different electrical loads and supporting components.
General
The General group contains:
- Text – Add text or labels to the SLD diagram.
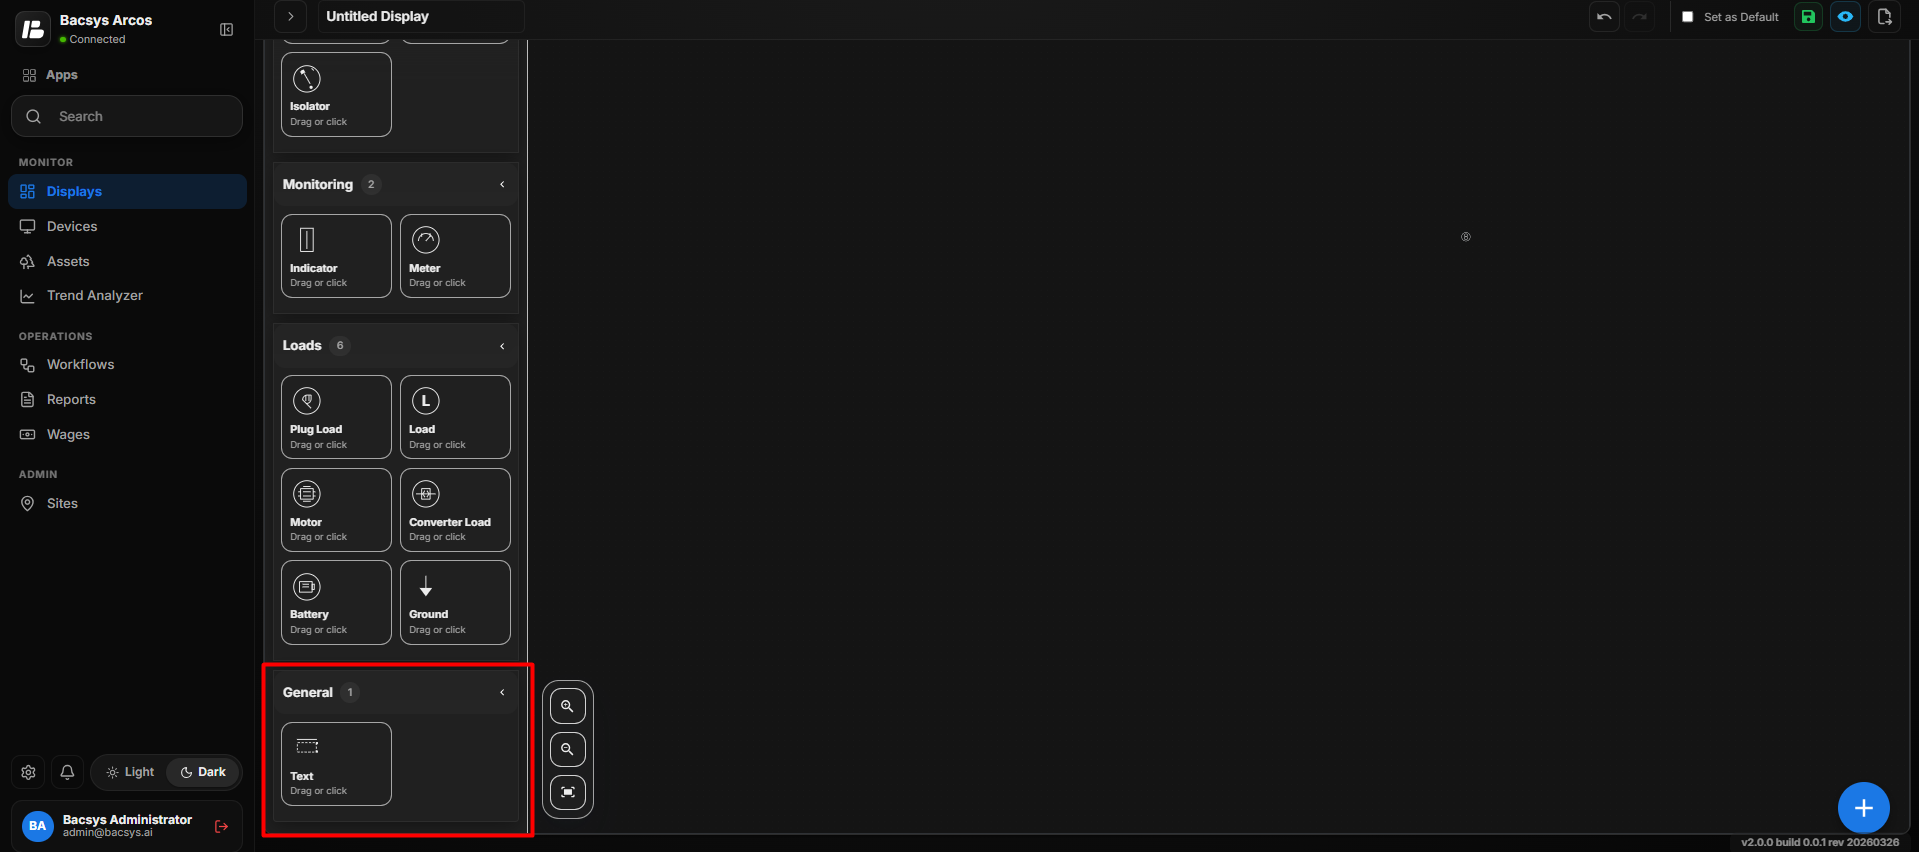
Search for a Symbol
If the required symbol is difficult to locate:
- Click the Search Stencil field.
- Enter the name of the required symbol.
- The Widget Picker displays matching symbols.
- Drag and drop or click the required symbol to add it to the SLD.
SLD Canvas Controls
The SLD Widget also provides canvas controls that can be used to manage the diagram view:
- Zoom In – Increase the diagram size for better visibility.
- Zoom Out – Decrease the diagram size to view more of the diagram.
- Fit to View – Adjust the diagram to fit within the available canvas area.
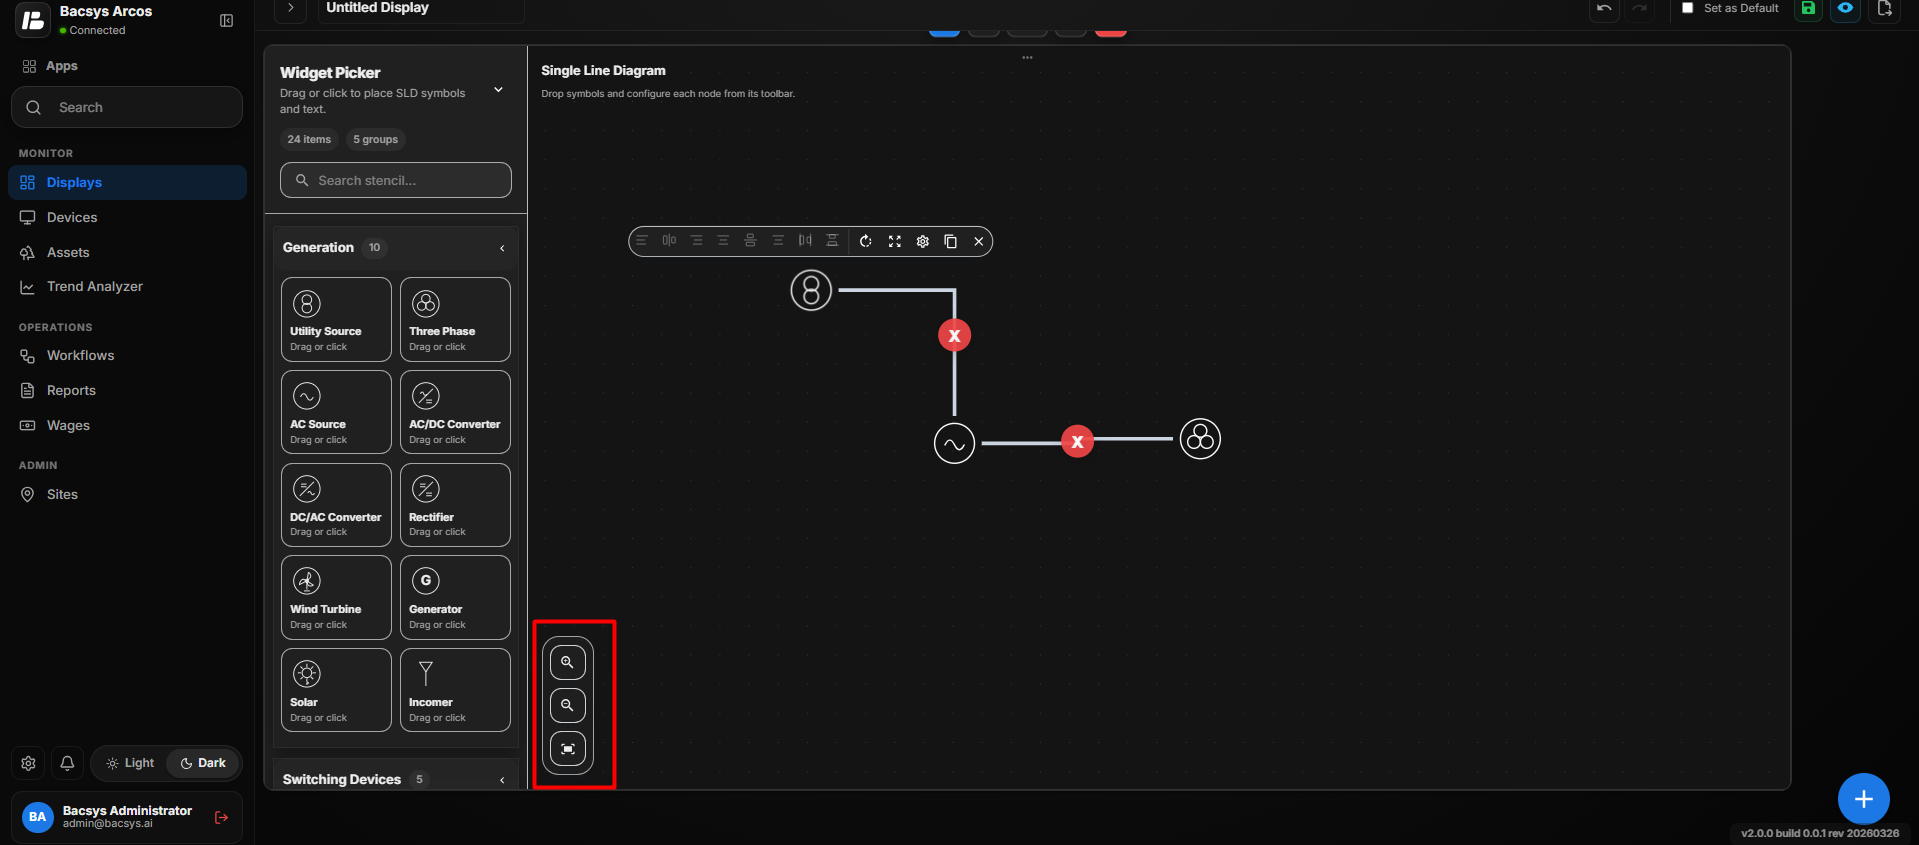
Build the SLD Diagram
- Add the required Generation components.
- Add the required Switching Devices.
- Add Monitoring components where required.
- Add the required Loads.
- Add Text labels if required.
- Arrange the symbols on the canvas.
- Connect and organize the components according to the required electrical diagram.
- Use the zoom controls to adjust the diagram view.
- Review the completed SLD layout.
- Save the display.
SLD Symbol Actions
After adding an SLD symbol to the Single Line Diagram canvas, select the symbol to display its editing toolbar.
The toolbar provides the following options:
| Option | Description |
|---|---|
| Align Left | Aligns the selected SLD symbol to the left. |
| Align Center | Aligns the selected symbol to the center. |
| Align Right | Aligns the selected symbol to the right. |
| Align Top | Aligns the selected symbol to the top. |
| Align Middle | Aligns the selected symbol vertically to the middle. |
| Align Bottom | Aligns the selected symbol to the bottom. |
| Rotate | Rotates the selected SLD symbol. |
| Fit / Resize | Adjusts the selected symbol to fit the required size or view. |
| Settings | Opens the configuration settings for the selected SLD symbol. |
| Duplicate | Creates a copy of the selected SLD symbol. |
| Delete | Removes the selected SLD symbol from the canvas. |
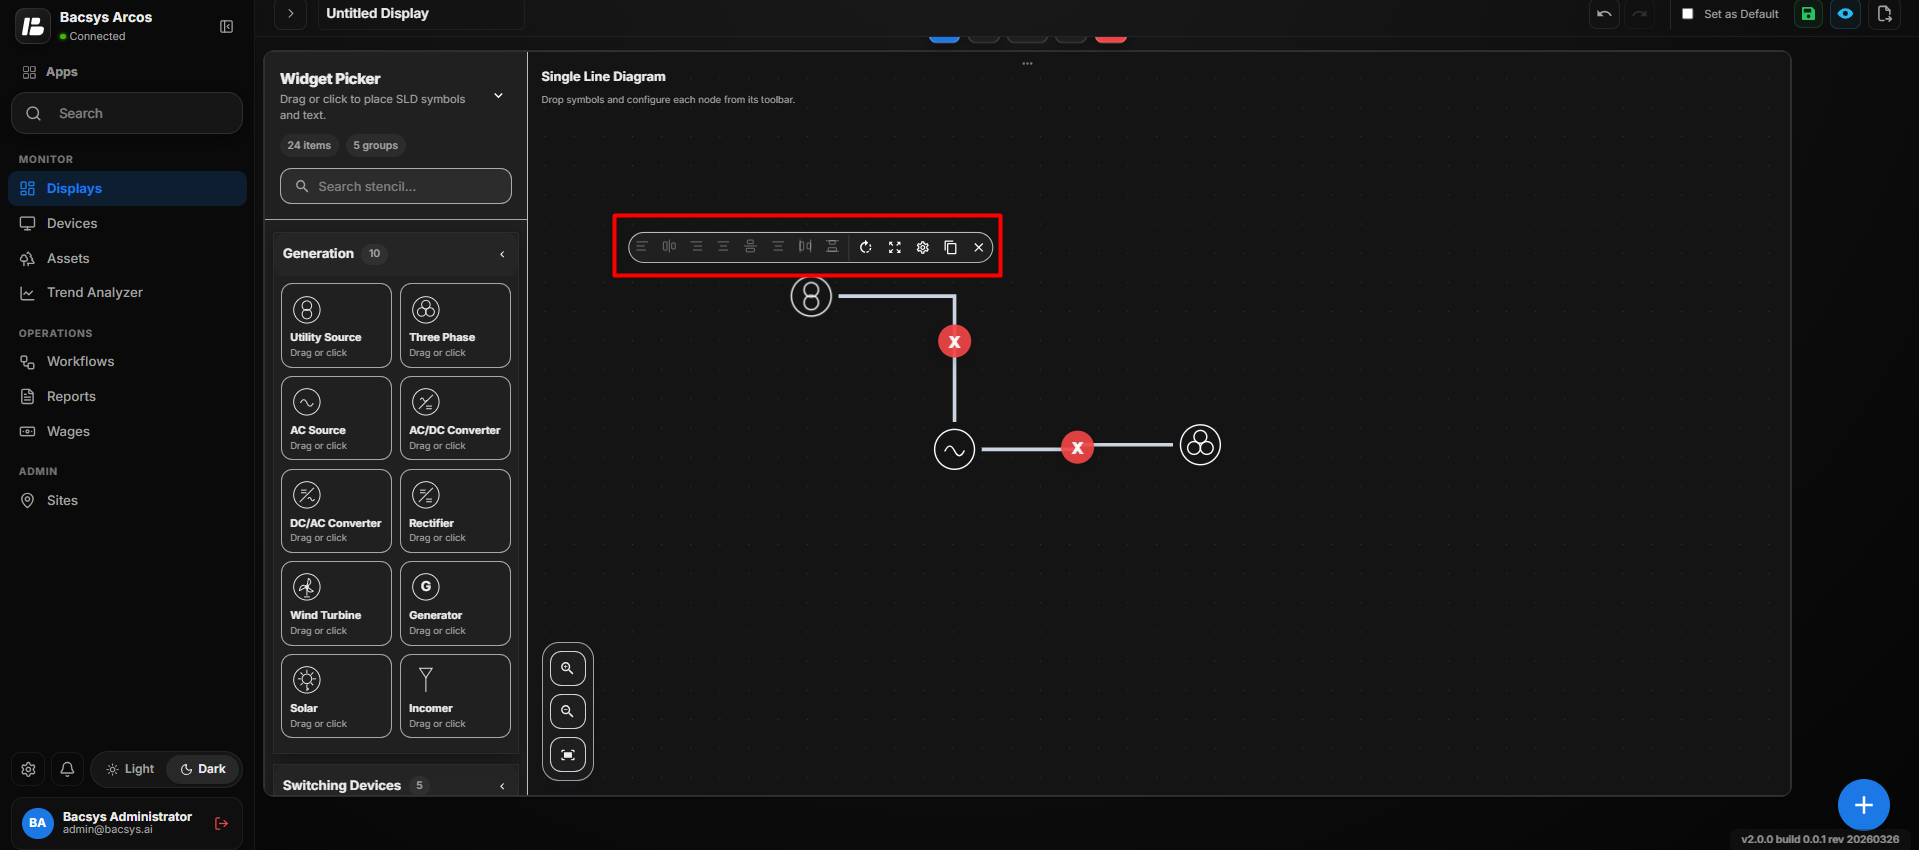
Configure an SLD Symbol
- Add the required SLD symbol to the canvas.
- Click the symbol to display the editing toolbar.
- Use the alignment options to position the symbol correctly.
- Use Rotate if the symbol needs to be rotated.
- Use Fit / Resize to adjust the symbol.
- Click Settings to configure the symbol properties.
- Use Duplicate if another copy of the same symbol is required.
- Click Delete to remove the symbol when it is no longer required.
These options allow users to position, align, rotate, configure, duplicate, and remove individual SLD symbols after they have been added to the canvas.
SLD Widget Use
The SLD Widget is used to create a visual representation of an electrical system. It helps users represent power sources, generation equipment, switching devices, monitoring devices, loads, and electrical connections in a single-line diagram format.
Add and Configure the Polar Widget
The Polar Widget displays selected point values using a polar chart visualization. It allows users to monitor multiple points and compare their values visually around a circular chart.
Add the Polar Widget
- Click the + icon.
- Drag and drop the Polar Widget onto the display.
- Select the Polar Widget to view the available widget actions:
- Zoom In
- Zoom Out
- Settings
- Remove Widget
- Click Settings to open the Configure Data panel.
- Configure the required options.
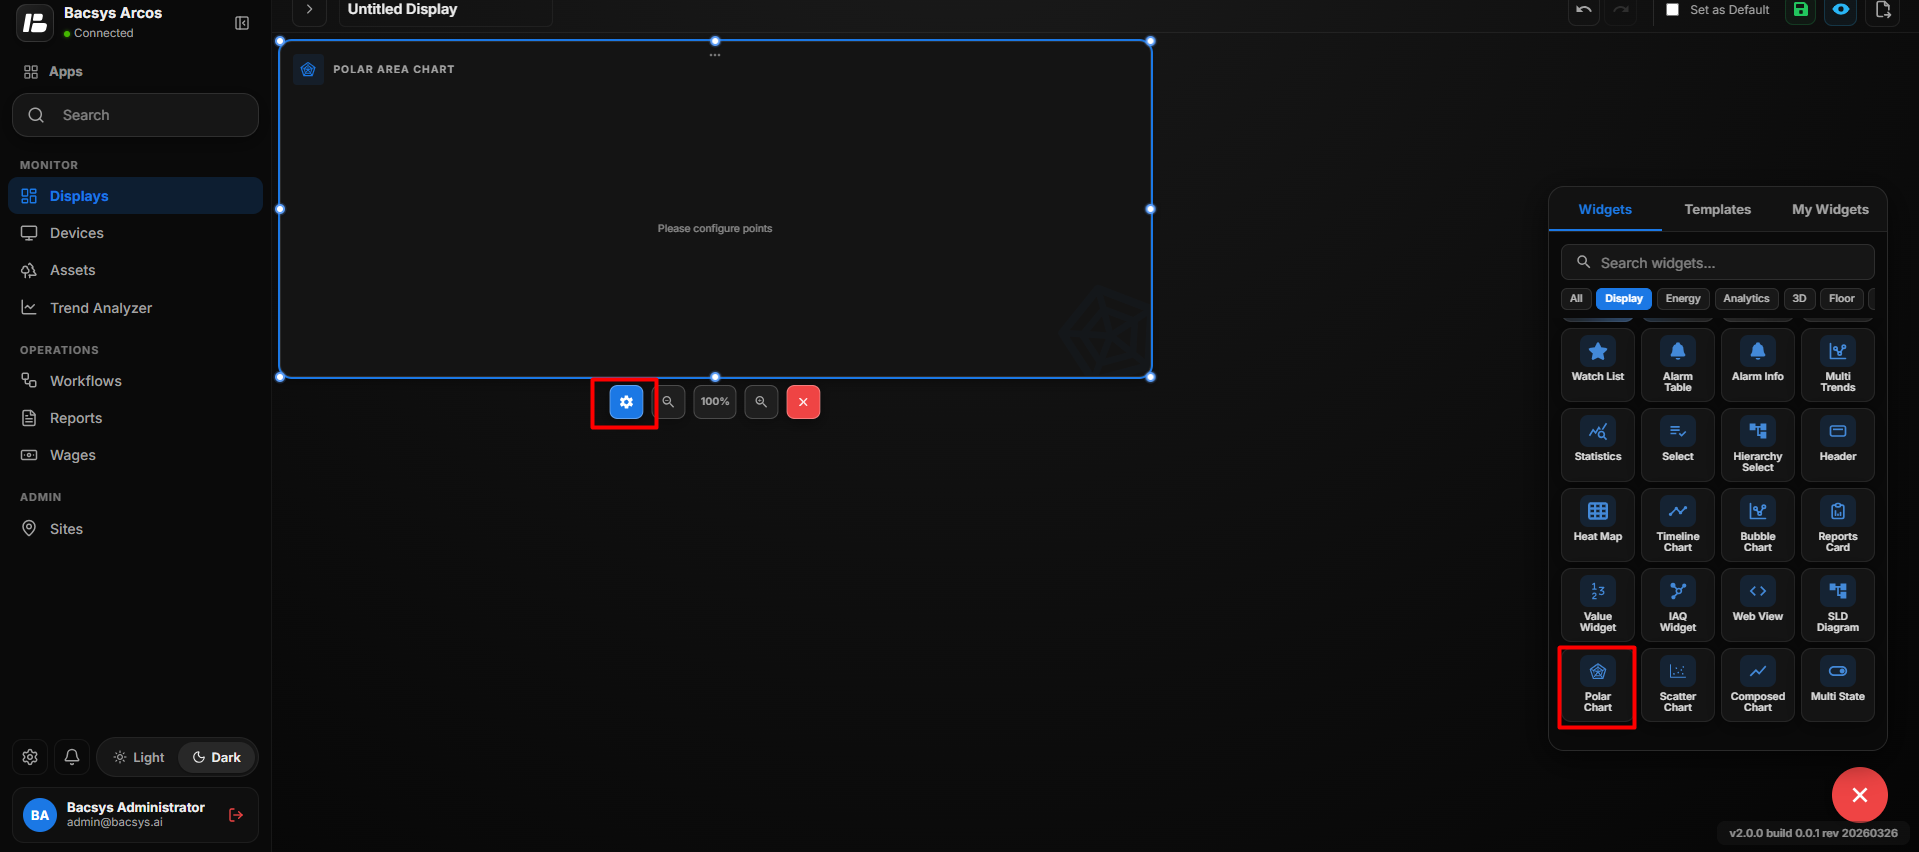
Polar Widget Settings
| Option | Description |
|---|---|
| Title | Enter a title for the Polar Widget. The title is displayed at the top of the widget. |
| Subtitle | Enter an optional subtitle to provide additional information about the widget. |
| Select Points | Select the points that should be displayed in the Polar Widget. Click Browse Hierarchy to select points from the network hierarchy. |
| Poll Frequency (Seconds) | Specify how frequently the widget retrieves or refreshes the selected point values. |
| Show Background | Use the toggle button to show or hide the widget background. |
| Hide Header | Use the toggle button to show or hide the widget header, including the title and subtitle. |
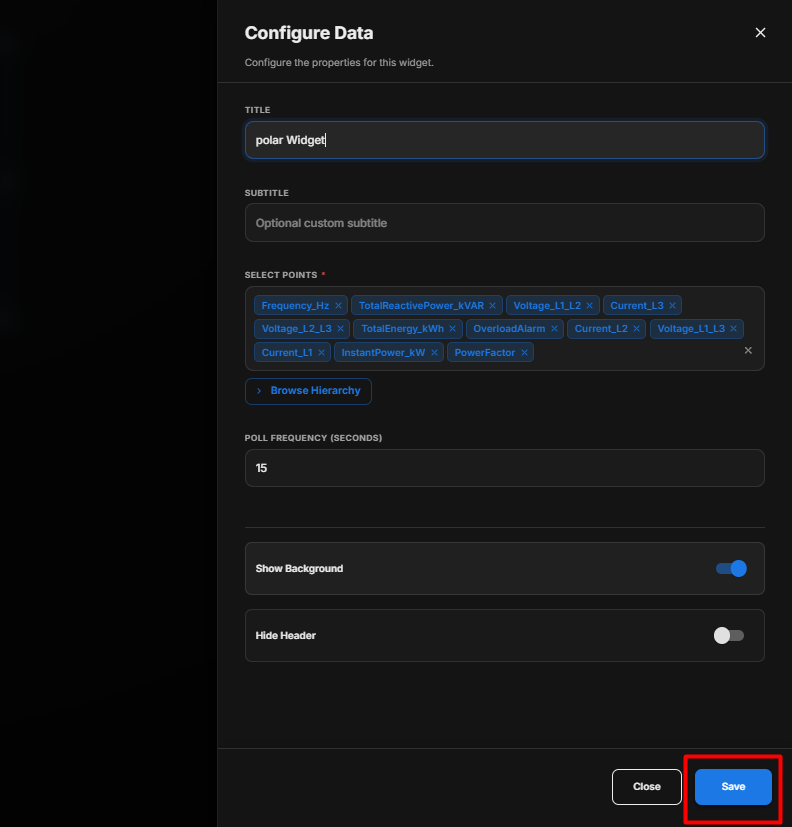
Select Points
- Click Browse Hierarchy.
- Navigate through the available Network → Device → Point hierarchy.
- Select the required points.
- The selected points are displayed in the Select Points field.
- Multiple points can be selected for comparison in the Polar Widget.
Configure the Polar Widget
- Enter the required Title.
- Enter an optional Subtitle.
- Click Browse Hierarchy and select the required points.
- Set the required Poll Frequency (Seconds).
- Enable or disable Show Background according to your requirement.
- Enable Hide Header if the widget header should not be displayed.
- Review all configured settings.
- Click Save.
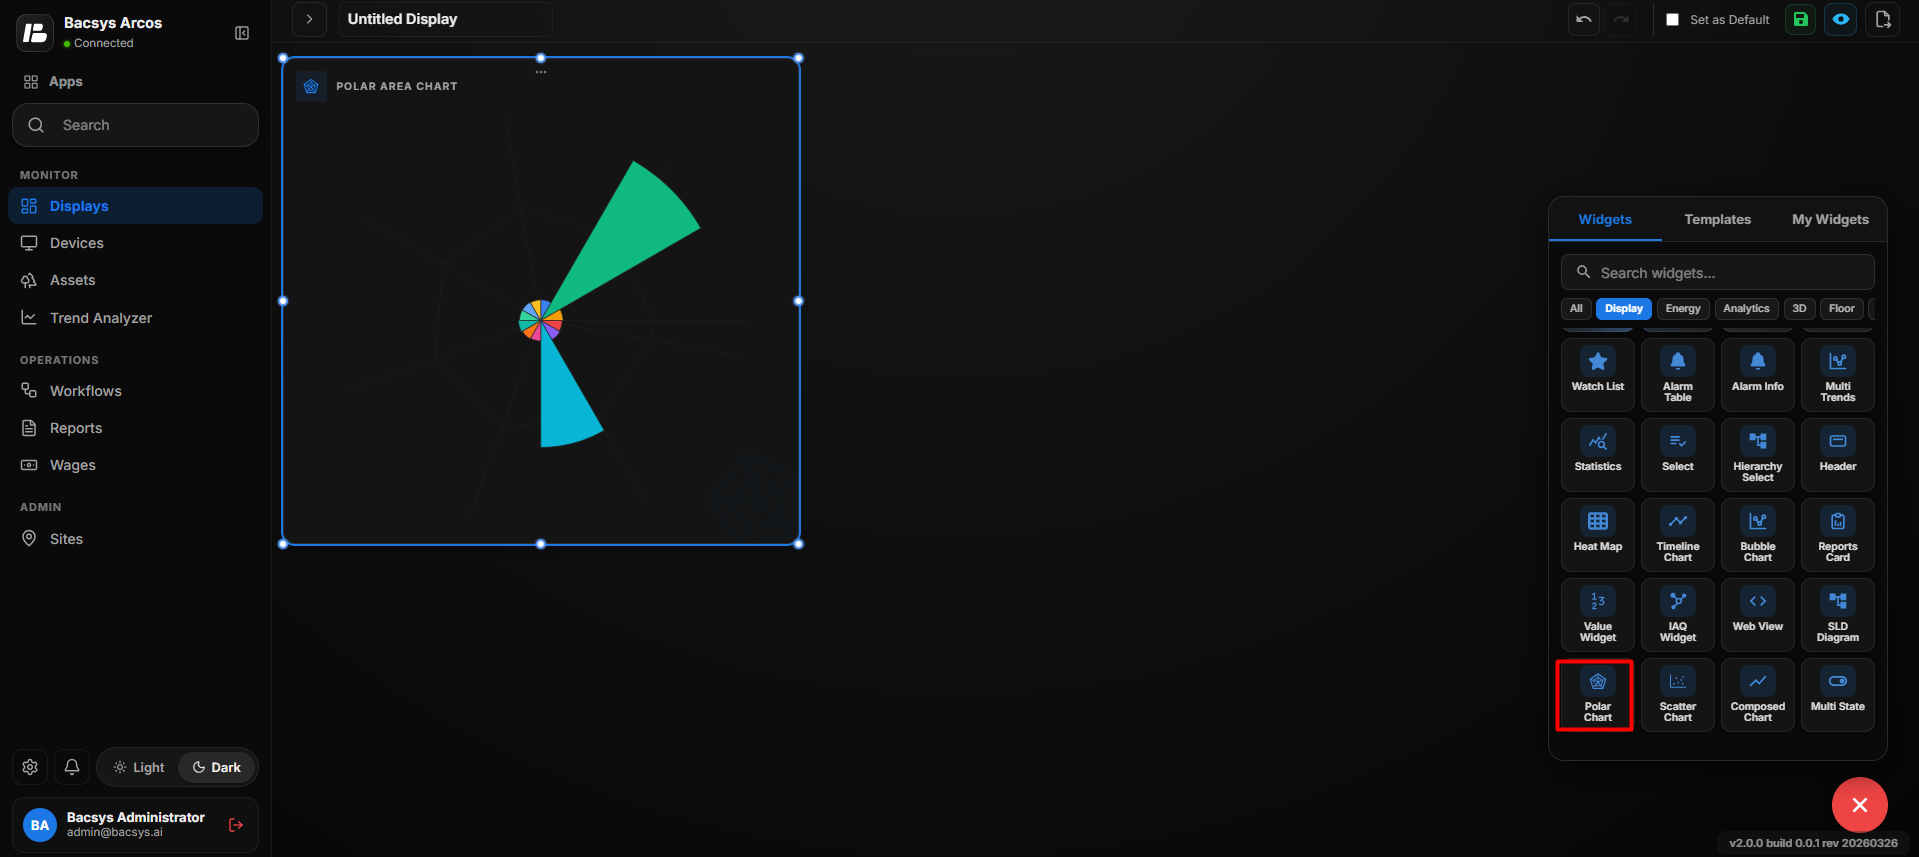
Save the Configuration
After clicking Save, the Polar Widget is updated on the display with the selected points and configured appearance settings.
The Polar Widget can then be used to visually compare the selected point values using a circular polar chart.
Add and Configure the Scatter Chart
The Scatter Chart is used to visualize relationships between selected point values. It supports two data display types: Instantaneous Value and Trend Value.
Add the Scatter Chart
- Click the + icon.
- Drag and drop the Scatter Chart onto the display.
- Select the Scatter Chart to view the available widget actions:
- Zoom In
- Zoom Out
- Settings
- Remove Widget
- Click Settings to open the Configure Data panel.
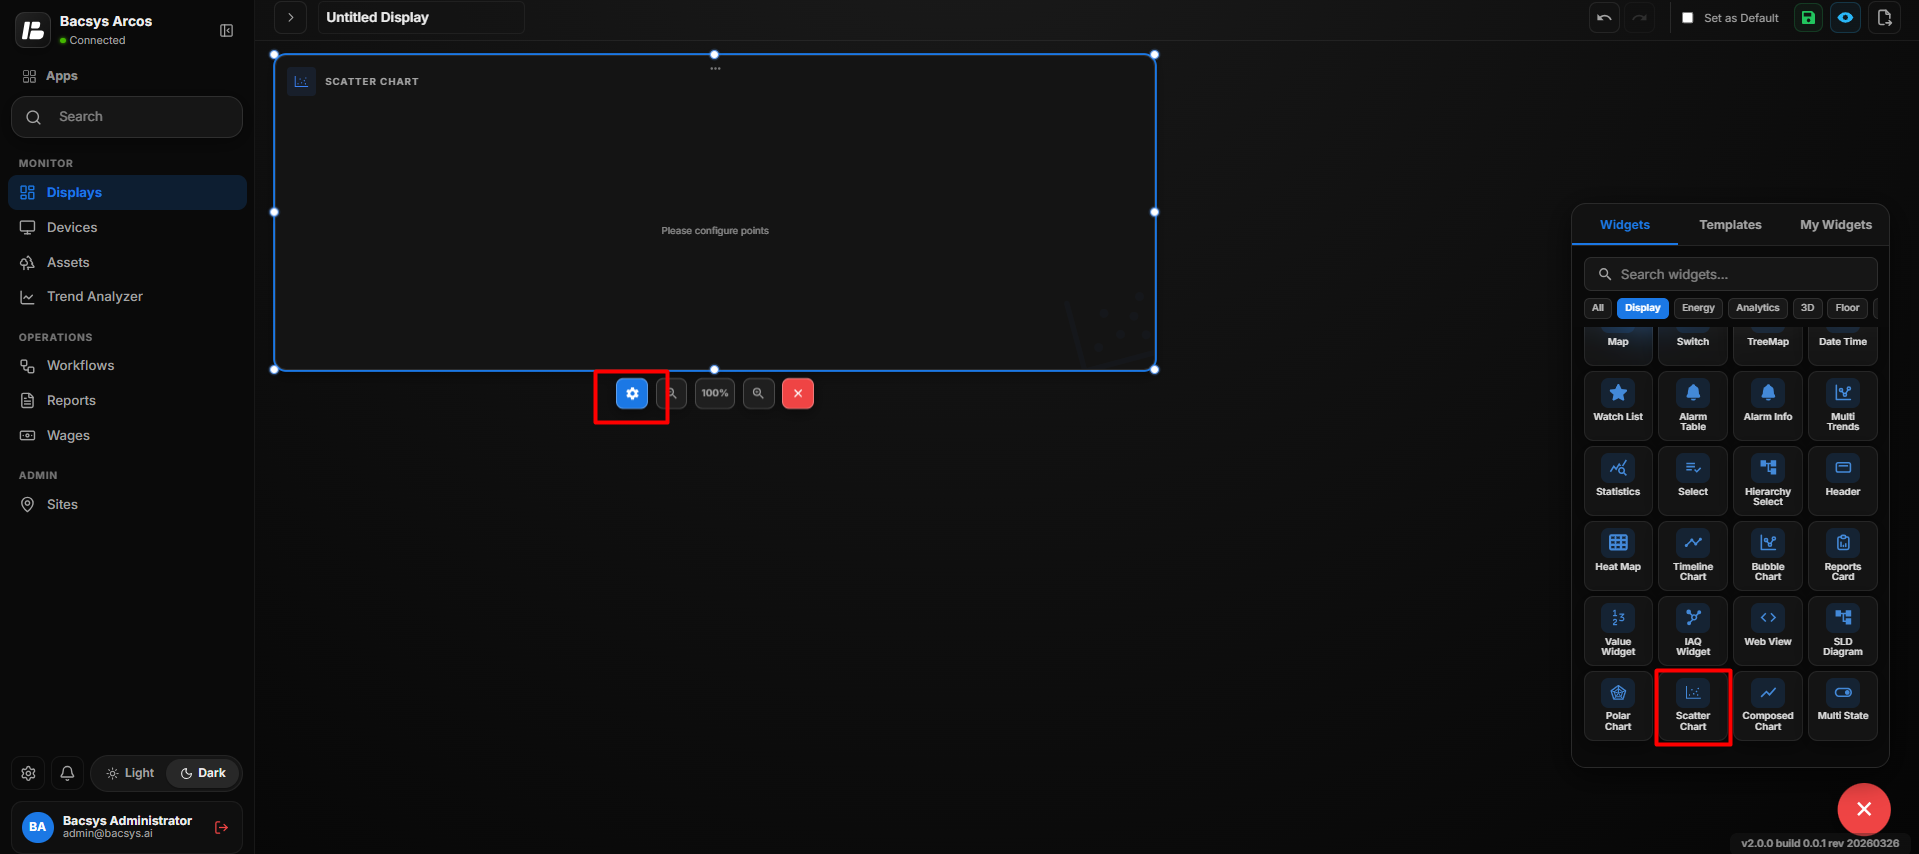
- Under Select Type, choose the required data type:
- Instantaneous Value
- Trend Value
Instantaneous Value Settings
When Instantaneous Value is selected, the following options are available:
| Option | Description |
|---|---|
| Title | Enter a title for the Scatter Chart. |
| Subtitle | Enter an optional subtitle to provide additional information about the chart. |
| Select Type | Select Instantaneous Value to display the current values of the selected points. |
| Select Points | Select the required points from the hierarchy. Click Browse Hierarchy to select points from Network → Device → Point. |
| Poll Frequency (Seconds) | Specify how frequently the selected point values are refreshed. |
| Show Background | Use the toggle button to show or hide the widget background. |
| Hide Header | Use the toggle button to show or hide the widget header, including the title and subtitle. |
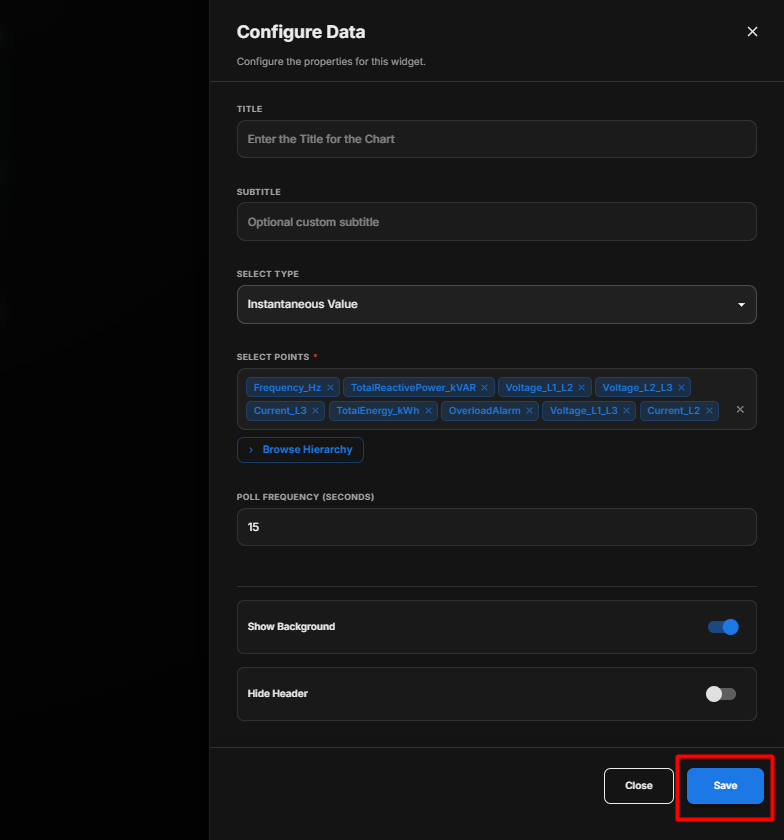
Trend Value Settings
When Trend Value is selected, the configuration includes trend-specific options.
| Option | Description |
|---|---|
| Title | Enter a title for the Scatter Chart. |
| Subtitle | Enter an optional subtitle to provide additional information about the chart. |
| Select Type | Select Trend Value to display historical trend values. |
| Select Points | Select the required trend-enabled points from the hierarchy. Only points with available trend data should be selected. |
| Select Date Ranges | Select the required date range for displaying the trend data. |
| Poll Frequency (Seconds) | Specify how frequently the widget refreshes the configured data. |
| Show Background | Use the toggle button to show or hide the widget background. |
| Hide Header | Use the toggle button to show or hide the widget header. |
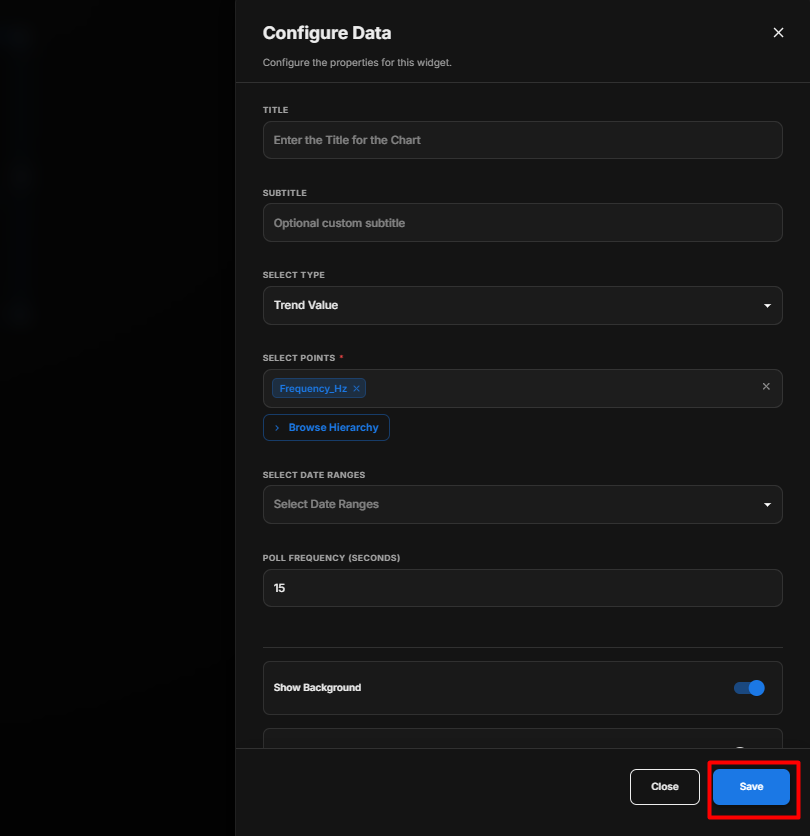
Configure the Scatter Chart
For Instantaneous Value
- Enter the required Title.
- Enter an optional Subtitle.
- Select Instantaneous Value under Select Type.
- Click Browse Hierarchy.
- Select the required points.
- Set the Poll Frequency (Seconds).
- Configure Show Background according to your requirement.
- Configure Hide Header according to your requirement.
- Review the configuration.
- Click Save.
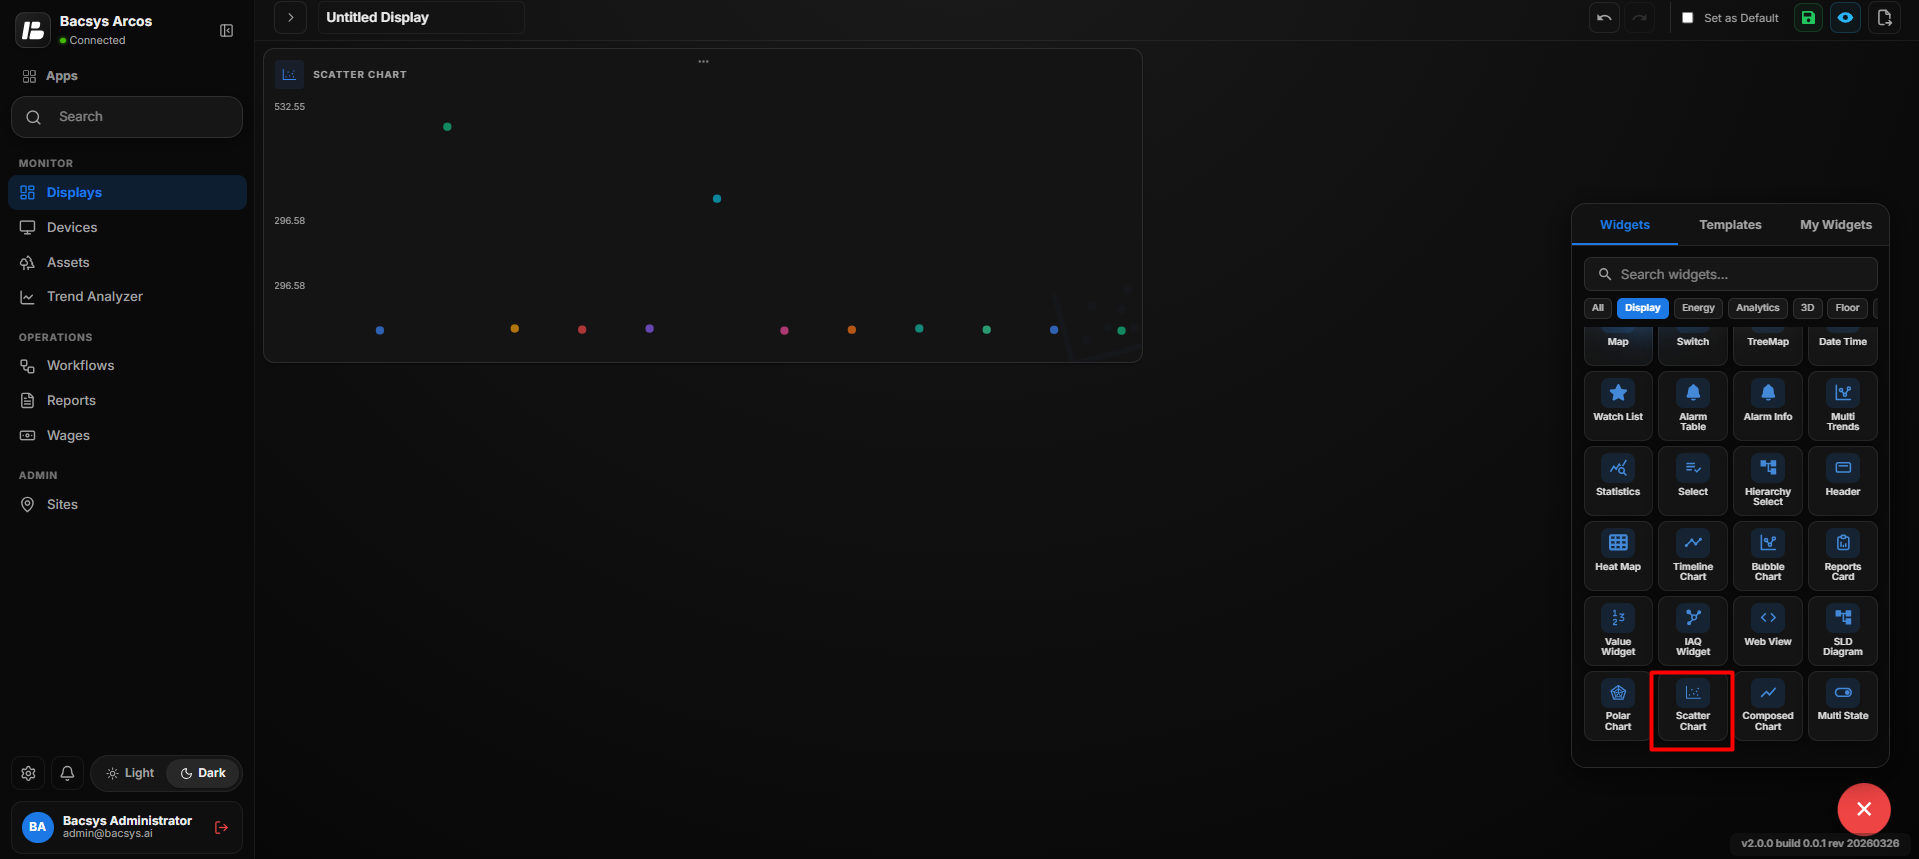
For Trend Value
- Enter the required Title.
- Enter an optional Subtitle.
- Select Trend Value under Select Type.
- Click Browse Hierarchy.
- Select the required trend-enabled points.
- Select the required Date Range.
- Set the Poll Frequency (Seconds).
- Configure Show Background according to your requirement.
- Configure Hide Header according to your requirement.
- Review the configuration.
- Click Save.
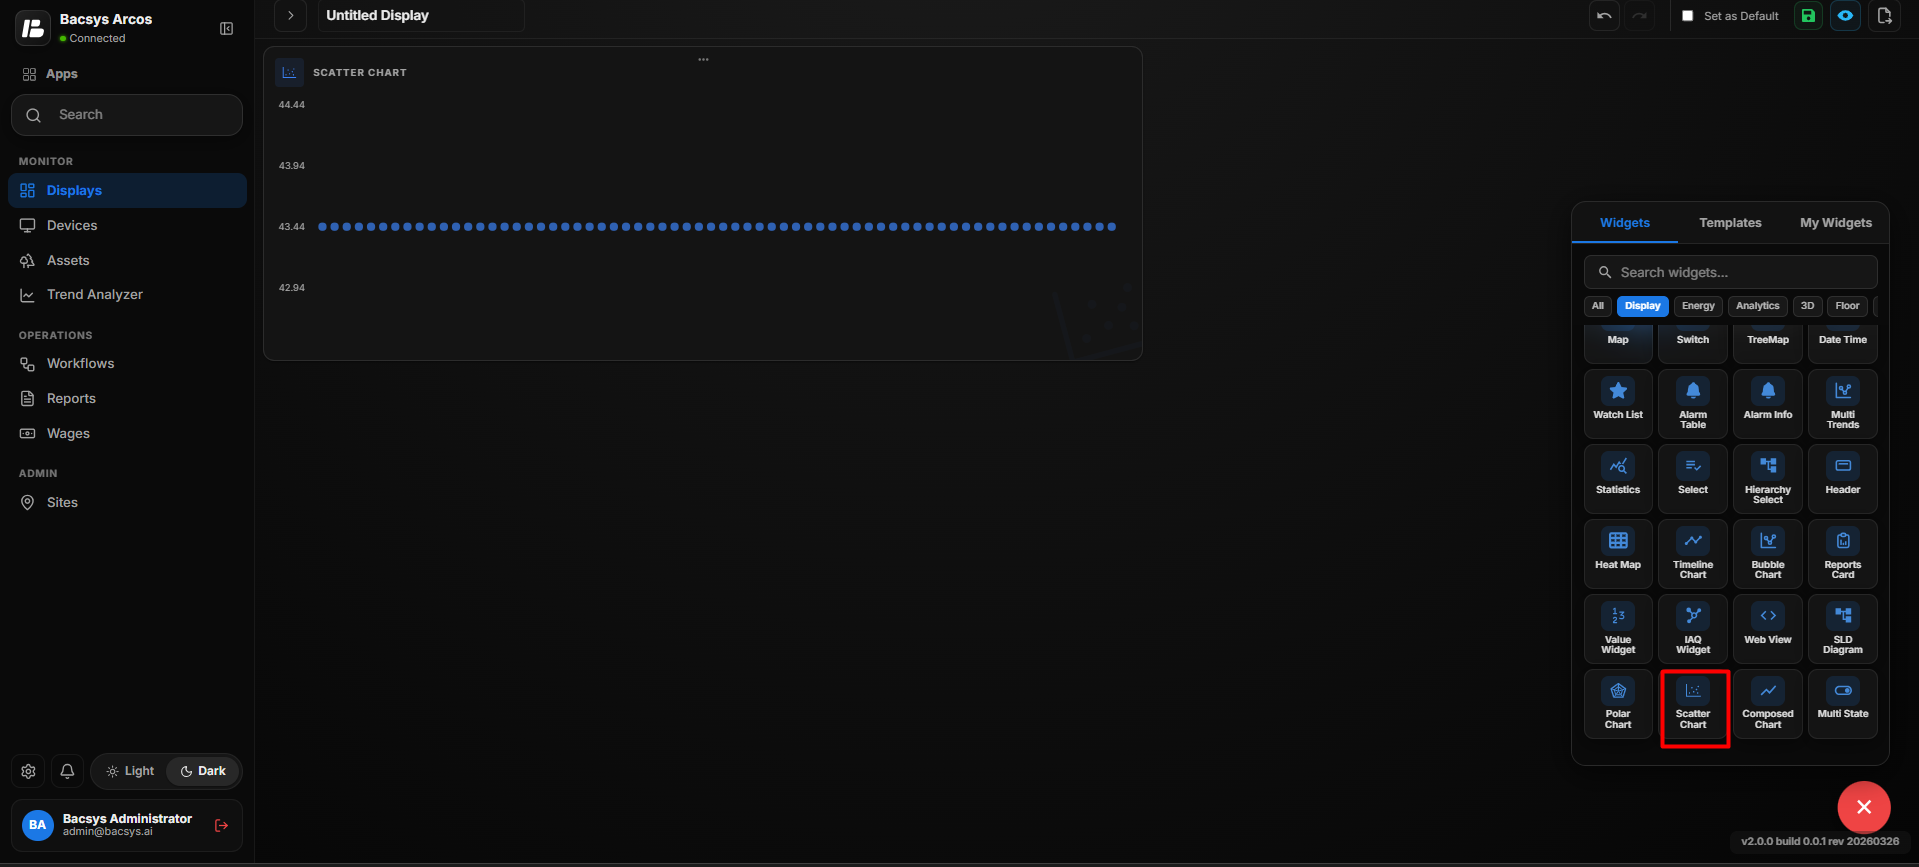
Save the Configuration
After clicking Save, the Scatter Chart is updated on the display using the selected data type, points, and configuration settings.
Add and Configure the Composed Widget
The Composed Widget allows users to display multiple selected point values together in a single widget. It provides options to configure the widget title, subtitle, selected points, refresh frequency, and appearance.
Add the Composed Widget
- Click the + icon.
- Drag and drop the Composed Widget onto the display.
- Select the Composed Widget to view the available widget actions:
- Zoom In
- Zoom Out
- Settings
- Remove Widget
- Click Settings to open the Configure Data panel.
- Configure the required options.
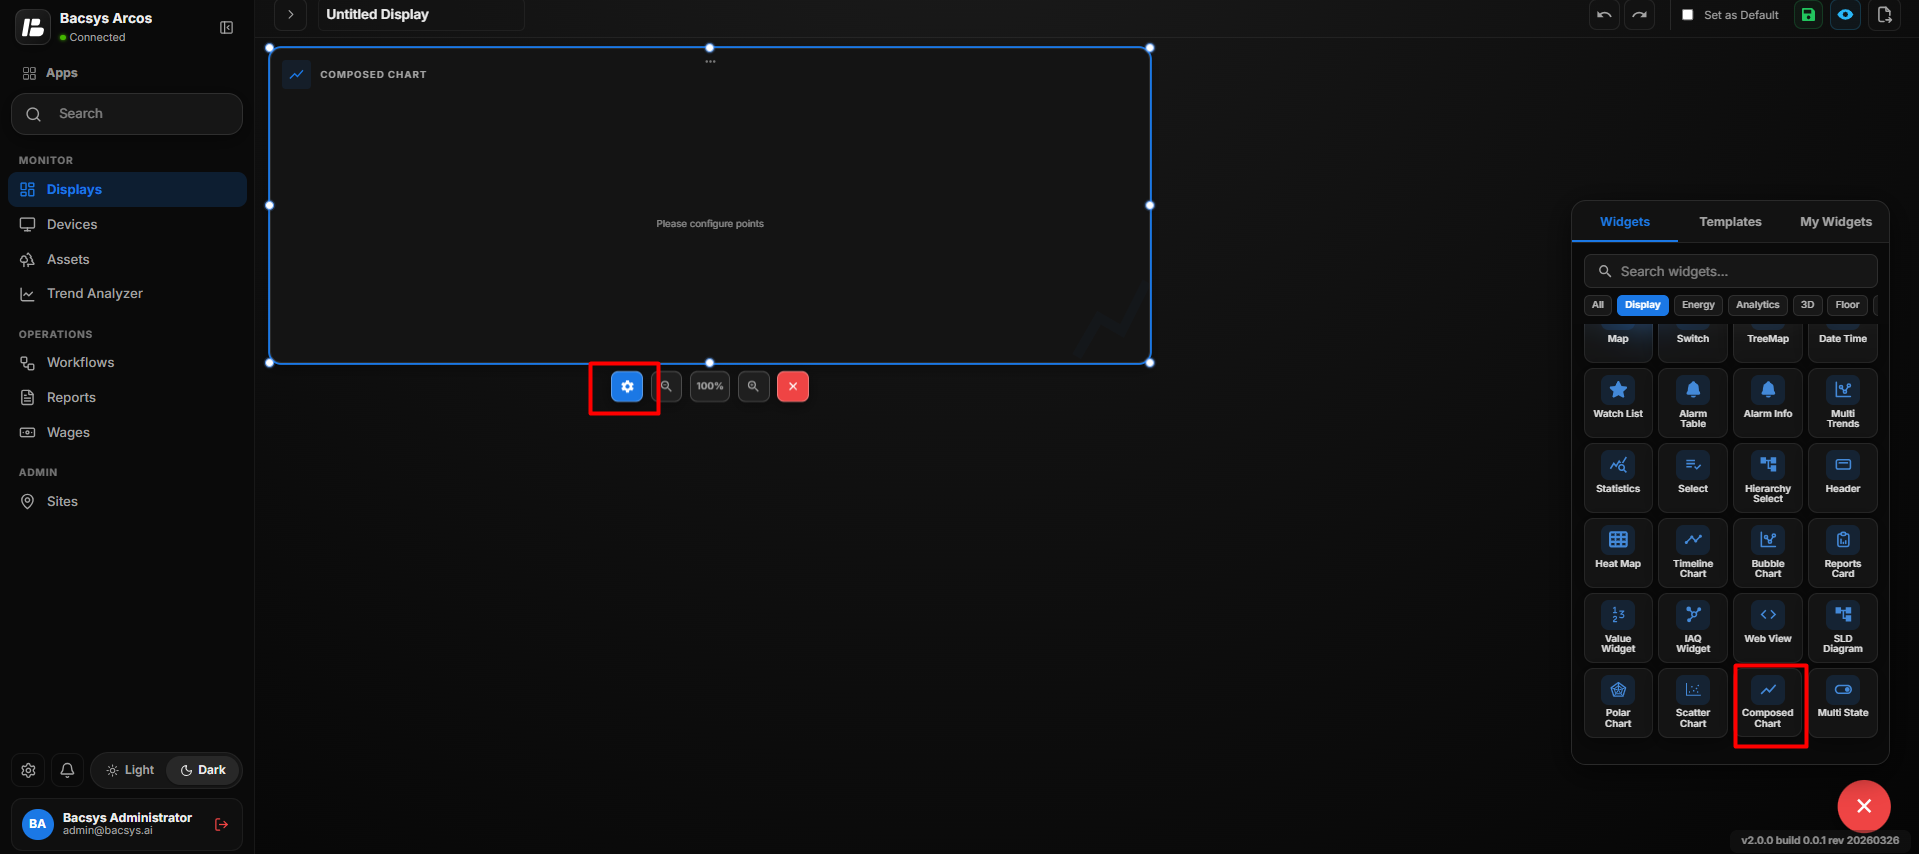
Composed Widget Settings
| Option | Description |
|---|---|
| Title | Enter a title for the Composed Widget. The title is displayed at the top of the widget. |
| Subtitle | Enter an optional subtitle to provide additional information about the displayed data. |
| Select Type | Select the data type to be displayed. Instantaneous Value is used to display the current values of the selected points. |
| Select Points | Select the required points that should be displayed in the Composed Widget. Click Browse Hierarchy to select points from Network → Device → Point. Multiple points can be selected. |
| Poll Frequency (Seconds) | Specify how frequently the selected point values are retrieved or refreshed. |
| Show Background | Use the toggle button to show or hide the widget background. |
| Hide Header | Use the toggle button to show or hide the widget header, including the title and subtitle. |
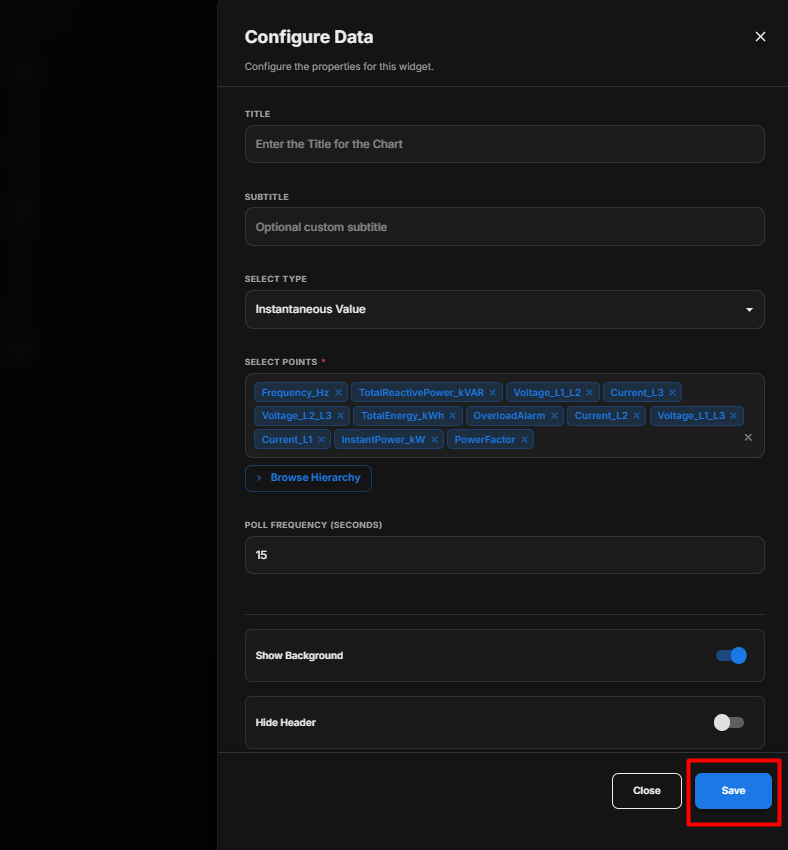
Select Points
- Click Browse Hierarchy.
- Navigate through Network → Device → Point.
- Select the required points.
- The selected points are displayed in the Select Points field.
- Multiple points can be selected and displayed together in the Composed Widget.
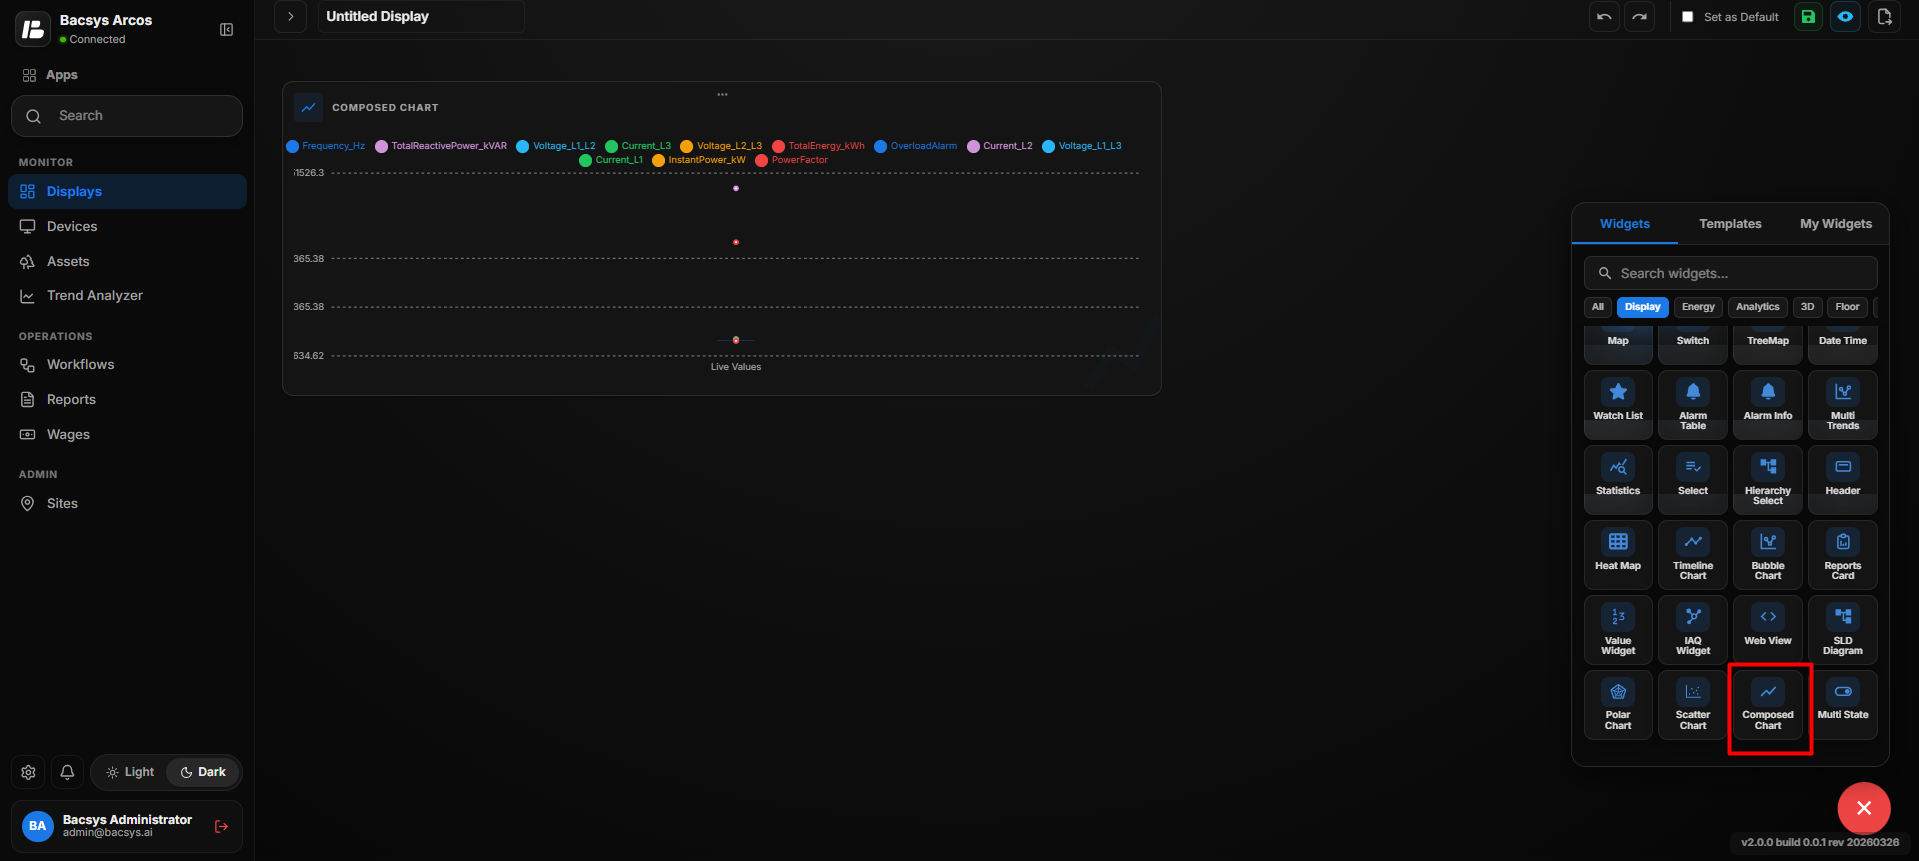
Configure the Composed Widget
- Enter the required Title.
- Enter an optional Subtitle.
- Under Select Type, select Instantaneous Value.
- Click Browse Hierarchy and select the required points.
- Set the required Poll Frequency (Seconds).
- Configure Show Background according to your requirement.
- Enable Hide Header if the widget header should not be displayed.
- Review all the configured settings.
- Click Save.
Save the Configuration
After clicking Save, the Composed Widget is updated on the display with the selected points and configured settings.
The widget allows multiple point values to be viewed together in one place for quick monitoring and comparison.
Add and Configure the Multi-State Widget
The Multi-State Widget is used to display the status of a selected point using multiple configurable states. Each state can have its own value, label, active color, and inactive color, allowing users to visually identify the current state of the point.
Add the Multi-State Widget
- Click the + icon.
- Drag and drop the Multi-State Widget onto the display.
- Select the Multi-State Widget.
- Click Settings to open the Configure Data panel.
- Configure the required settings.
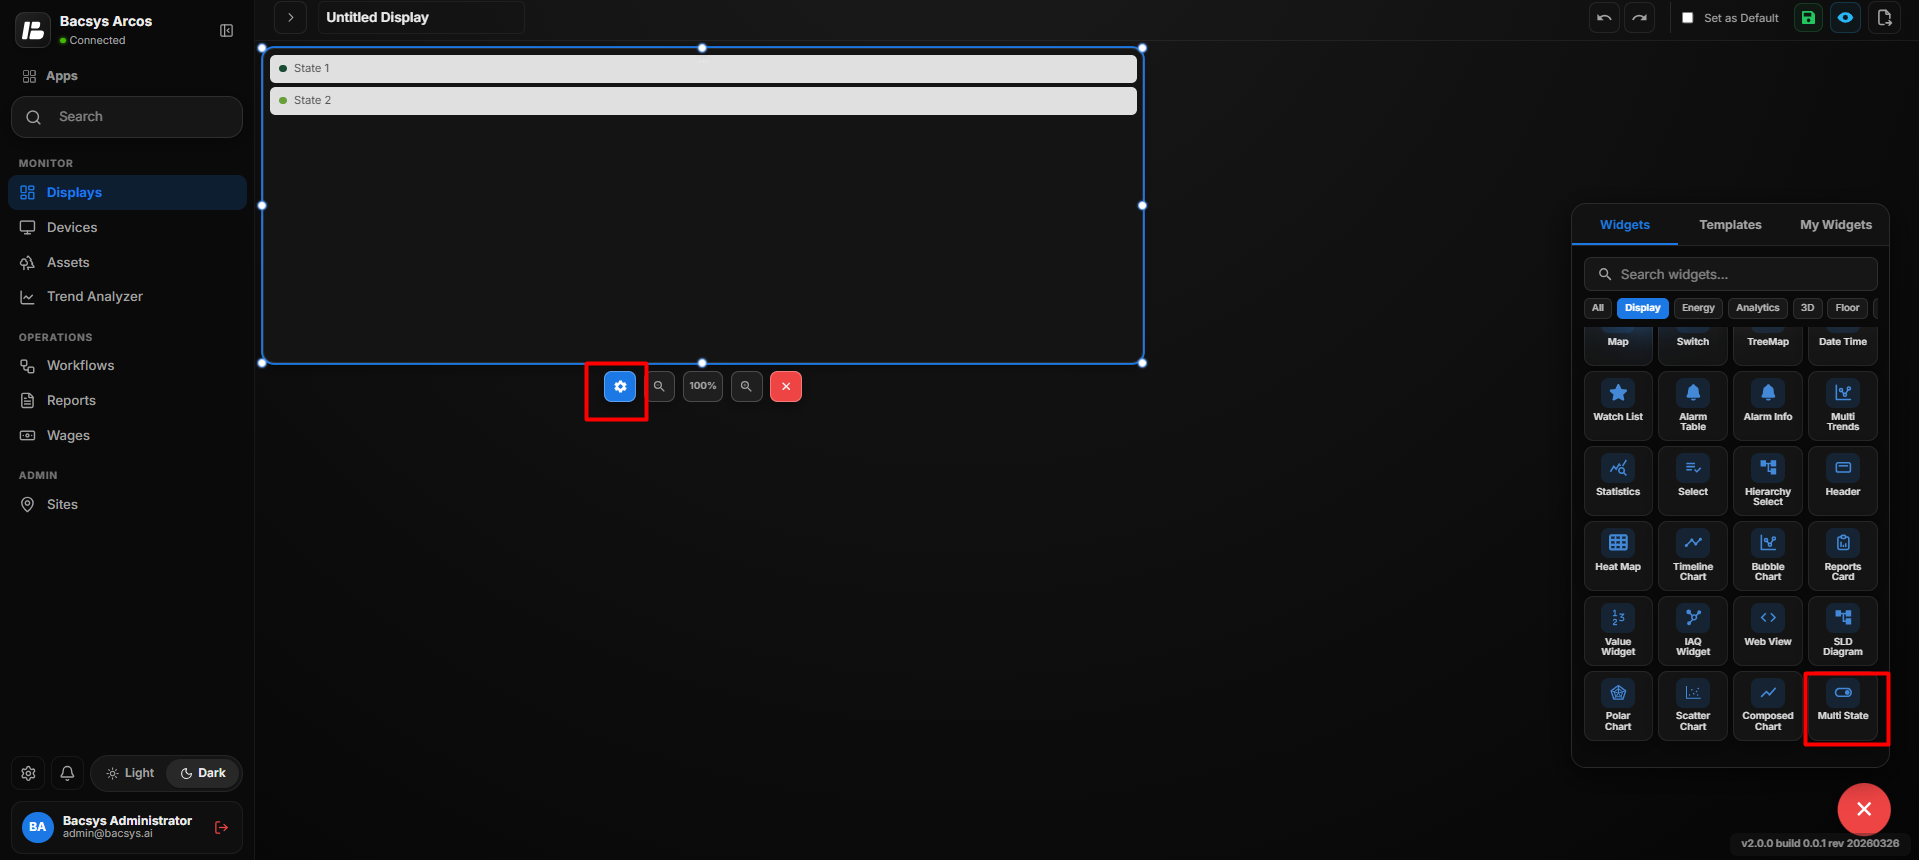
Multi-State Widget Settings
| Option | Description |
|---|---|
| Title | Enter a title for the Multi-State Widget. |
| Select Point | Select the point that provides the value used to determine the current state. Click Browse Hierarchy to select the required point. |
| Number of States | Specify the number of states required for the widget. Use the Add option to create additional states. |
| State Value | Enter the value that represents the state. When the selected point matches this value, the corresponding state becomes active. |
| State Label | Enter the label that should be displayed for the state. |
| Active Color | Select the color displayed when the state is active. |
| Inactive Color | Select the color displayed when the state is inactive. |
| Show Background | Use the toggle button to show or hide the widget background. |
| Hide Header | Use the toggle button to show or hide the widget header. |
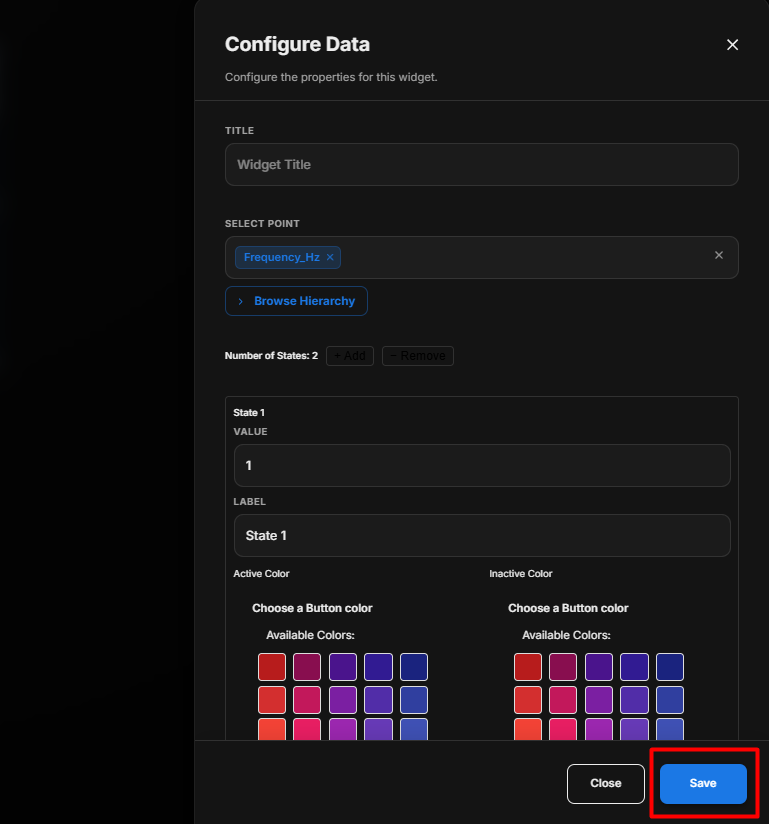
Configure the Number of States
The Number of States option determines how many different states can be configured for the selected point.
For example, if 2 states are configured:
- State 1
- Value:
1 - Label:
State 1
- Value:
- State 2
- Value:
2 - Label:
State 2
- Value:
Additional states can be added when required.
Configure Each State
Each state has its own configuration section.
| Setting | Description |
|---|---|
| Value | Enter the point value that represents the state. |
| Label | Enter the name or description that should be displayed for the state. |
| Active Color | Select the color used when the point is currently in this state. |
| Inactive Color | Select the color used when the point is not in this state. |
Configure the Multi-State Widget
- Enter the required Title.
- Click Browse Hierarchy under Select Point.
- Navigate through Network → Device → Point.
- Select the required point.
- Set the required Number of States.
- Configure the Value for each state.
- Enter a Label for each state.
- Select an Active Color for each state.
- Select an Inactive Color for each state.
- Add additional states if required.
- Configure Show Background according to your requirement.
- Configure Hide Header according to your requirement.
- Review all the configured states.
- Click Save.
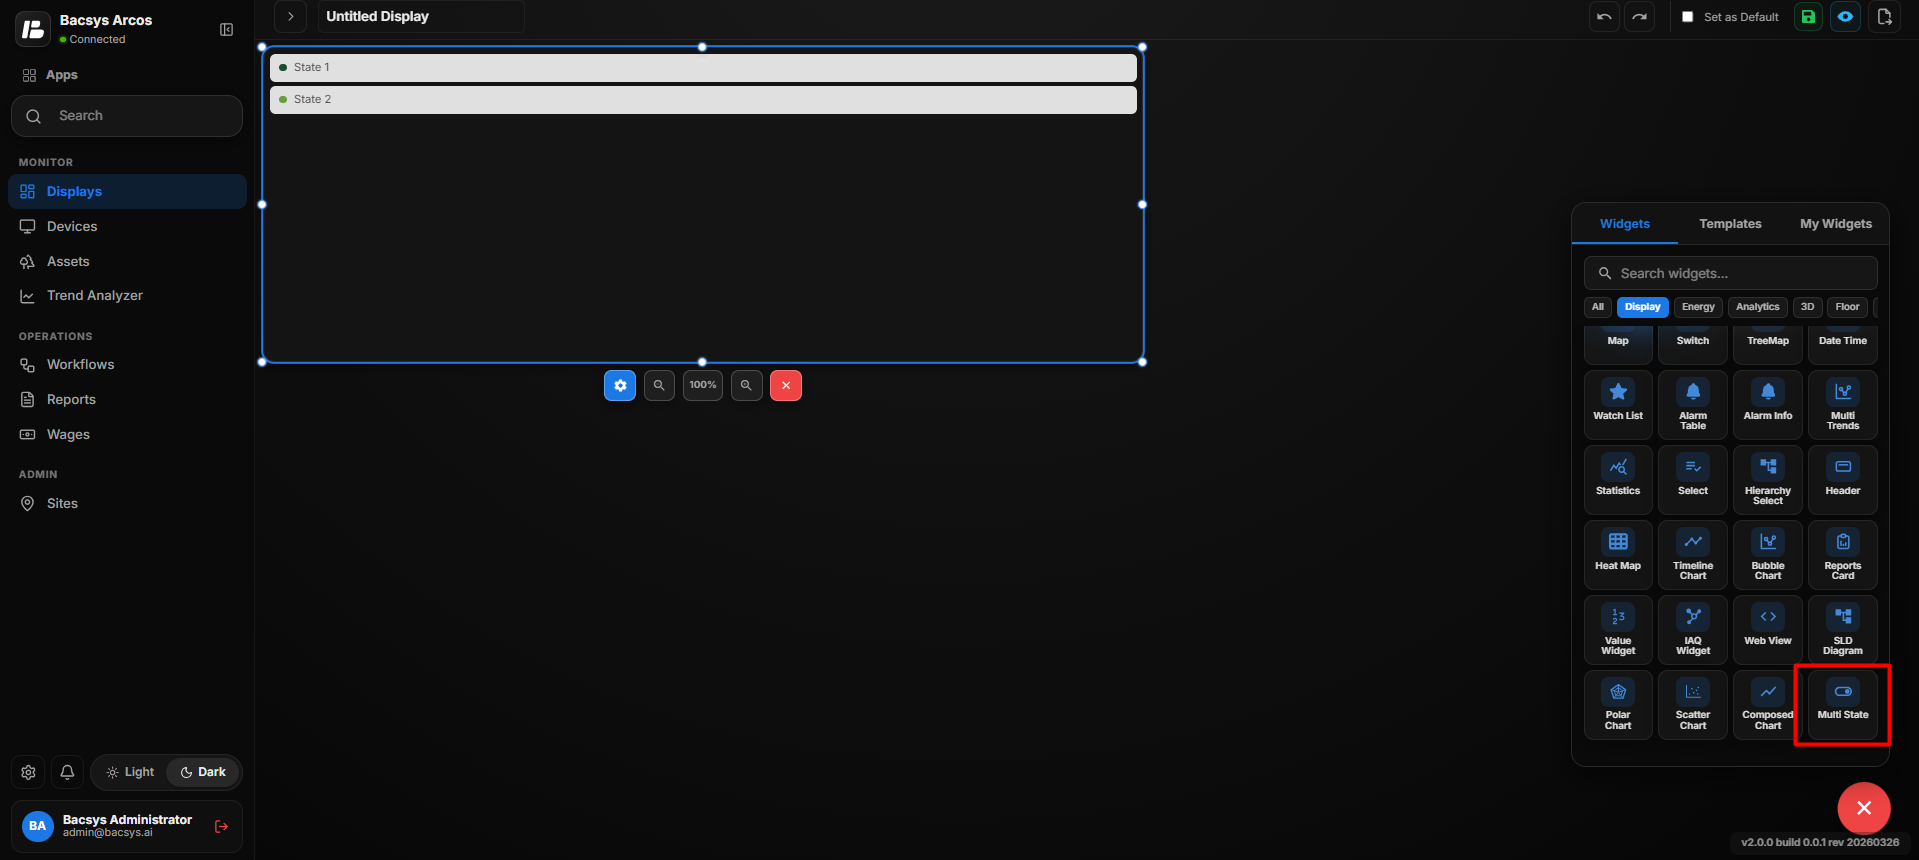
State Behavior
The Multi-State Widget compares the current value of the selected point with the configured state values.
For example:
| Point Value | Active State | Widget Display |
|---|---|---|
1 | State 1 | State 1 is displayed using its Active Color. |
2 | State 2 | State 2 is displayed using its Active Color. |
| Other value | No matching state | The configured states remain inactive. |
Save the Configuration
After clicking Save, the Multi-State Widget is updated on the display.
The widget changes its active state based on the current value of the selected point, making it easy to identify the equipment or system status visually.
Energy Meter Widgets
This section covers the widgets available for Energy Meter monitoring and visualization.
Add and Configure the Meter Table Widget
The Meter Table Widget is used to display meter-related information in a tabular format. It allows users to select devices and configure the number of parameters to be displayed in the table.
Energy
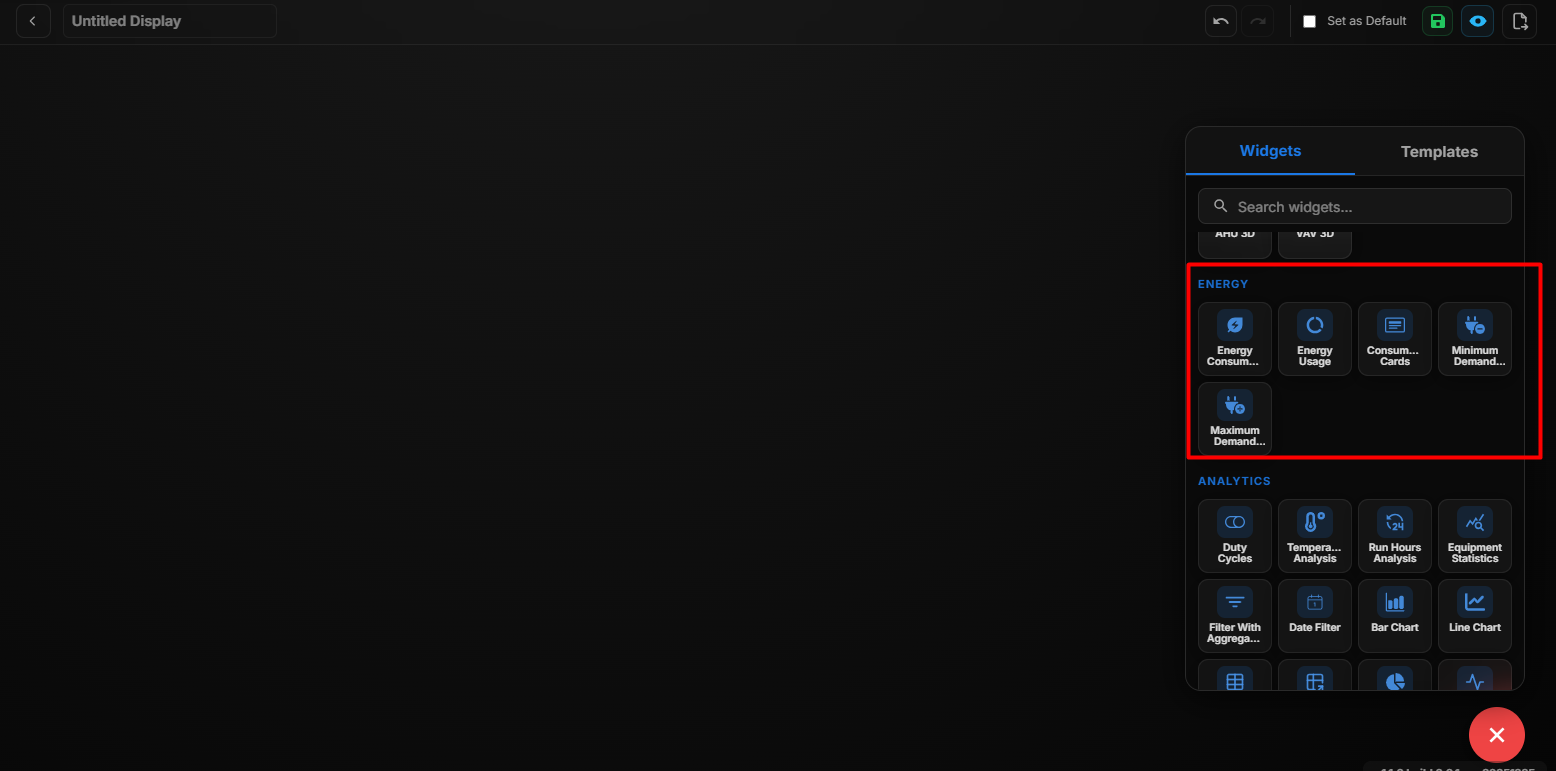 Energy
| Metric | Description |
|---|---|
| Energy Consumption | Displays the total amount of energy consumed over a selected time period (e.g., daily, monthly, yearly). |
| Energy Usage | Shows real-time or historical energy usage data for selected equipment, systems, or sites. |
| Consumption Cards | Provides a summarized card-based view of energy consumption metrics for quick monitoring and comparison. |
| Minimum Demand | Displays the lowest recorded energy demand within the selected time period. |
| Maximum Demand | Displays the highest recorded energy demand within the selected time period. |
| CMMS Table | Displays maintenance-related information in a tabular format, providing a centralized view of equipment maintenance and related CMMS data. |
Add the Meter Table Widget
- Click the + icon.
- Drag and drop the Meter Table Widget onto the display.
- Select the Meter Table Widget to view the available widget actions:
- Zoom In
- Zoom Out
- Settings
- Remove Widget
- Use Zoom In and Zoom Out to adjust the widget view as required.
- Click Settings to open the Configure Data panel.
- Configure the required meter table settings.
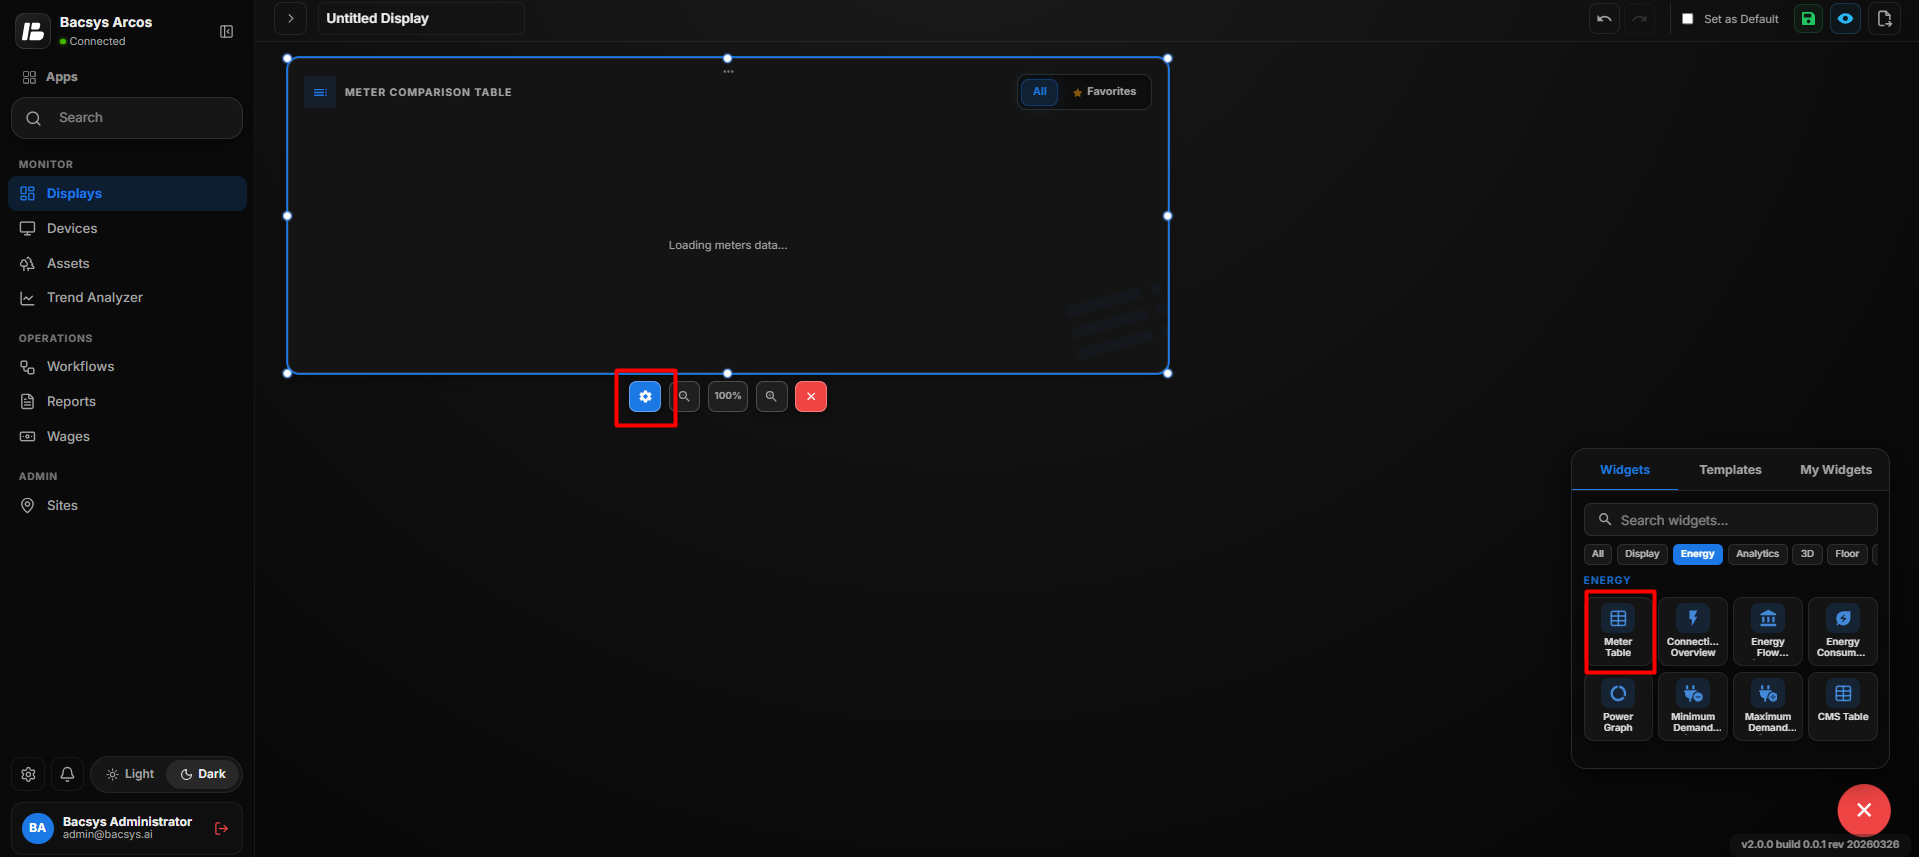
Meter Table Widget Settings
| Option | Description |
|---|---|
| Title | Enter a title for the Meter Table Widget. |
| Subtitle | Enter an optional subtitle to provide additional information about the table. |
| Select Devices | Select the devices whose meter information should be displayed in the table. |
| No. of Parameters | Specify the number of parameters to be displayed for the selected devices. |
| Bold Text | Enable the toggle to display the table text in bold. |
| Font Size | Specify the font size used for the table content. |
| Enable Write Value | Enable the toggle to allow values to be written or modified from the table, where supported. |
| Show Background | Use the toggle button to show or hide the widget background. |
| Hide Header | Use the toggle button to show or hide the widget header. |
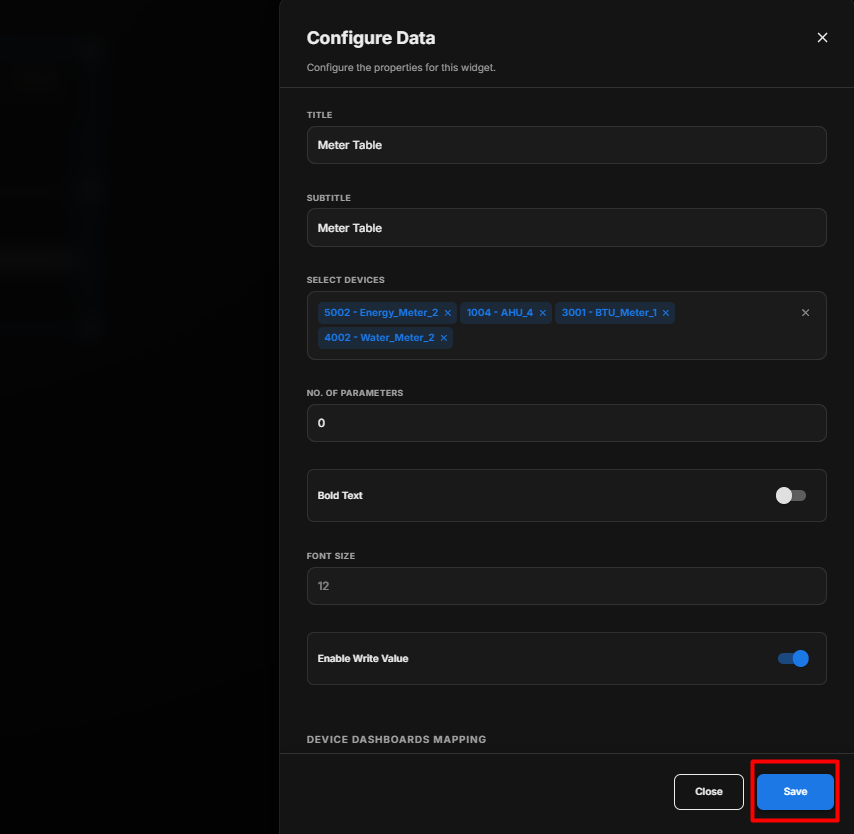
Configure the Meter Table Widget
- Enter the required Title.
- Enter an optional Subtitle.
- Under Select Devices, select the required devices.
- Specify the No. of Parameters to be displayed.
- Enable Bold Text if required.
- Set the required Font Size.
- Enable Enable Write Value if users need to write values from the table.
- Configure Show Background according to your requirement.
- Configure Hide Header according to your requirement.
- Review the configured settings.
- Click Save.
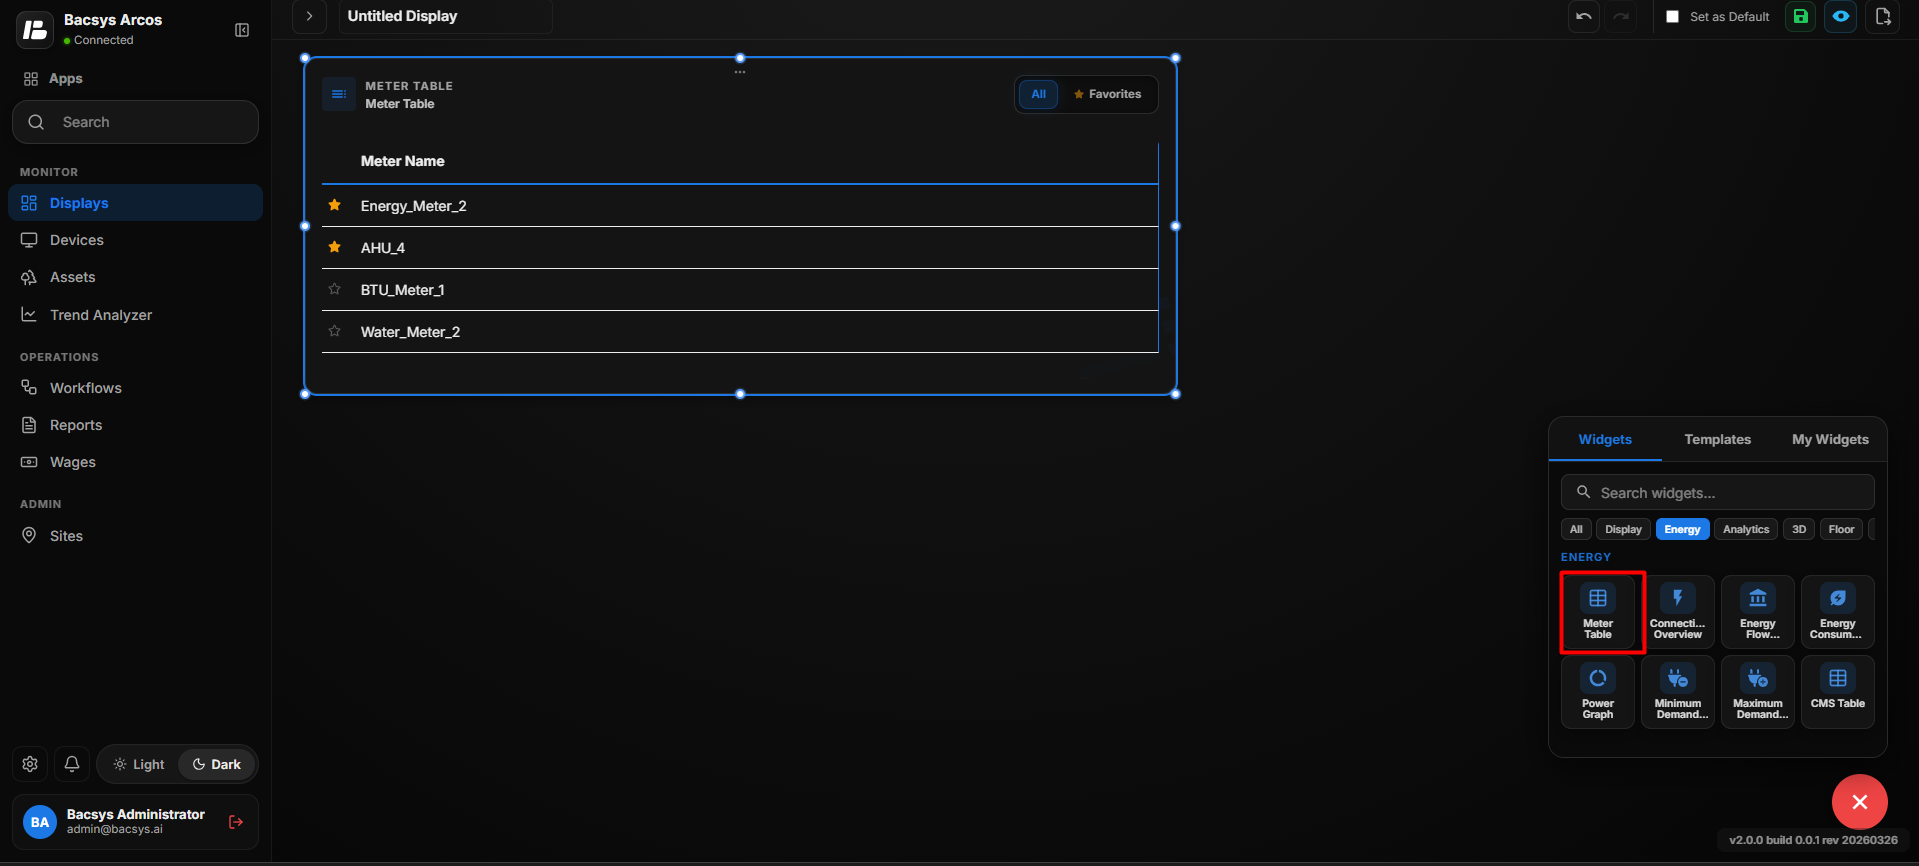
Meter Table Display
After saving the configuration, the selected devices and their configured meter parameters are displayed in a table.
Save the Configuration
Click Save to apply the configured settings to the Meter Table Widget and display the selected meter information on the dashboard.
Add and Configure the Connectivity Overview Widget
The Connectivity Overview Widget displays the connectivity status of devices in the system. It provides an overview of how many devices are connected and how many are disconnected.
Add the Connectivity Overview Widget
- Click the + icon.
- Drag and drop the Connectivity Overview Widget onto the display.
- Select the Connectivity Overview Widget to view the available widget actions:
- Zoom In
- Zoom Out
- Settings
- Remove Widget
- Use Zoom In and Zoom Out to adjust the widget view as required.
- Click Settings to open the Configure Data panel.
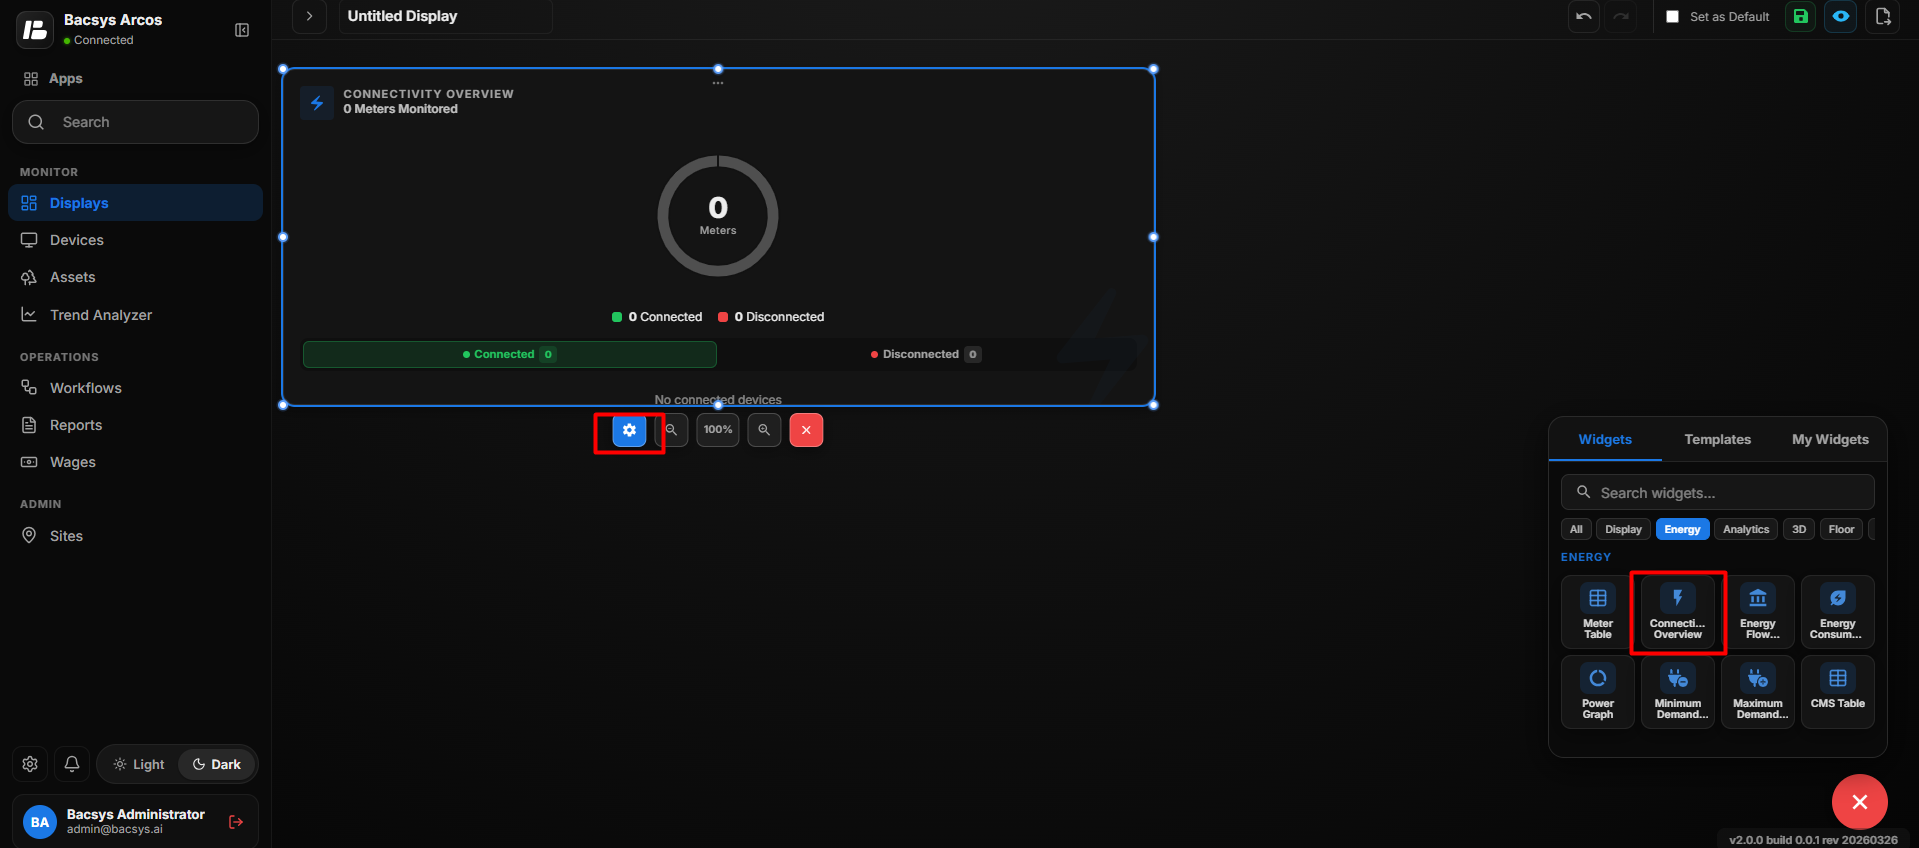
Connectivity Overview Widget Settings
| Option | Description |
|---|---|
| Widget Title | Enter the title to be displayed for the connectivity overview. |
| Subtitle | Enter a subtitle for the widget. |
| Consumption Section Title | Enter the title for the consumption or summary section displayed in the widget. |
| Consumption Unit | Specify the unit used for consumption values, such as kWh. |
| Select Devices / Meters | Select the required devices or meters to be included in the widget. |
| Status Point Name | Enter the status point used to determine the connectivity status of the selected devices. |
| Consumption Tags | Select tags to organize consumption data into category rows. |
| Show Background | Use the toggle button to show or hide the widget background. |
| Hide Header | Use the toggle button to show or hide the widget header. |
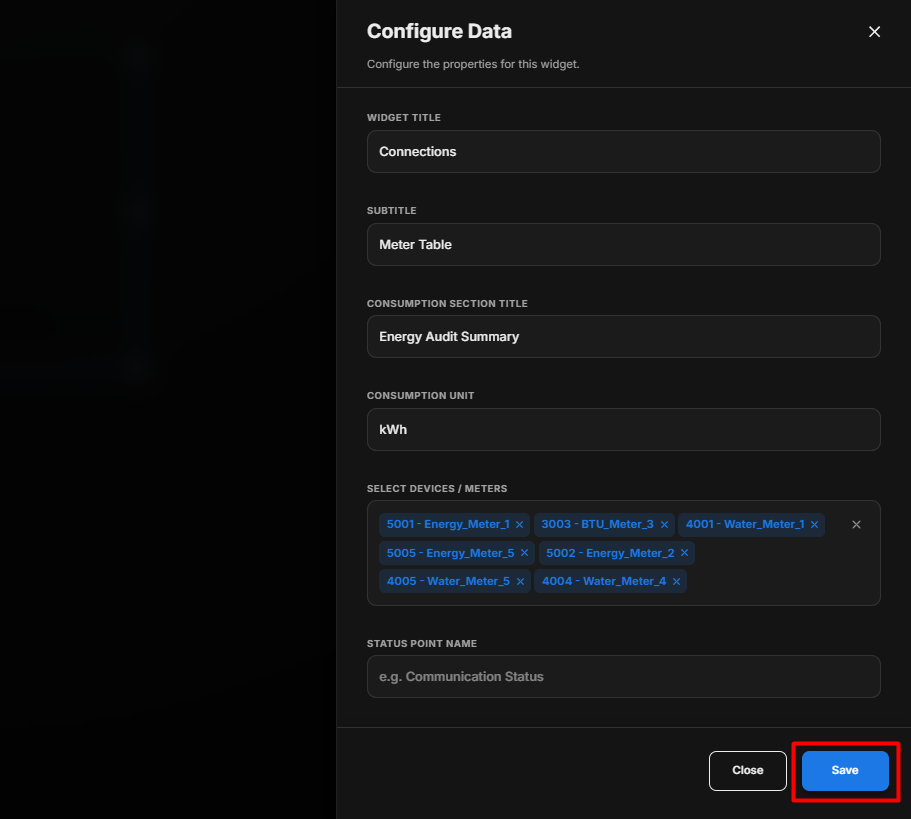
Configure the Connectivity Overview
- Enter the required Widget Title.
- Enter the required Subtitle.
- Enter the Consumption Section Title.
- Specify the Consumption Unit.
- Under Select Devices / Meters, select the required devices or meters.
- Enter the Status Point Name used to identify the device connectivity status.
- Select the required Consumption Tags, if applicable.
- Configure Show Background according to your requirement.
- Configure Hide Header according to your requirement.
- Review the configured settings.
- Click Save.
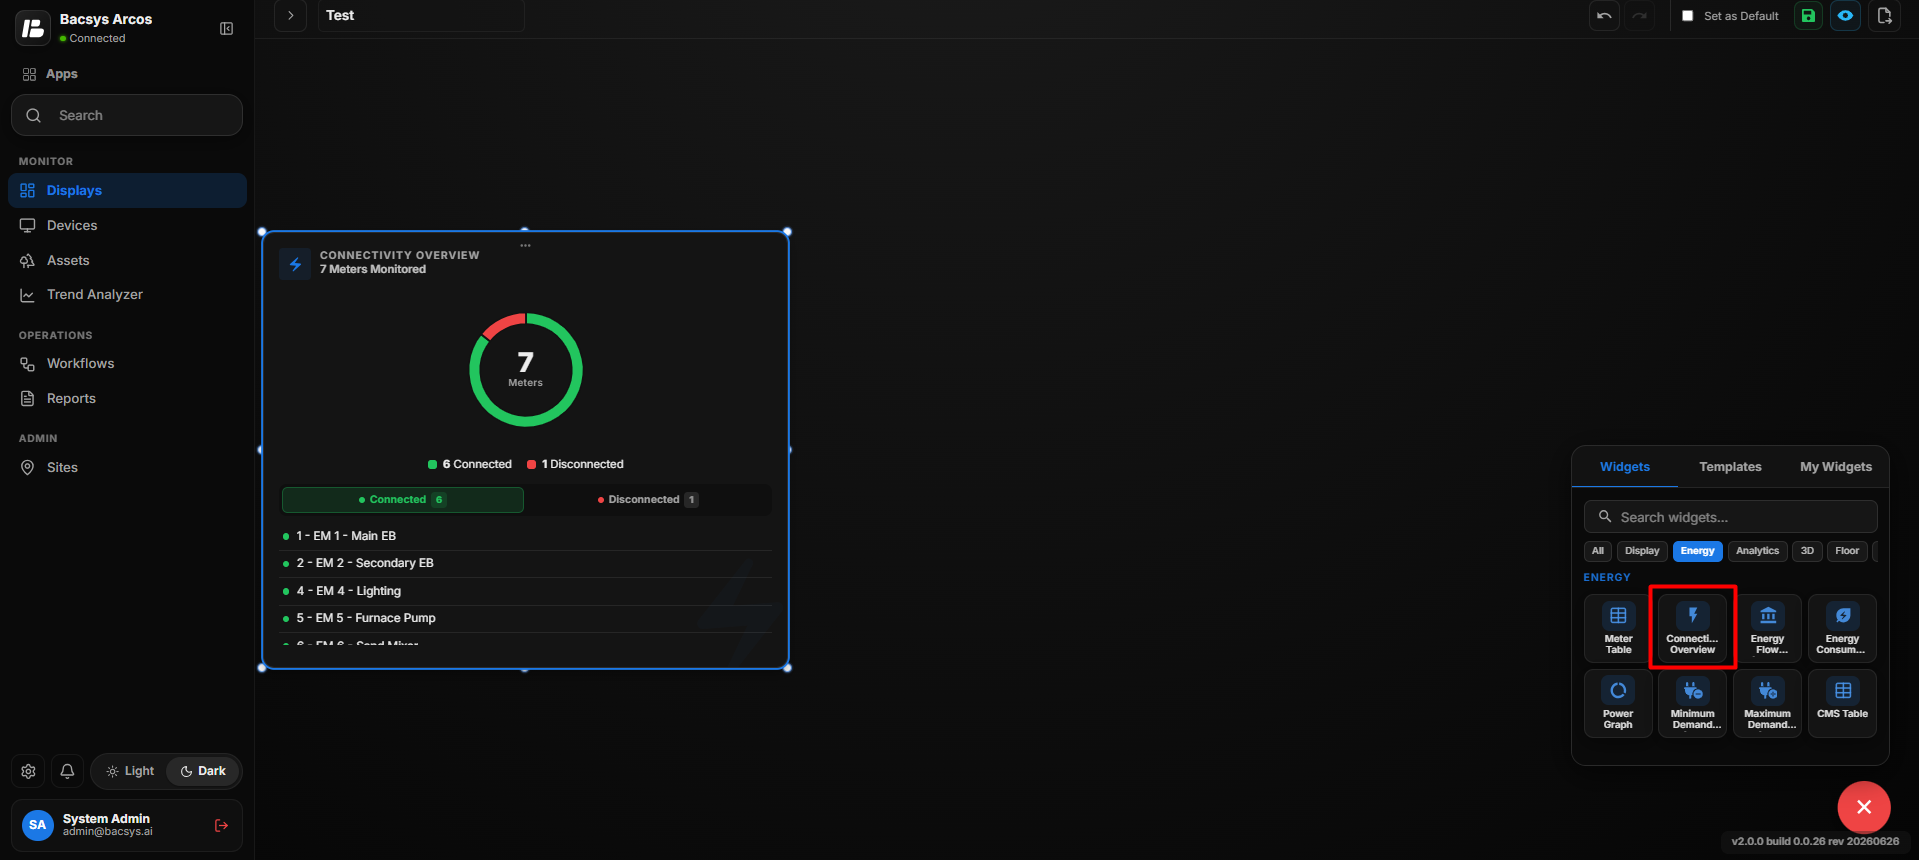
Connectivity Status
The widget uses the configured status information to provide an overview of device connectivity.
| Status | Description |
|---|---|
| Connected | Indicates the number of devices that are currently connected and communicating with the system. |
| Disconnected | Indicates the number of devices that are currently disconnected or not communicating with the system. |
After saving the configuration, the Connectivity Overview Widget displays the connected and disconnected device counts on the display.
Add and Configure the Energy Flow Widget
The Energy Flow Widget is used to visualize the flow of energy between different sources and loads. Users can configure the widget title, unit, comparison period, incoming energy points, outgoing points, and their colors.
Add the Energy Flow Widget
- Click the + icon.
- Drag and drop the Energy Flow Widget onto the display.
- Select the Energy Flow Widget to view the available widget actions:
- Zoom In
- Zoom Out
- Settings
- Remove Widget
- Use Zoom In and Zoom Out to adjust the widget view as required.
- Click Settings to open the Configure Data panel.
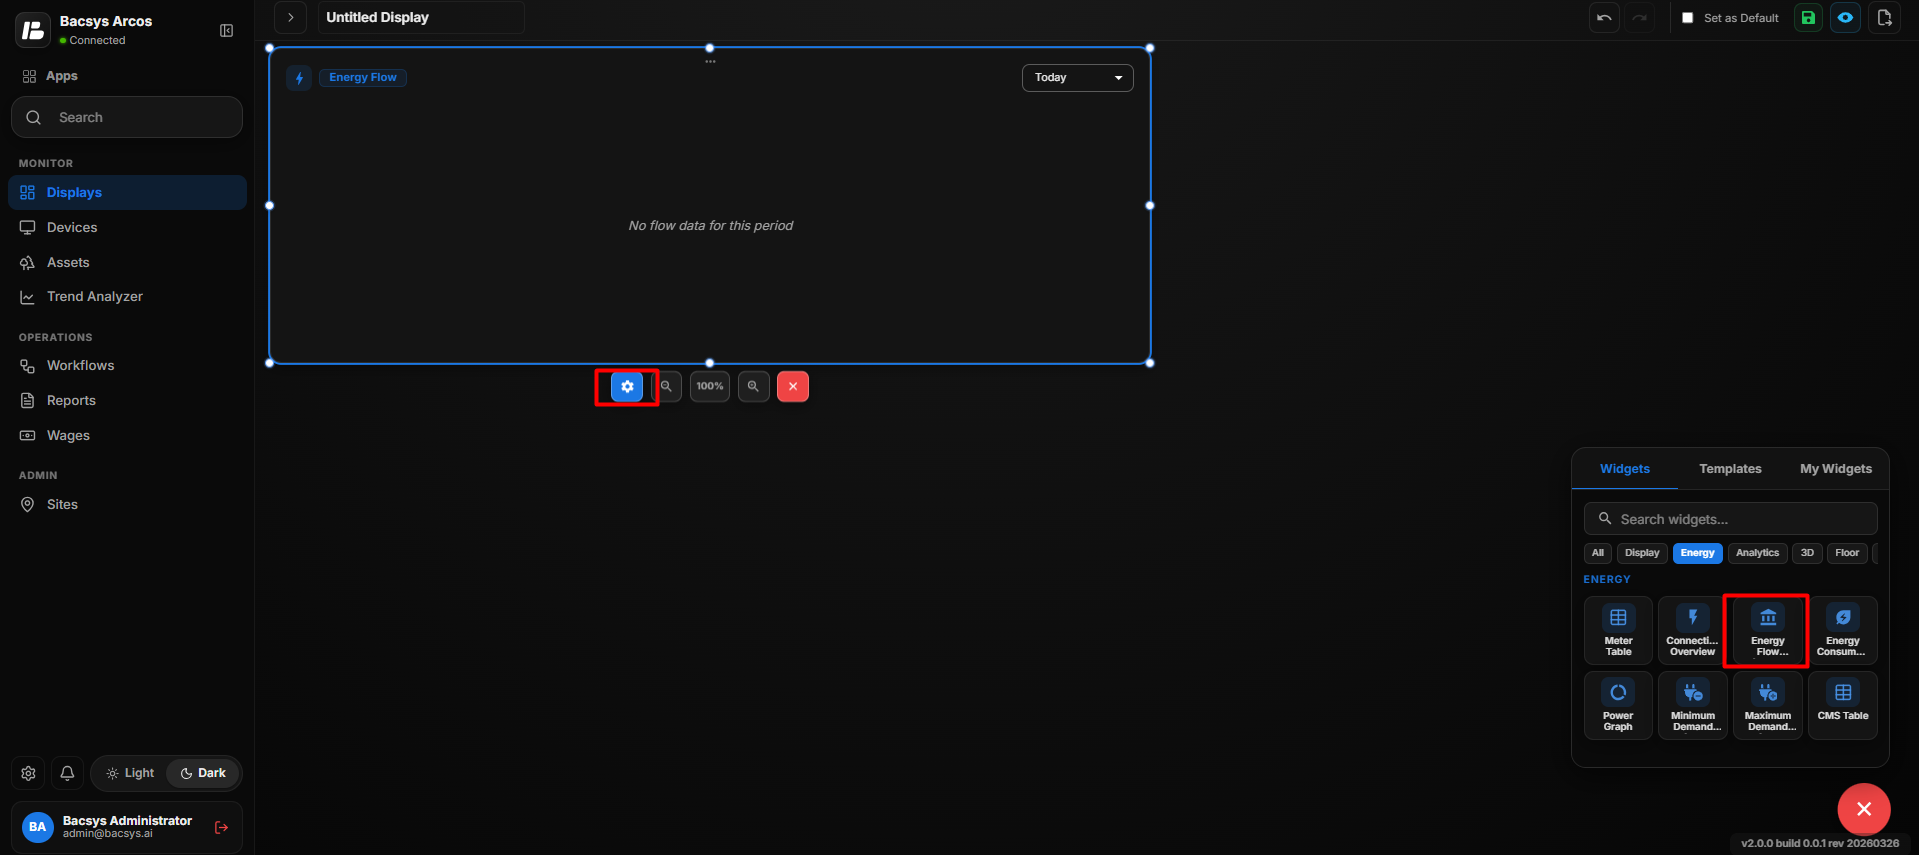
Energy Flow Widget Settings
| Option | Description |
|---|---|
| Title | Enter the title to be displayed for the Energy Flow Widget. |
| Unit | Specify the unit used for energy values, such as kWh. |
| Compare As | Select the time period used to compare energy consumption, such as Day. |
| Incomers | Add and configure the incoming energy sources. |
| Add Incomer | Click Add Incomer to add another incoming energy source. |
| Incomer Label | Enter a label for the incoming energy source. |
| Incomer Color | Select the color used to represent the incoming energy source. |
| Incomer Points | Select the points associated with the incoming energy source using Browse Hierarchy. |
| Outgoings | Add and configure the outgoing energy sources or loads. |
| Add Outgoing Node | Add another outgoing node to the Energy Flow Widget. |
| Outgoing Label | Enter a label for the outgoing energy source or load. |
| Outgoing Color | Select the color used to represent the outgoing energy source or load. |
| Points | Select the points associated with the outgoing node using Browse Hierarchy. |
| Show Background | Use the toggle button to show or hide the widget background. |
| Hide Header | Use the toggle button to show or hide the widget header. |
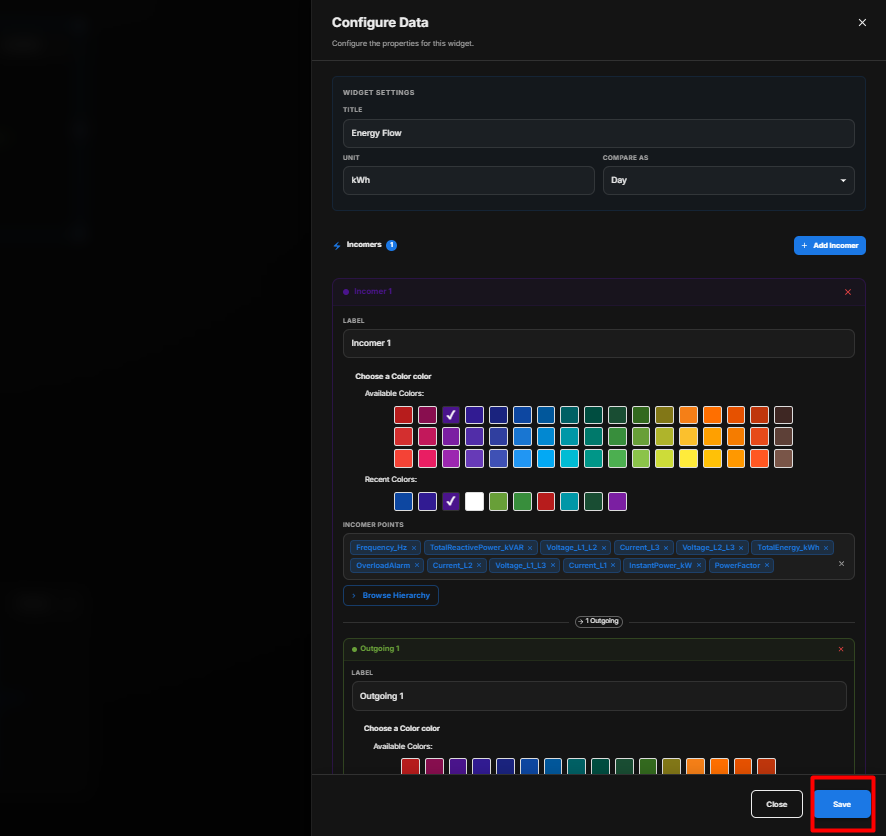
Configure the Energy Flow Widget
- Enter the required Title.
- Specify the Unit for the energy values.
- Select the required Compare As period.
- Under Incomers, configure the incoming energy sources.
- Enter the Incomer Label.
- Select the required Incomer Color.
- Under Incomer Points, click Browse Hierarchy.
- Select the required points associated with the incomer.
- Click Add Incomer if additional incoming energy sources are required.
- Under Outgoings, configure the outgoing energy sources or loads.
- Enter the Outgoing Label.
- Select the required Outgoing Color.
- Under Points, click Browse Hierarchy and select the required points.
- Click Add Outgoing Node if additional outgoing nodes are required.
- Configure Show Background according to your requirement.
- Configure Hide Header according to your requirement.
- Review all configured incomers and outgoings.
- Click Save.
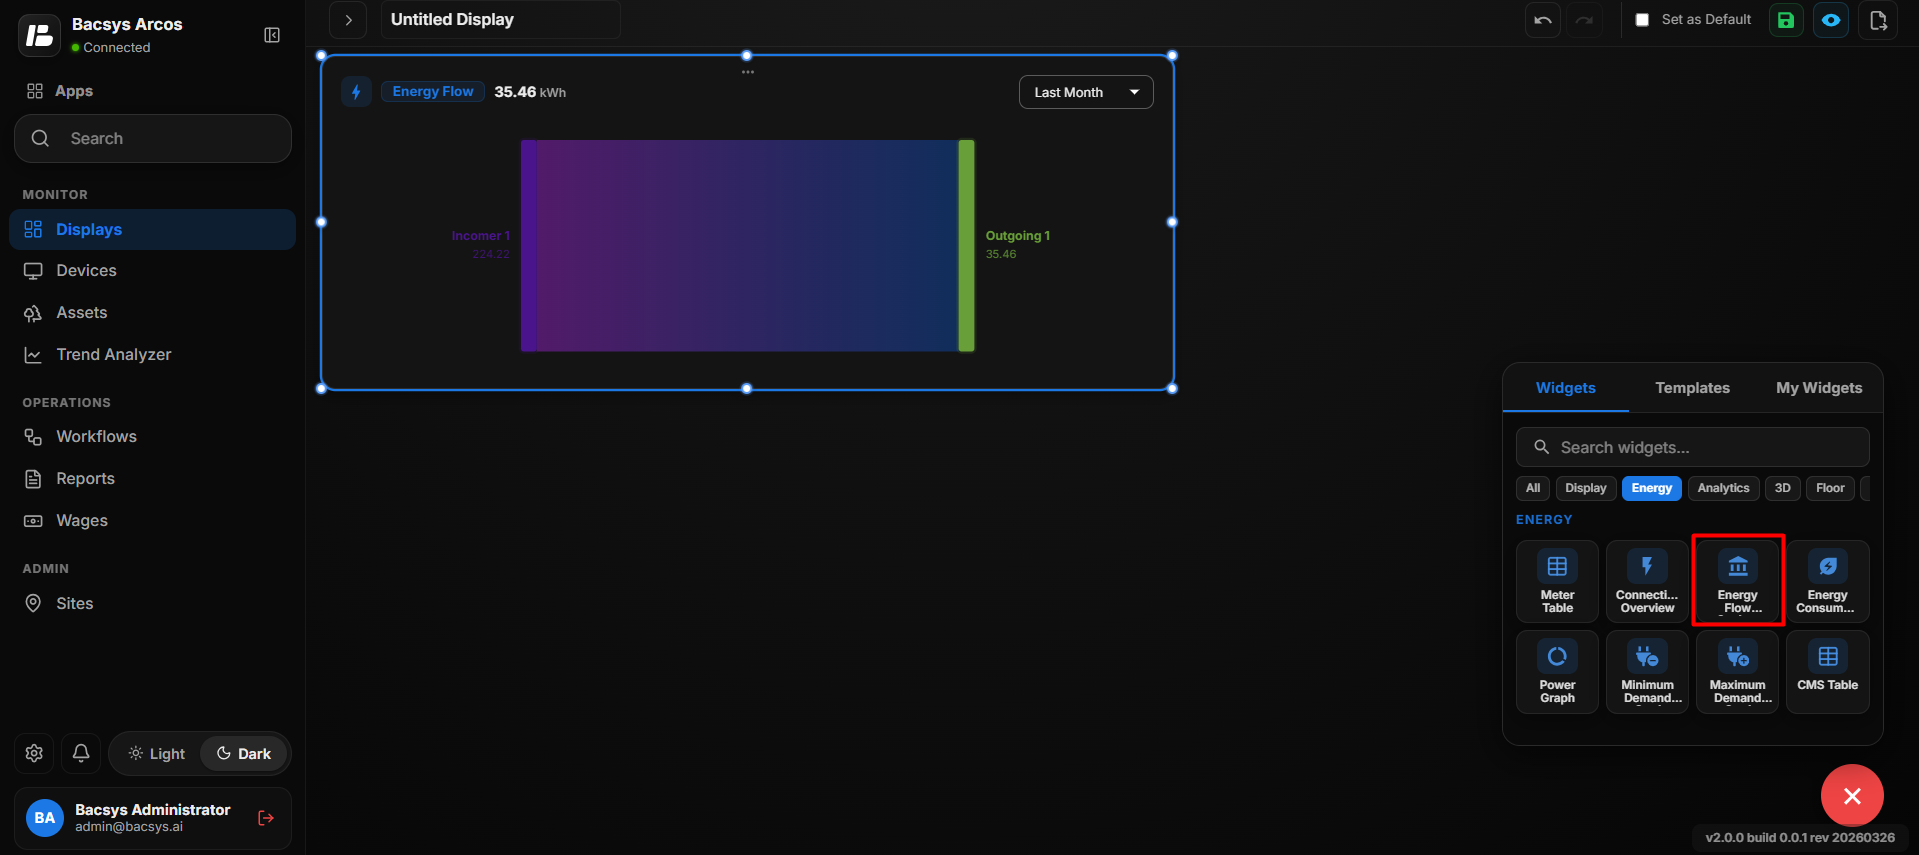
Energy Flow Structure
The Energy Flow Widget represents the relationship between incoming energy sources and outgoing energy loads.
- Incomers represent the sources from which energy enters the system.
- Outgoings represent the destinations or loads where the energy is consumed.
- Each incomer and outgoing can have its own label, color, and associated points.
- Multiple incomers and outgoing nodes can be added to represent a complete energy flow.
Save the Configuration
After clicking Save, the Energy Flow Widget displays the configured energy sources and loads with their associated energy points, labels, colors, units, and comparison period.
Add and Configure the Energy Consumption Widget
The Energy Consumption Widget is used to display energy consumption data for a selected point. Users can configure the widget title, data point, polling frequency, and appearance settings.
Add the Energy Consumption Widget
- Click the + icon.
- Drag and drop the Energy Consumption Widget onto the display.
- Select the Energy Consumption Widget to view the available widget actions:
- Zoom In
- Zoom Out
- Settings
- Remove Widget
- Use Zoom In and Zoom Out to adjust the widget view as required.
- Click Settings to open the Configure Data panel.
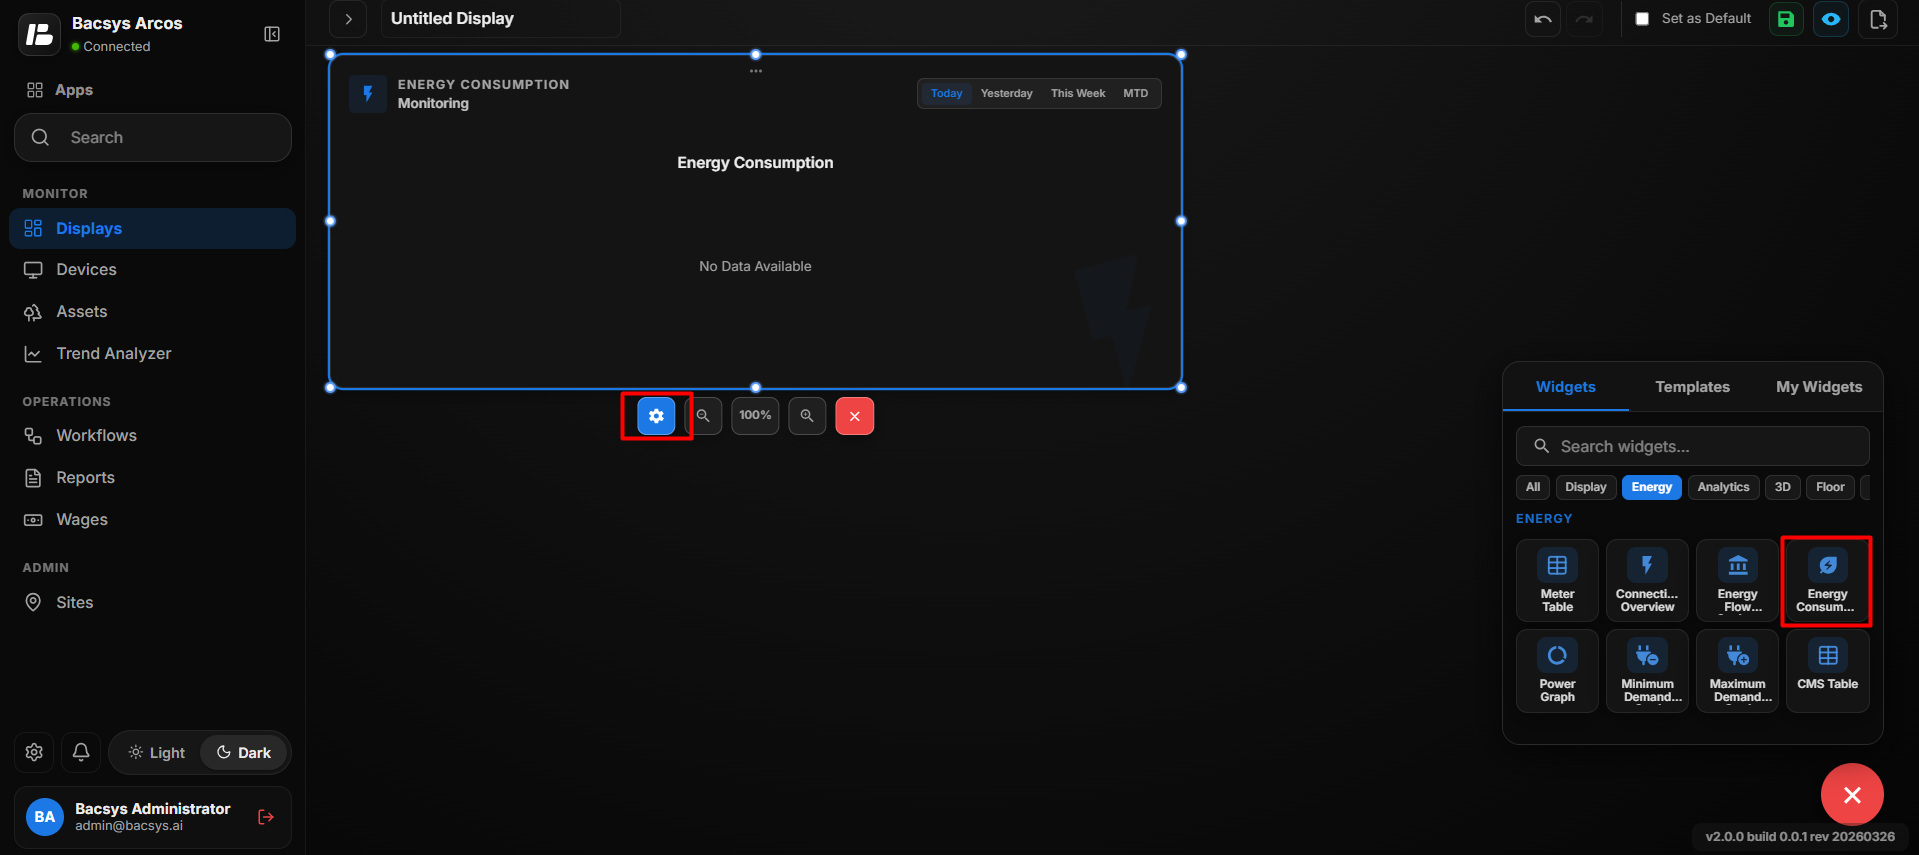
Energy Consumption Widget Settings
| Option | Description |
|---|---|
| Title | Enter the title to be displayed for the Energy Consumption Widget. |
| Select Point | Select the point whose energy consumption data should be displayed. Click Browse Hierarchy to navigate through the network, device, and point hierarchy. |
| Poll Frequency (Seconds) | Specify how frequently the widget should refresh the selected point's energy consumption data. |
| Show Background | Use the toggle button to show or hide the widget background. |
| Hide Header | Use the toggle button to show or hide the widget header. |
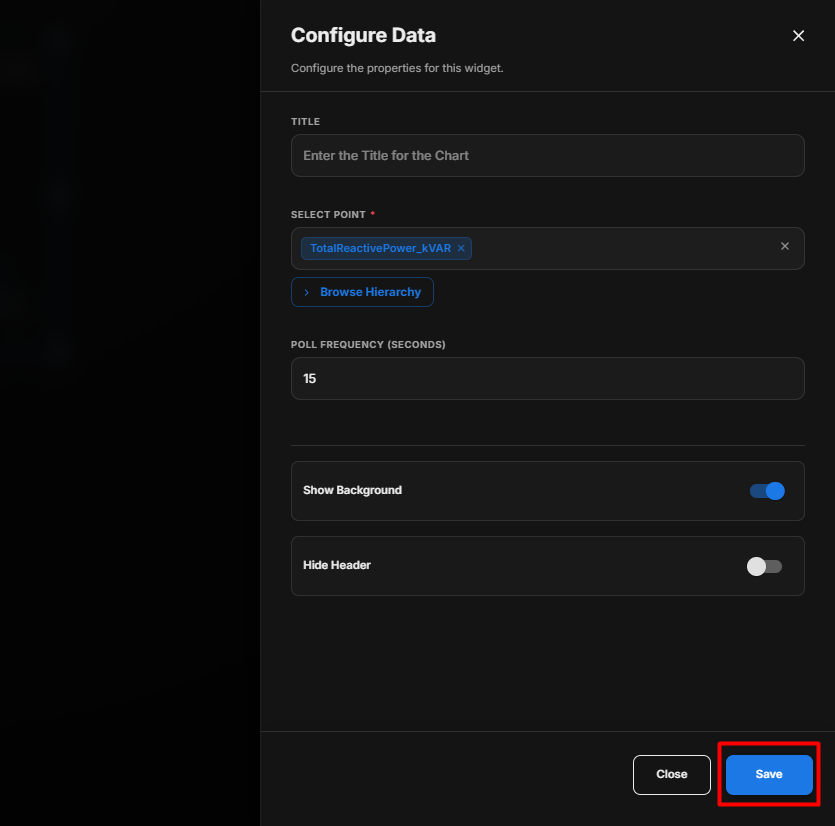
Configure the Energy Consumption Widget
- Enter the required Title.
- Under Select Point, click Browse Hierarchy.
- Navigate through Network → Device → Point.
- Select the required energy consumption point.
- Set the required Poll Frequency (Seconds).
- Configure Show Background according to your requirement.
- Configure Hide Header according to your requirement.
- Review the configured settings.
- Click Save.
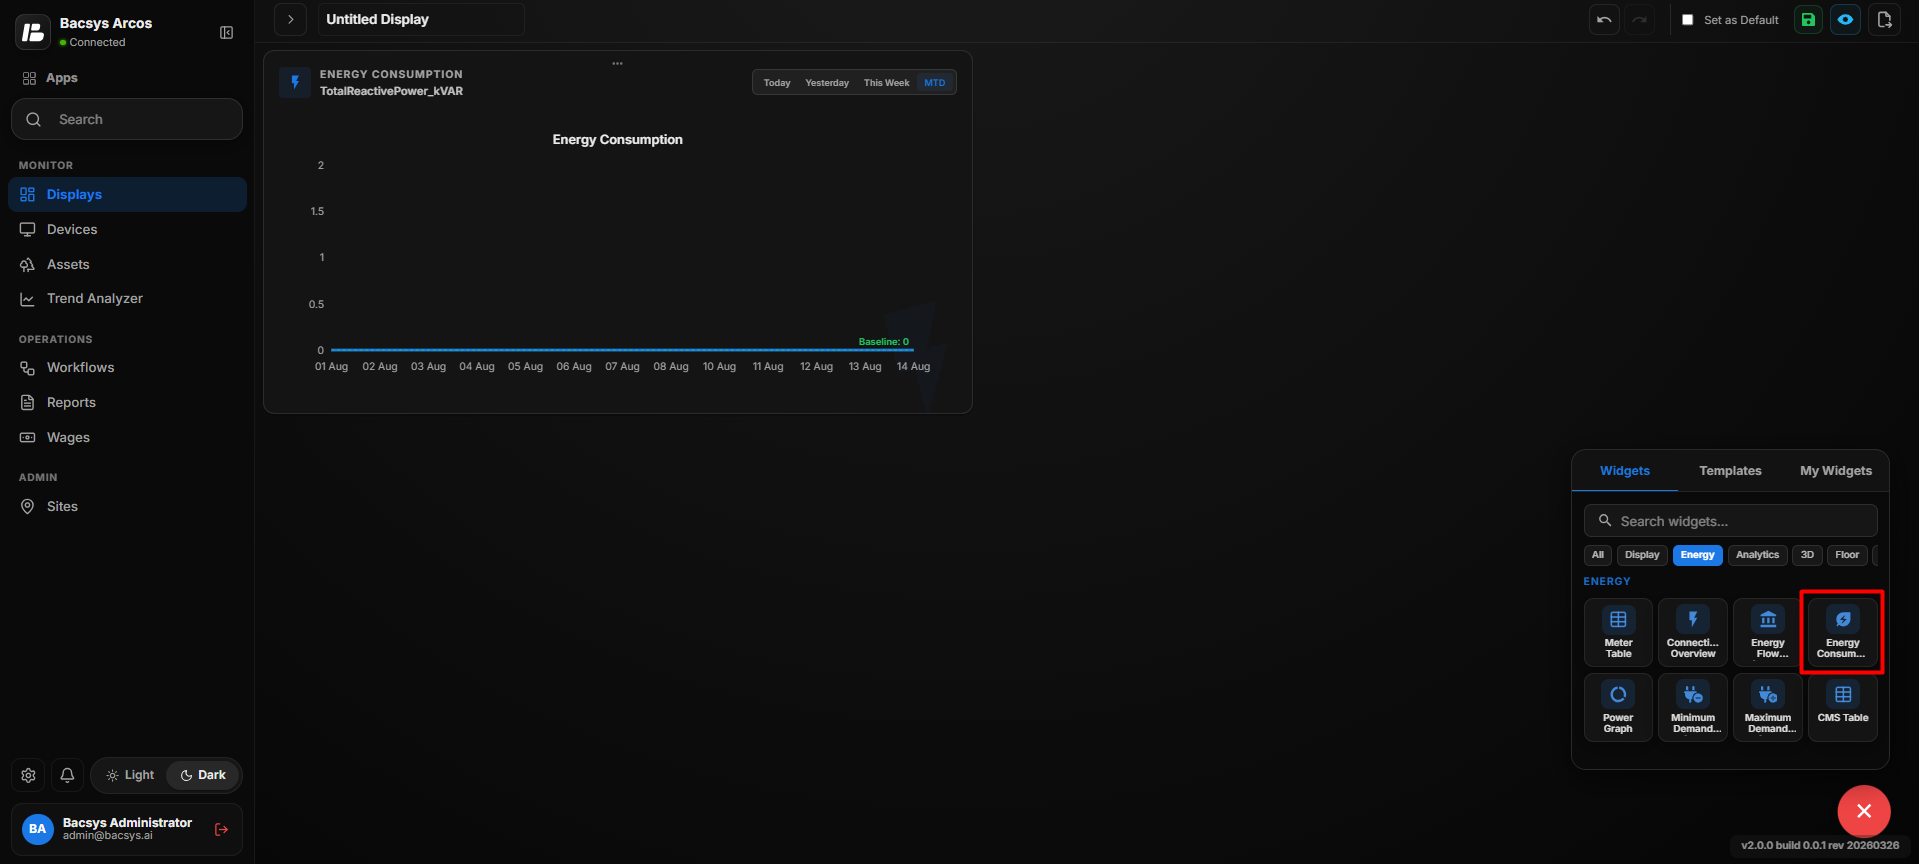
Save the Configuration
After clicking Save, the Energy Consumption Widget displays the energy consumption value from the selected point and refreshes according to the configured polling frequency.
Add and Configure the Power Graph Widget
The Power Graph Widget is used to visualize power-related data from one or more selected points. The values from the selected points are combined and displayed in the graph.
Add the Power Graph Widget
- Click the + icon.
- Drag and drop the Power Graph Widget onto the display.
- Select the Power Graph Widget to view the available widget actions:
- Zoom In
- Zoom Out
- Settings
- Remove Widget
- Use Zoom In and Zoom Out to adjust the widget view as required.
- Click Settings to open the Configure Data panel.
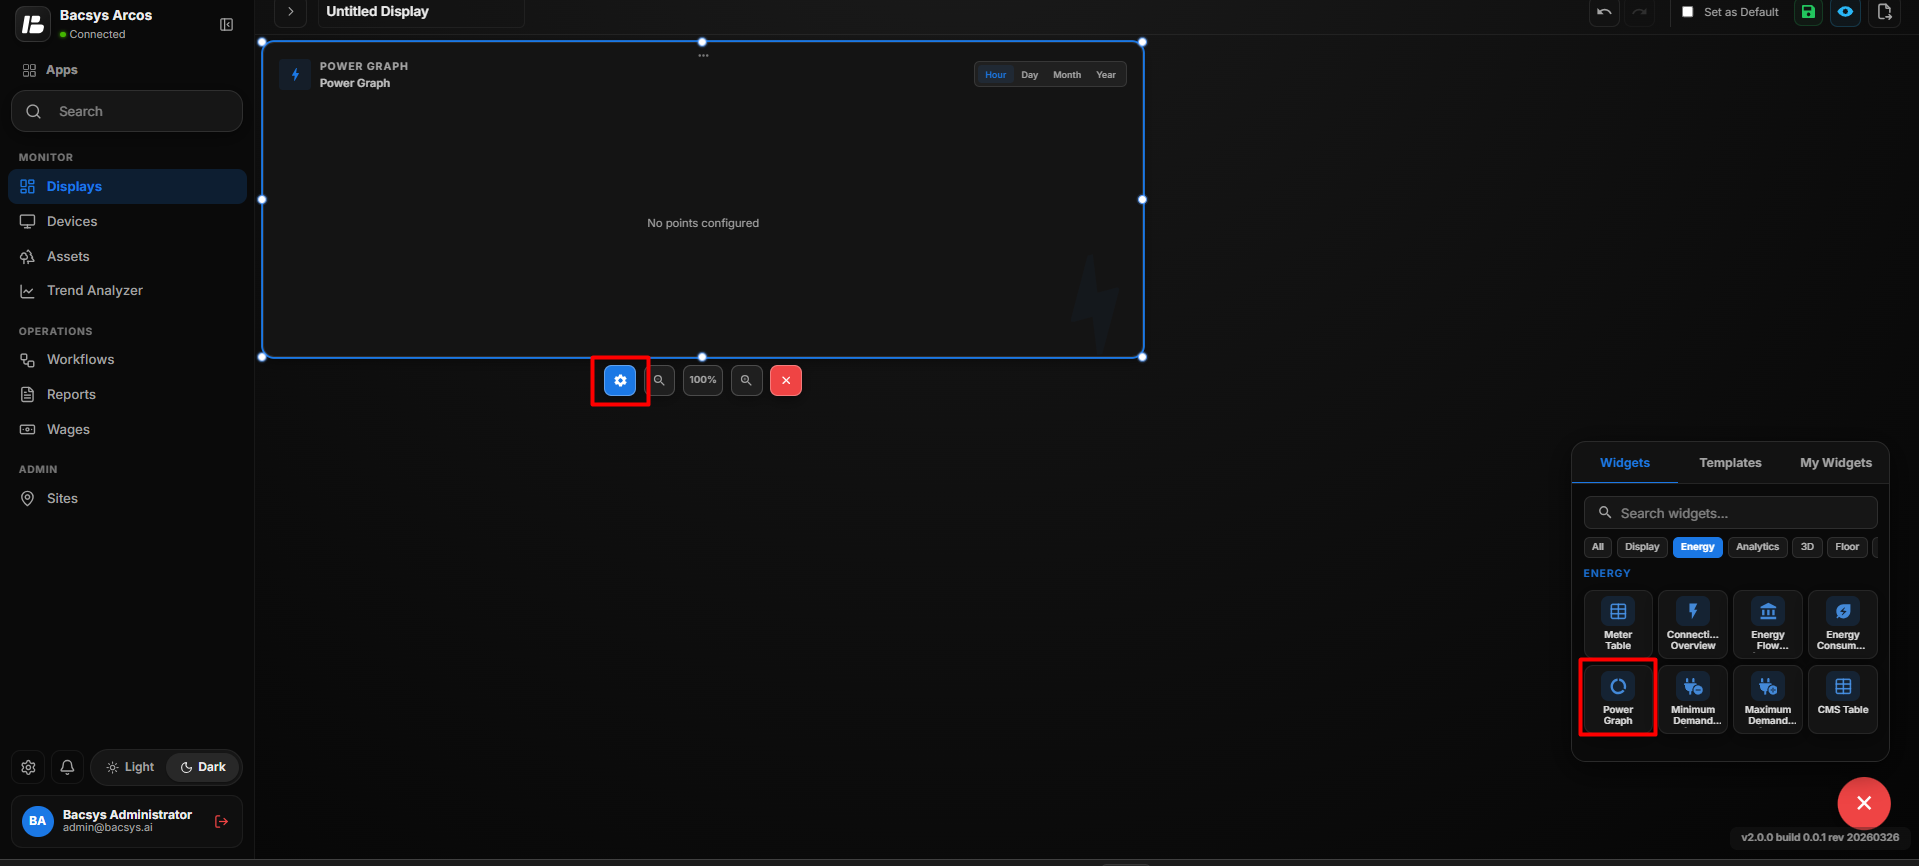
Power Graph Widget Settings
| Option | Description |
|---|---|
| Title | Enter the title to be displayed for the Power Graph Widget. |
| Select Point | Select one or more points whose values should be displayed in the graph. The values of the selected points are summed. Click Browse Hierarchy to select the required points. |
| Poll Frequency (Seconds) | Specify how frequently the widget should refresh the selected point values. |
| Show Background | Use the toggle button to show or hide the widget background. |
| Hide Header | Use the toggle button to show or hide the widget header. |
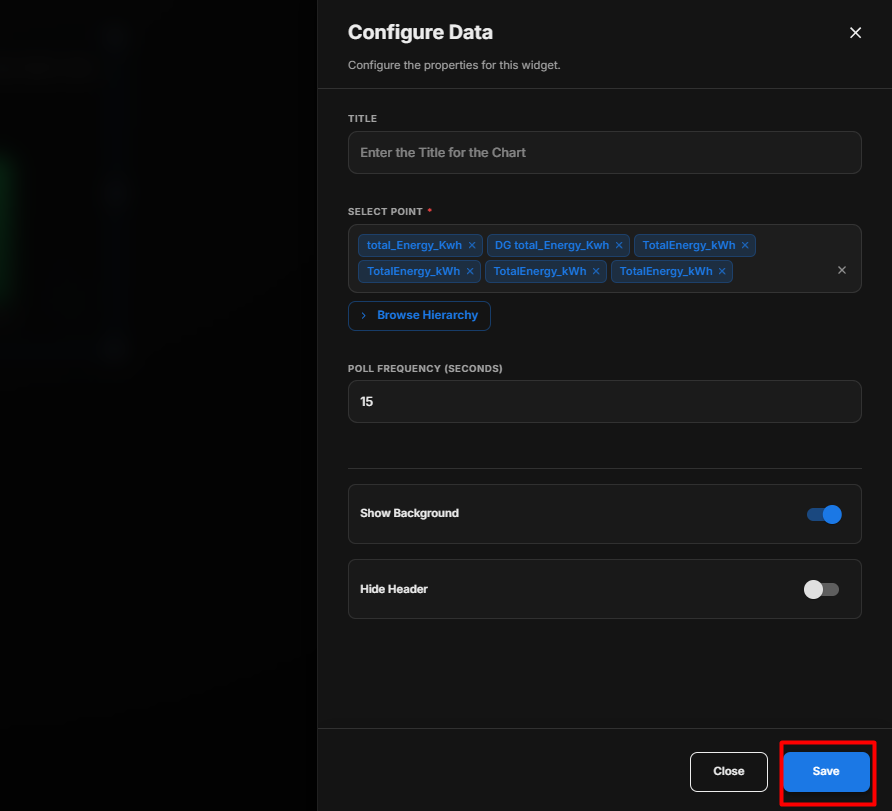
Configure the Power Graph Widget
- Enter the required Title.
- Under Select Point, click Browse Hierarchy.
- Navigate through Network → Device → Point.
- Select the required power points.
- Multiple points can be selected, and their values are summed for the graph.
- Set the required Poll Frequency (Seconds).
- Configure Show Background according to your requirement.
- Configure Hide Header according to your requirement.
- Review the configured settings.
- Click Save.
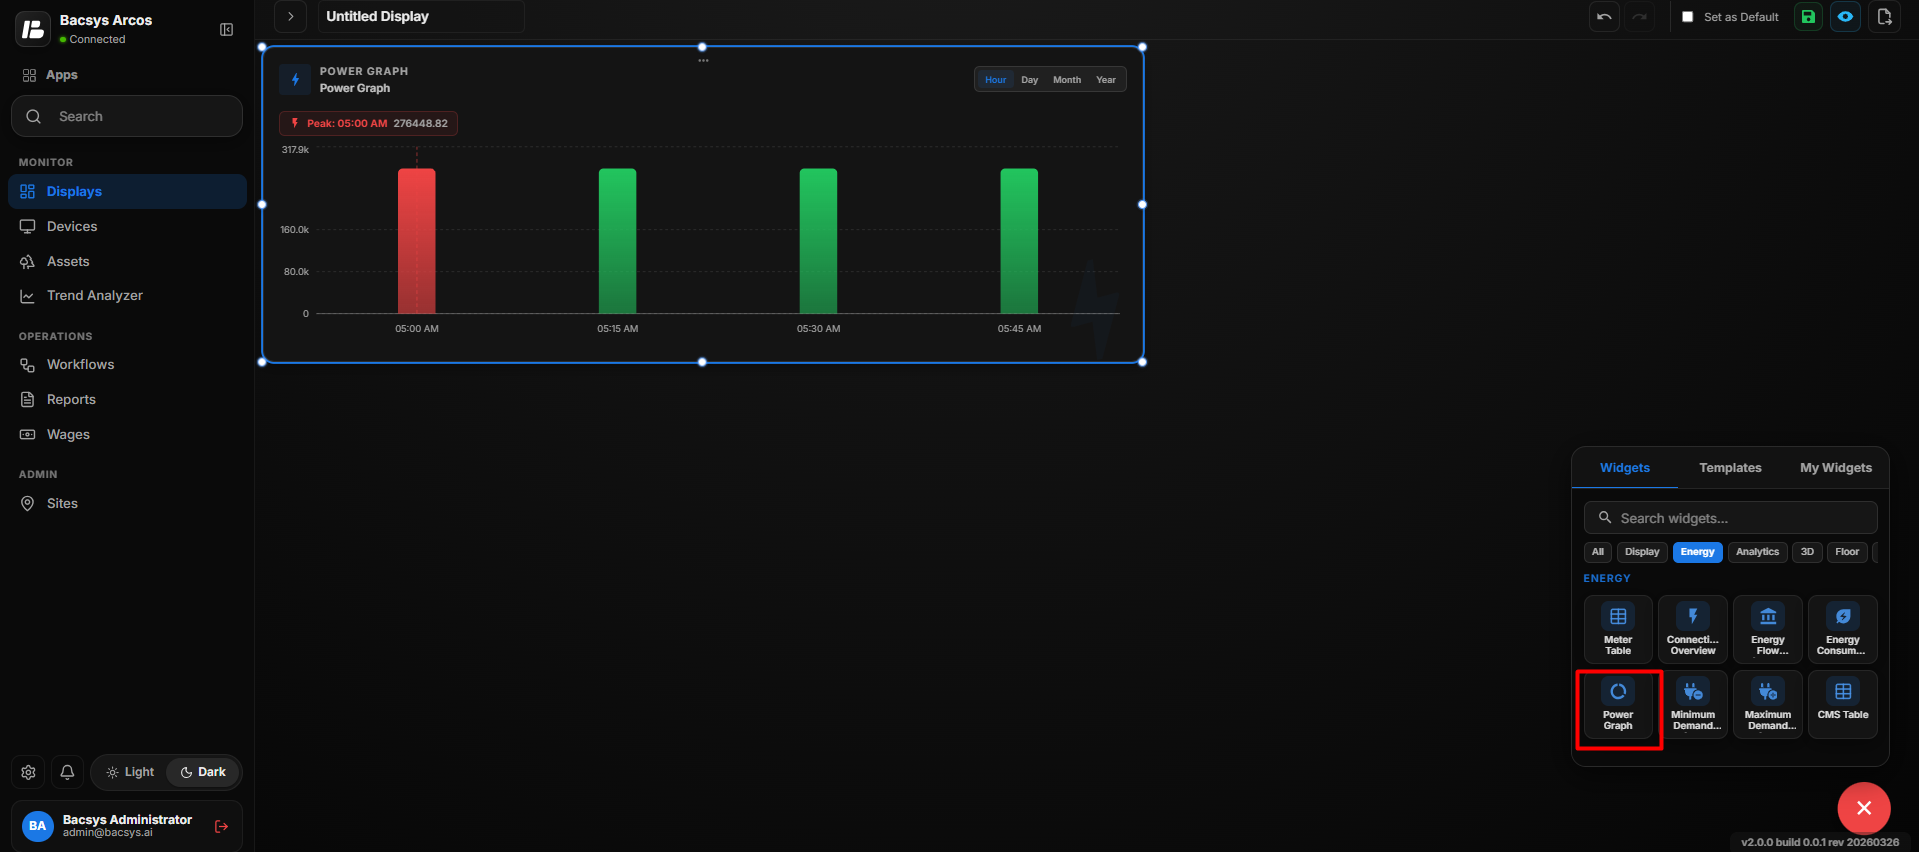
Power Graph Behavior
The Power Graph Widget uses the selected points to calculate the combined power value. When multiple points are selected, their values are summed and represented in the graph.
Save the Configuration
After clicking Save, the Power Graph Widget displays the combined power data from the selected points and updates according to the configured polling frequency.
Add and Configure the Min Demand Widget
The Min Demand Widget is used to display the minimum demand value for a selected power point. The widget is configured to display the demand value in kW.
Add the Min Demand Widget
- Click the + icon.
- Drag and drop the Min Demand Widget onto the display.
- Select the Min Demand Widget to view the available widget actions:
- Zoom In
- Zoom Out
- Settings
- Remove Widget
- Use Zoom In and Zoom Out to adjust the widget view as required.
- Click Settings to open the Configure Data panel.
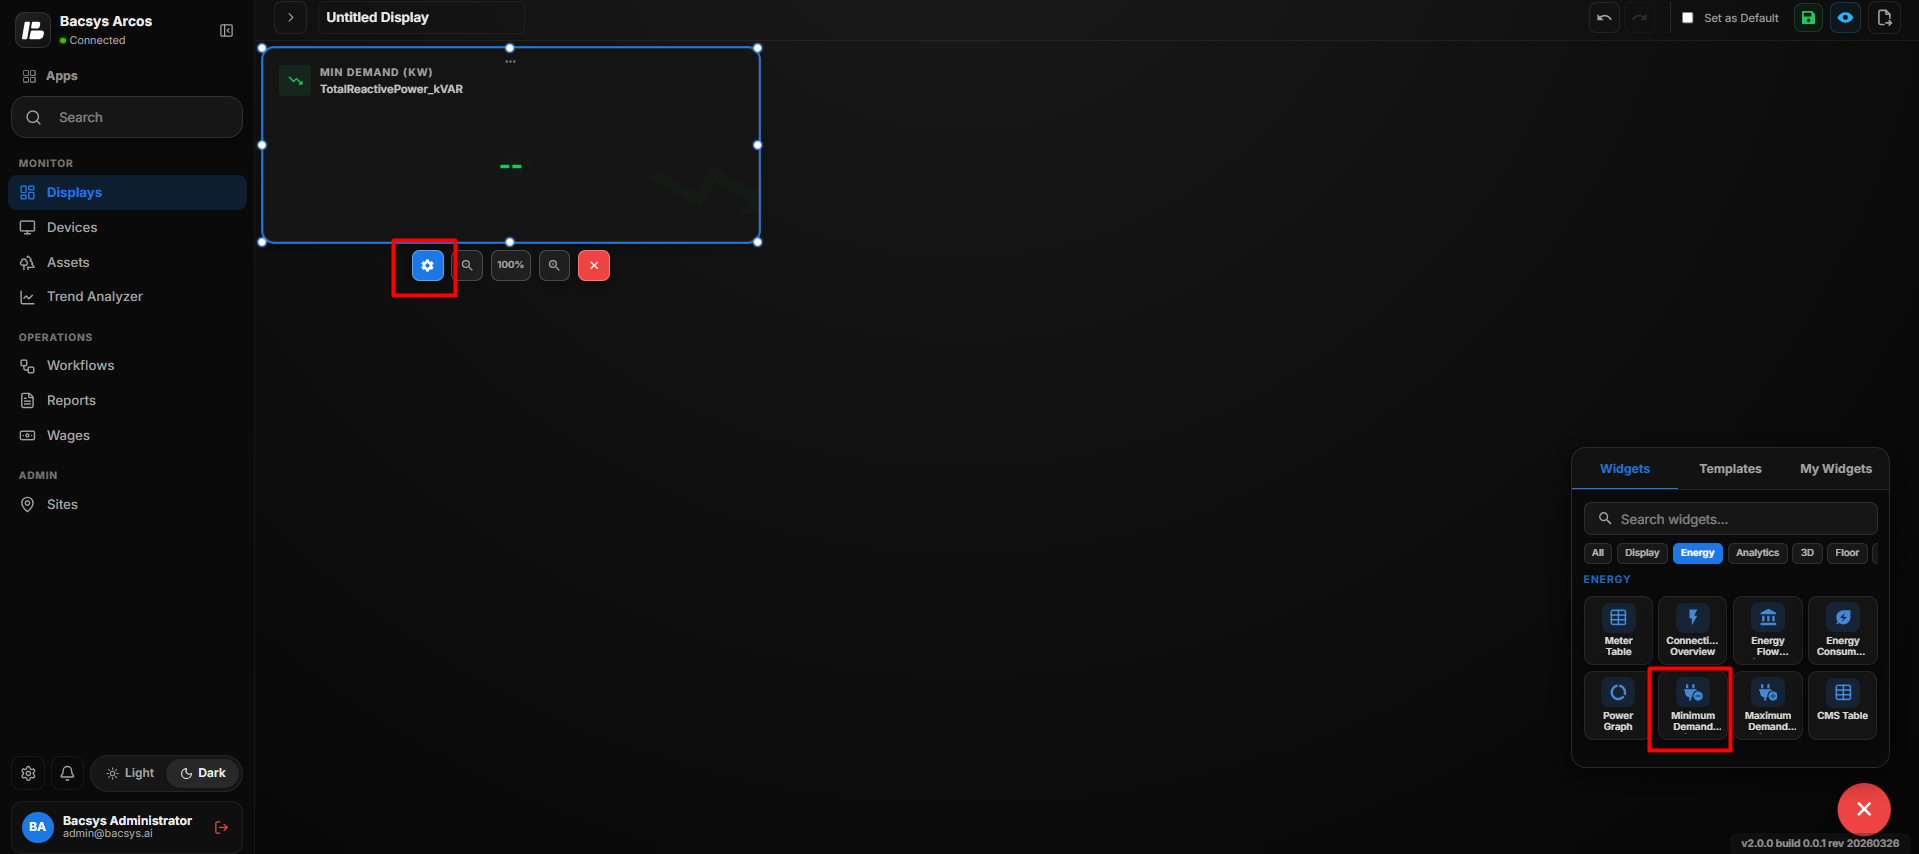
Min Demand Widget Settings
| Option | Description |
|---|---|
| Title | Enter the title to be displayed for the Min Demand Widget. |
| Select Point | Select the power point used to determine the minimum demand value. Click Browse Hierarchy to select the required point. |
| Poll Frequency (Seconds) | Specify how frequently the widget should refresh the selected point value. |
| Show Background | Use the toggle button to show or hide the widget background. |
| Hide Header | Use the toggle button to show or hide the widget header. |
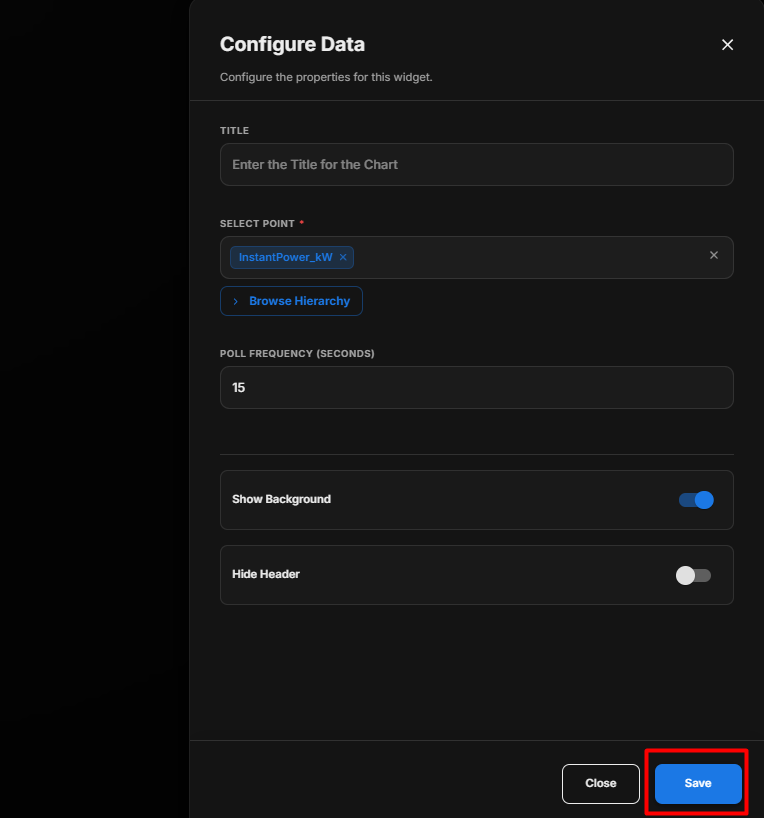
Configure the Min Demand Widget
- Enter the required Title.
- Under Select Point, click Browse Hierarchy.
- Navigate through Network → Device → Point.
- Select the required kW power point.
- Set the required Poll Frequency (Seconds).
- Configure Show Background according to your requirement.
- Configure Hide Header according to your requirement.
- Review the configured settings.
- Click Save.
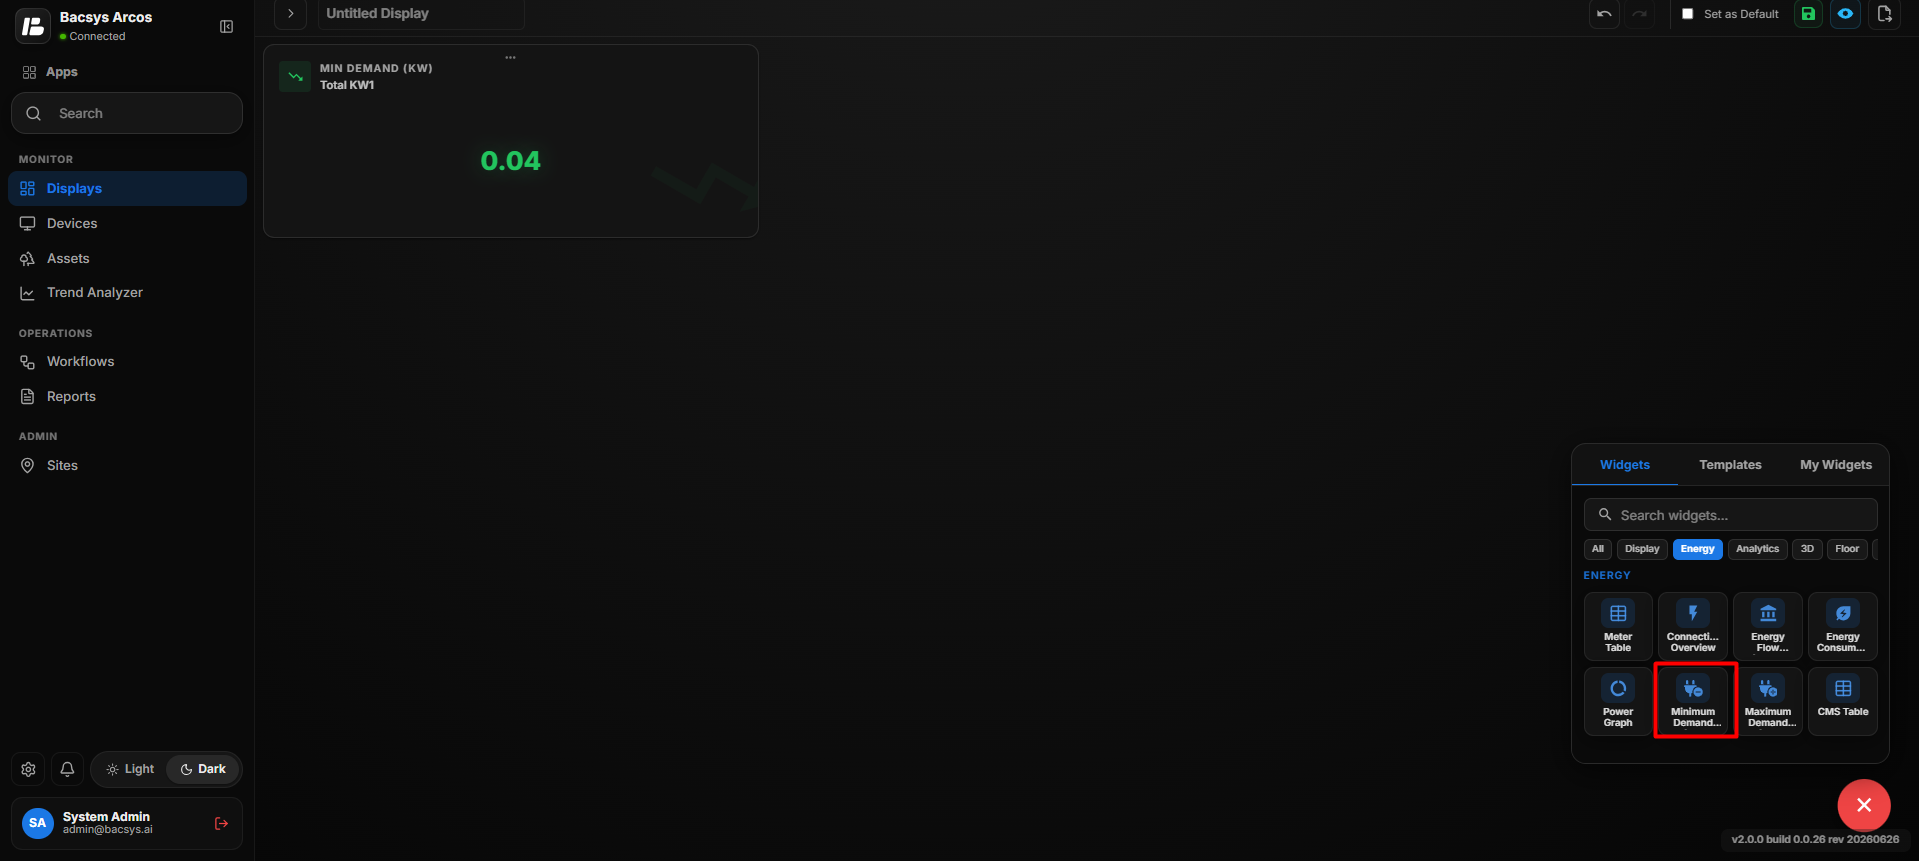
Min Demand Value
After saving, the widget displays the minimum demand value in kW for the selected power point.
Save the Configuration
After clicking Save, the Min Demand Widget displays the configured minimum kW demand value and refreshes according to the configured polling frequency.
Add and Configure the Max Demand Widget
The Max Demand Widget is used to display the maximum demand value for a selected power point. The widget displays the demand value in kW.
Add the Max Demand Widget
- Click the + icon.
- Drag and drop the Max Demand Widget onto the display.
- Select the Max Demand Widget to view the available widget actions:
- Zoom In
- Zoom Out
- Settings
- Remove Widget
- Use Zoom In and Zoom Out to adjust the widget view as required.
- Click Settings to open the Configure Data panel.
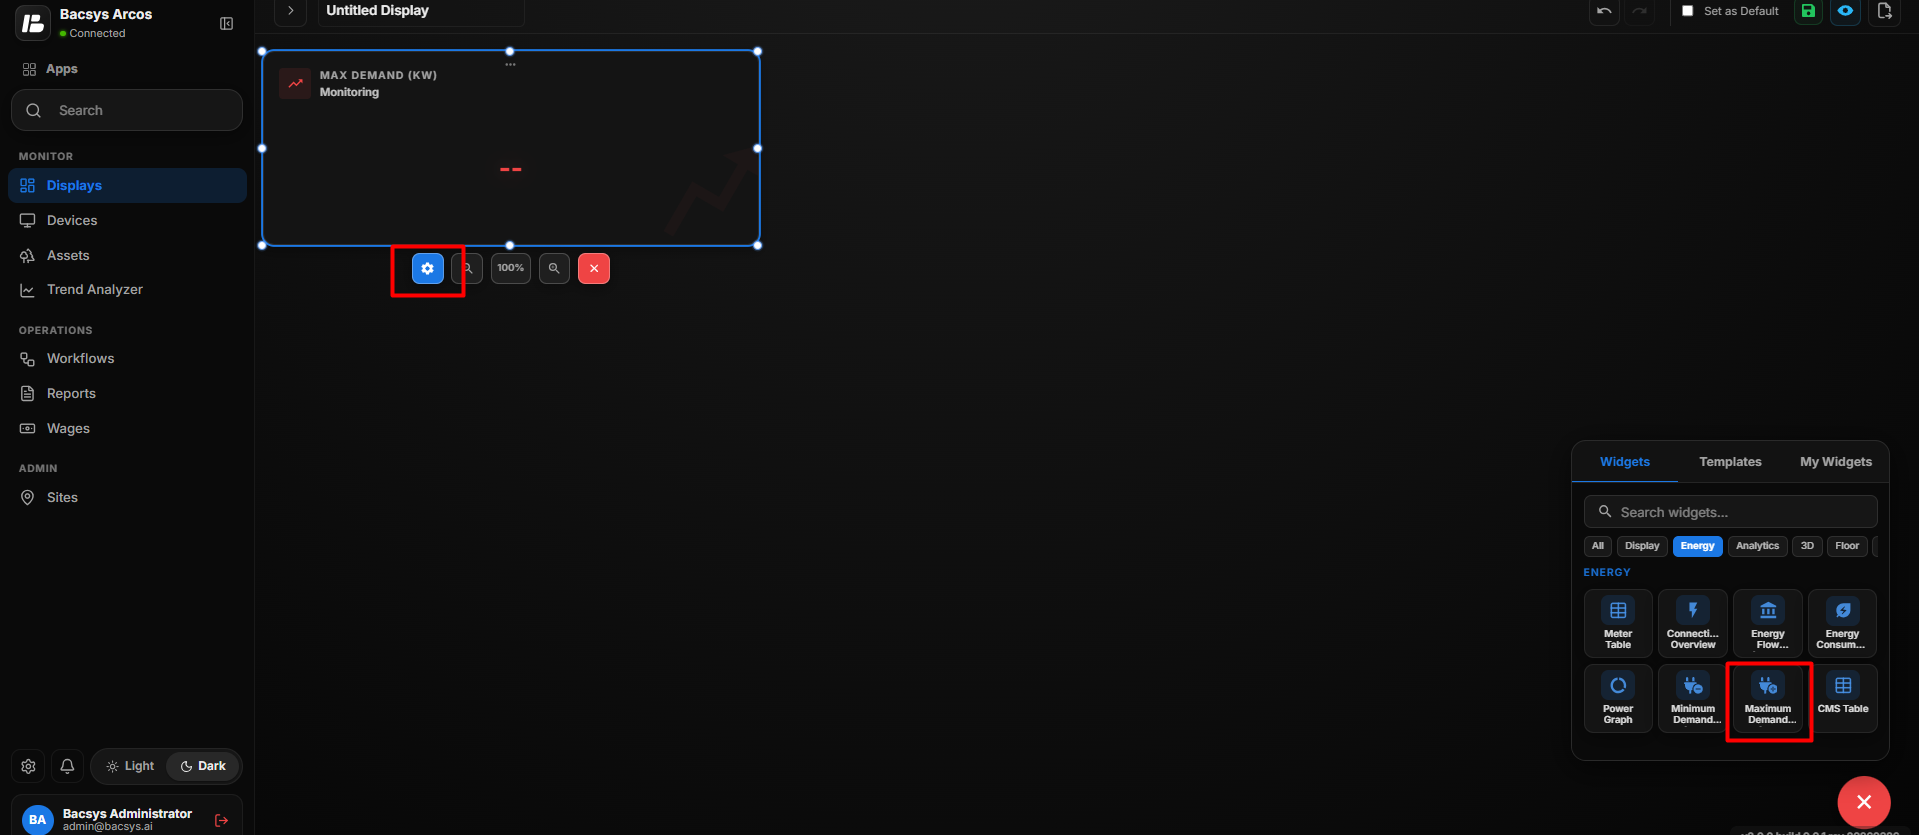
Max Demand Widget Settings
| Option | Description |
|---|---|
| Title | Enter the title to be displayed for the Max Demand Widget. |
| Select Point | Select the power point used to determine the maximum demand value. Click Browse Hierarchy to select the required point. |
| Poll Frequency (Seconds) | Specify how frequently the widget should refresh the selected point value. |
| Show Background | Use the toggle button to show or hide the widget background. |
| Hide Header | Use the toggle button to show or hide the widget header. |
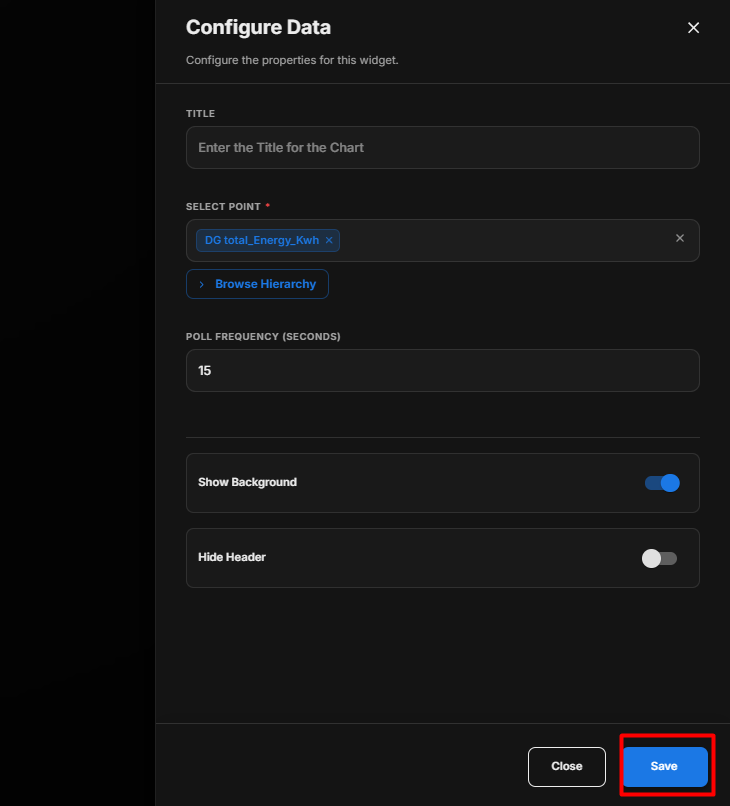
Configure the Max Demand Widget
- Enter the required Title.
- Under Select Point, click Browse Hierarchy.
- Navigate through Network → Device → Point.
- Select the required kW power point.
- Set the required Poll Frequency (Seconds).
- Configure Show Background according to your requirement.
- Configure Hide Header according to your requirement.
- Review the configured settings.
- Click Save.
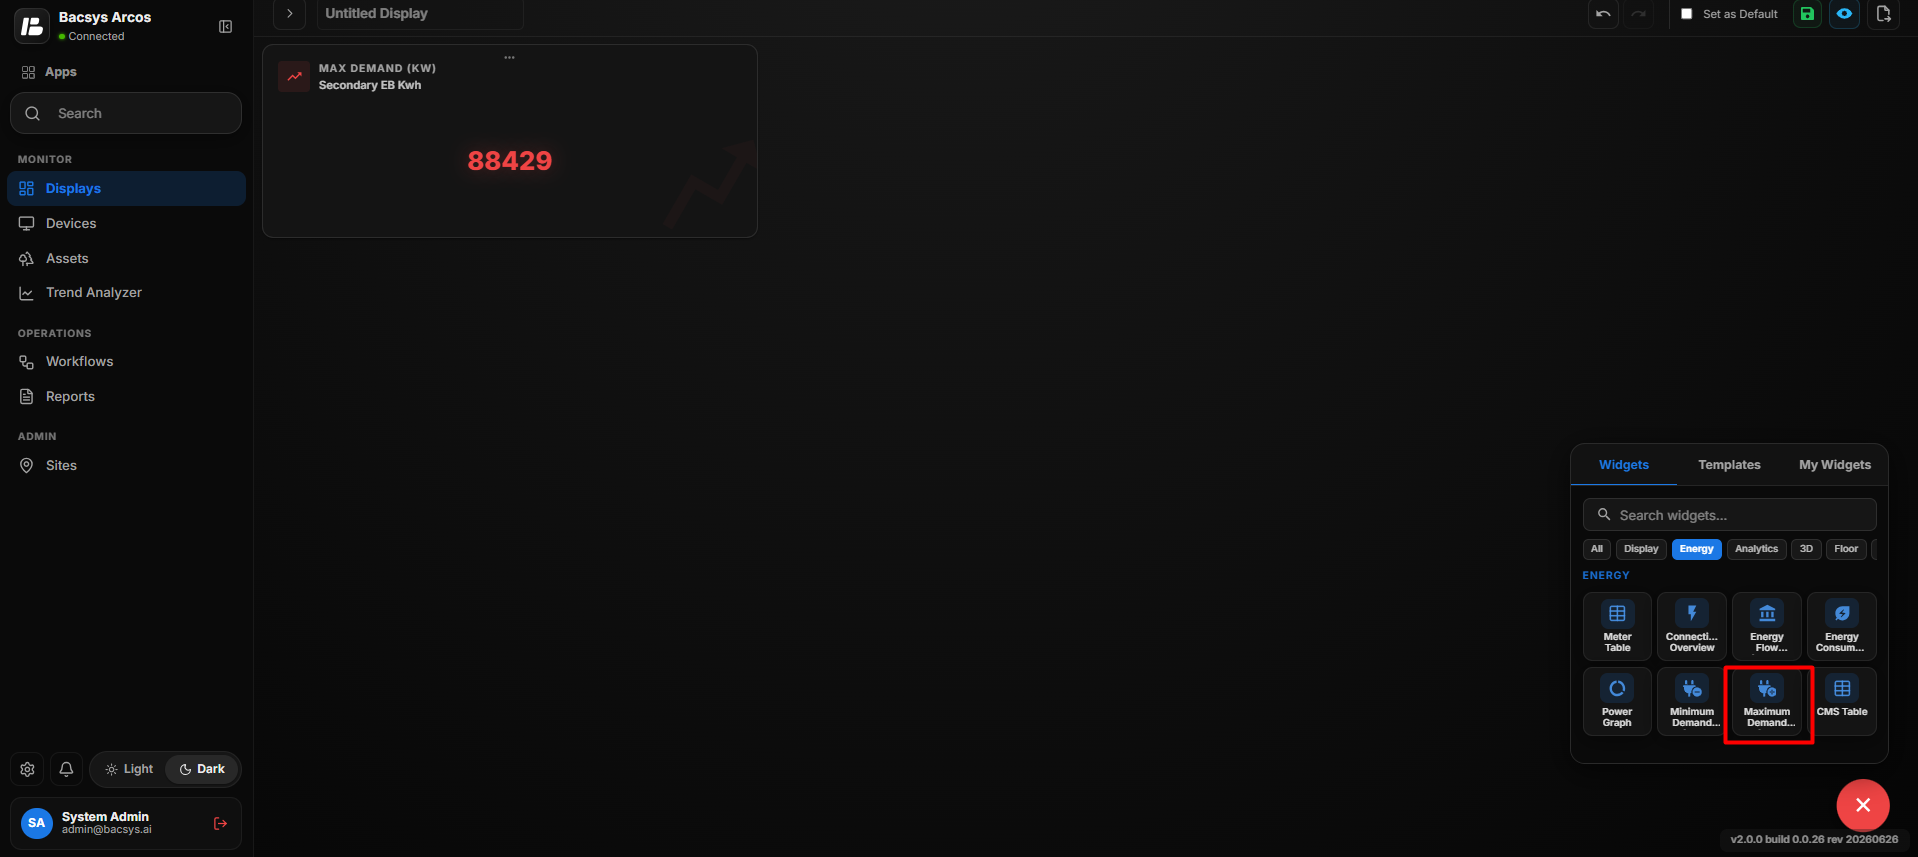
Max Demand Value
After saving, the widget displays the maximum demand value in kW for the selected power point.
Save the Configuration
After clicking Save, the Max Demand Widget displays the configured maximum kW demand value and refreshes according to the configured polling frequency.
CMMS Table Widget
The CMMS Table Widget displays device-related maintenance and parameter information in a structured table. It allows users to select a device, configure constant points and parameters, customize the table appearance, and map the device to a dashboard.
Add the CMMS Table Widget
- Click the + icon.
- Drag and drop the CMMS Table Widget onto the display.
- Select the CMMS Table Widget.
- Use Zoom In and Zoom Out to adjust the widget size and view.
- Click Settings to open the Configure Data panel.
- Configure the required CMMS table settings.
- Review the configured settings.
- Click Save.
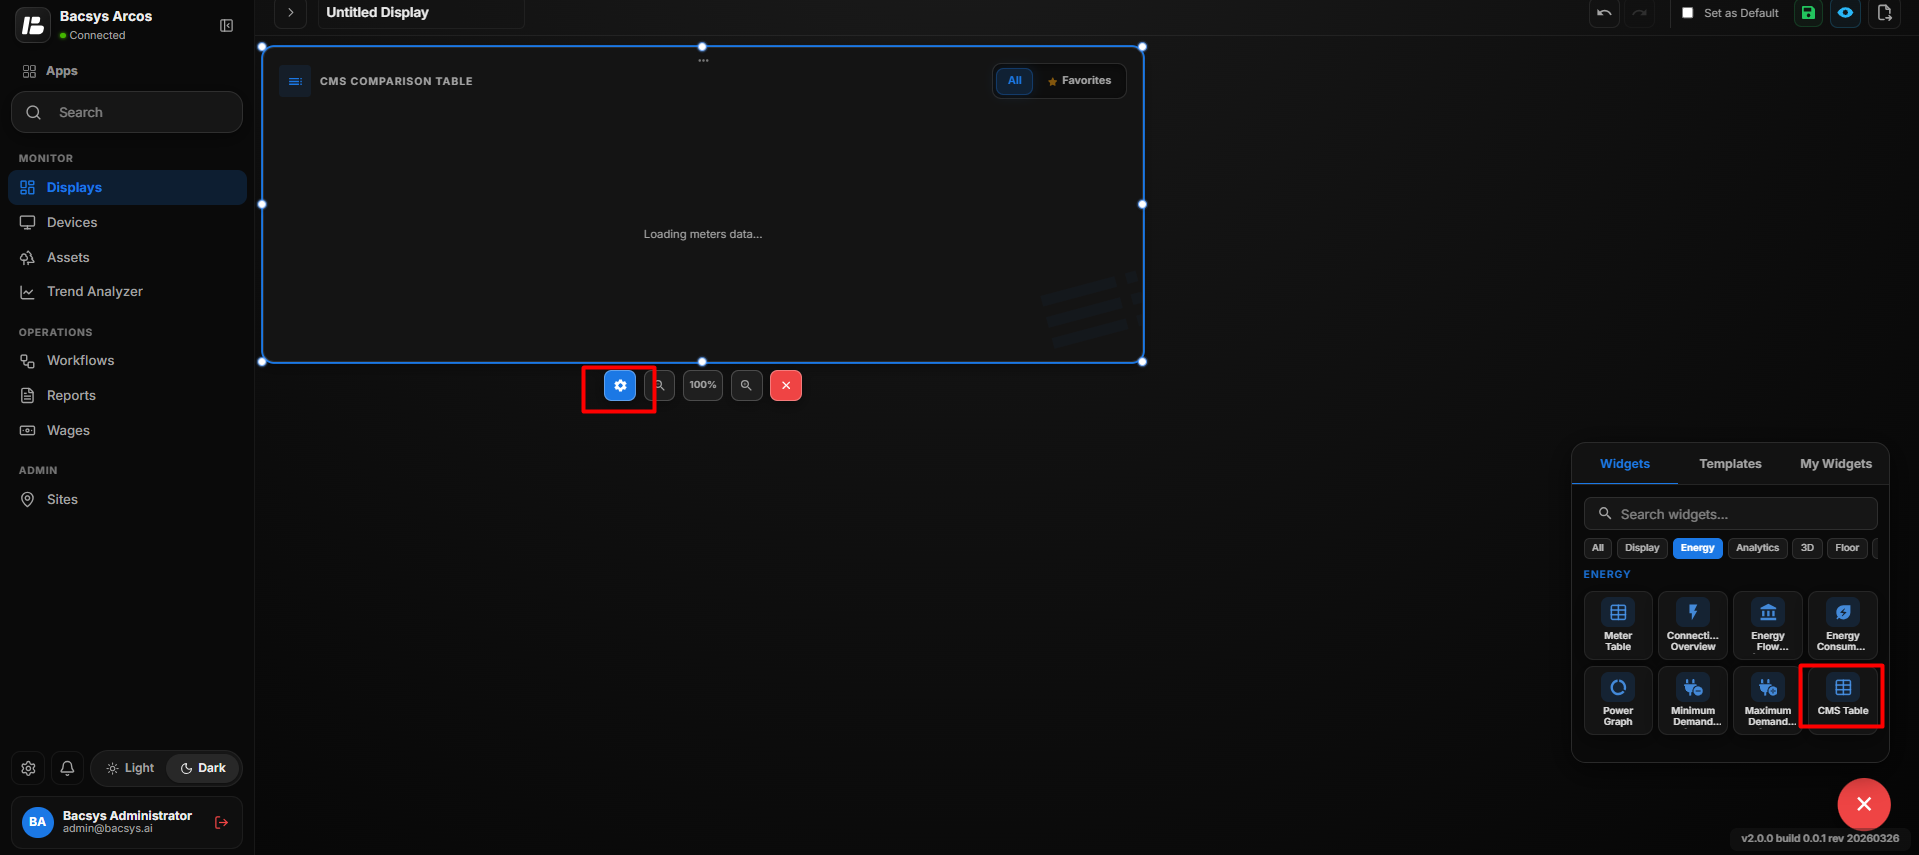
CMMS Table Settings
| Option | Description |
|---|---|
| Title | Enter a title for the CMMS table. |
| Select Device | Select the device for which the CMMS information should be displayed. |
| Add Constant Points | Configure the constant points to be displayed for the selected device. |
| No. of Constant Points | Specify the number of constant points to configure. |
| Constant Point | Enter the name of each constant point, such as Voltage, Power Factor, or Voltage THD. |
| No. of Parameters | Specify the number of parameters to be displayed in the table. |
| Bold Text | Enable the toggle to display the table text in bold. |
| Font Size | Specify the font size for the table content. |
| Enable Write Value | Enable the toggle to allow values to be written from the table when supported. |
| Show FROM Column | Enable the toggle to display the FROM column. |
| Show TO Column | Enable the toggle to display the TO column. |
| Device Dashboards Mapping | Map the selected device to a specific display/dashboard. |
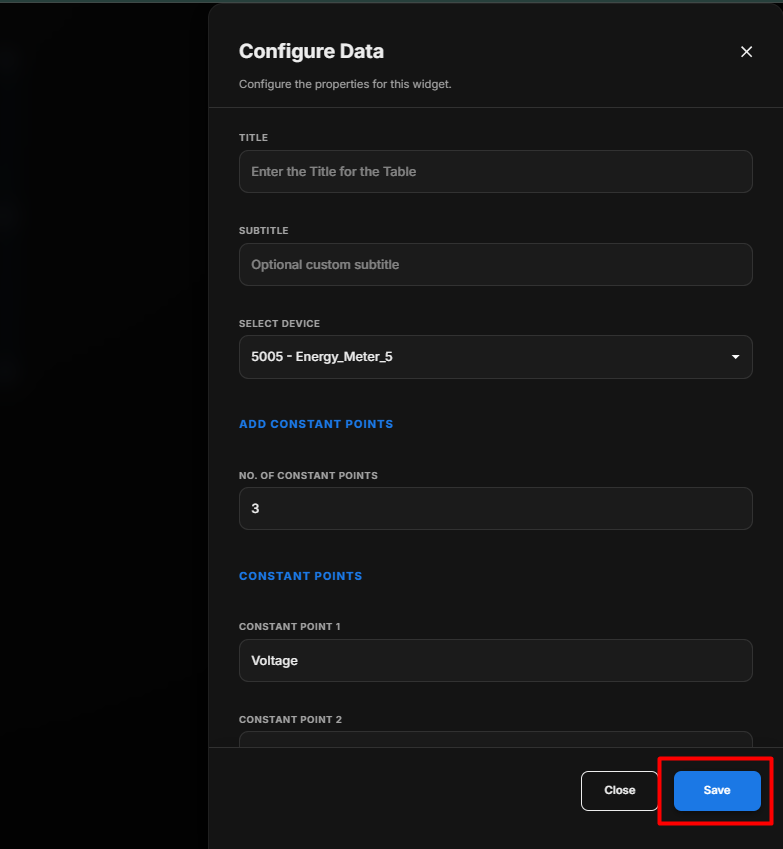
Select a Device
Under Select Device, select the device for which the CMMS information needs to be displayed.
Configure Constant Points
- Under No. of Constant Points, enter the required number of constant points.
- Configure each constant point.
- Enter the required constant point names.
Examples of constant points include:
- Voltage
- Power Factor
- Voltage THD
Configure Parameters
- Under No. of Parameters, specify the number of parameters required.
- Configure the required parameters for the selected device.
- Review the configured parameters.
Configure Table Appearance
- Enable Bold Text if required.
- Set the required Font Size.
- Enable Enable Write Value if values need to be written from the table.
- Enable Show FROM Column if the FROM column is required.
- Enable Show TO Column if the TO column is required.
Configure Device Dashboards Mapping
The Device Dashboards Mapping section allows the selected device to be associated with a display/dashboard.
- Locate the required device under Device Dashboards Mapping.
- Use the search field to find the required display.
- Select the display to map it to the device.
- Review the selected dashboard mapping.
Save the Configuration
After configuring the device, constant points, parameters, table options, and dashboard mapping, click Save.
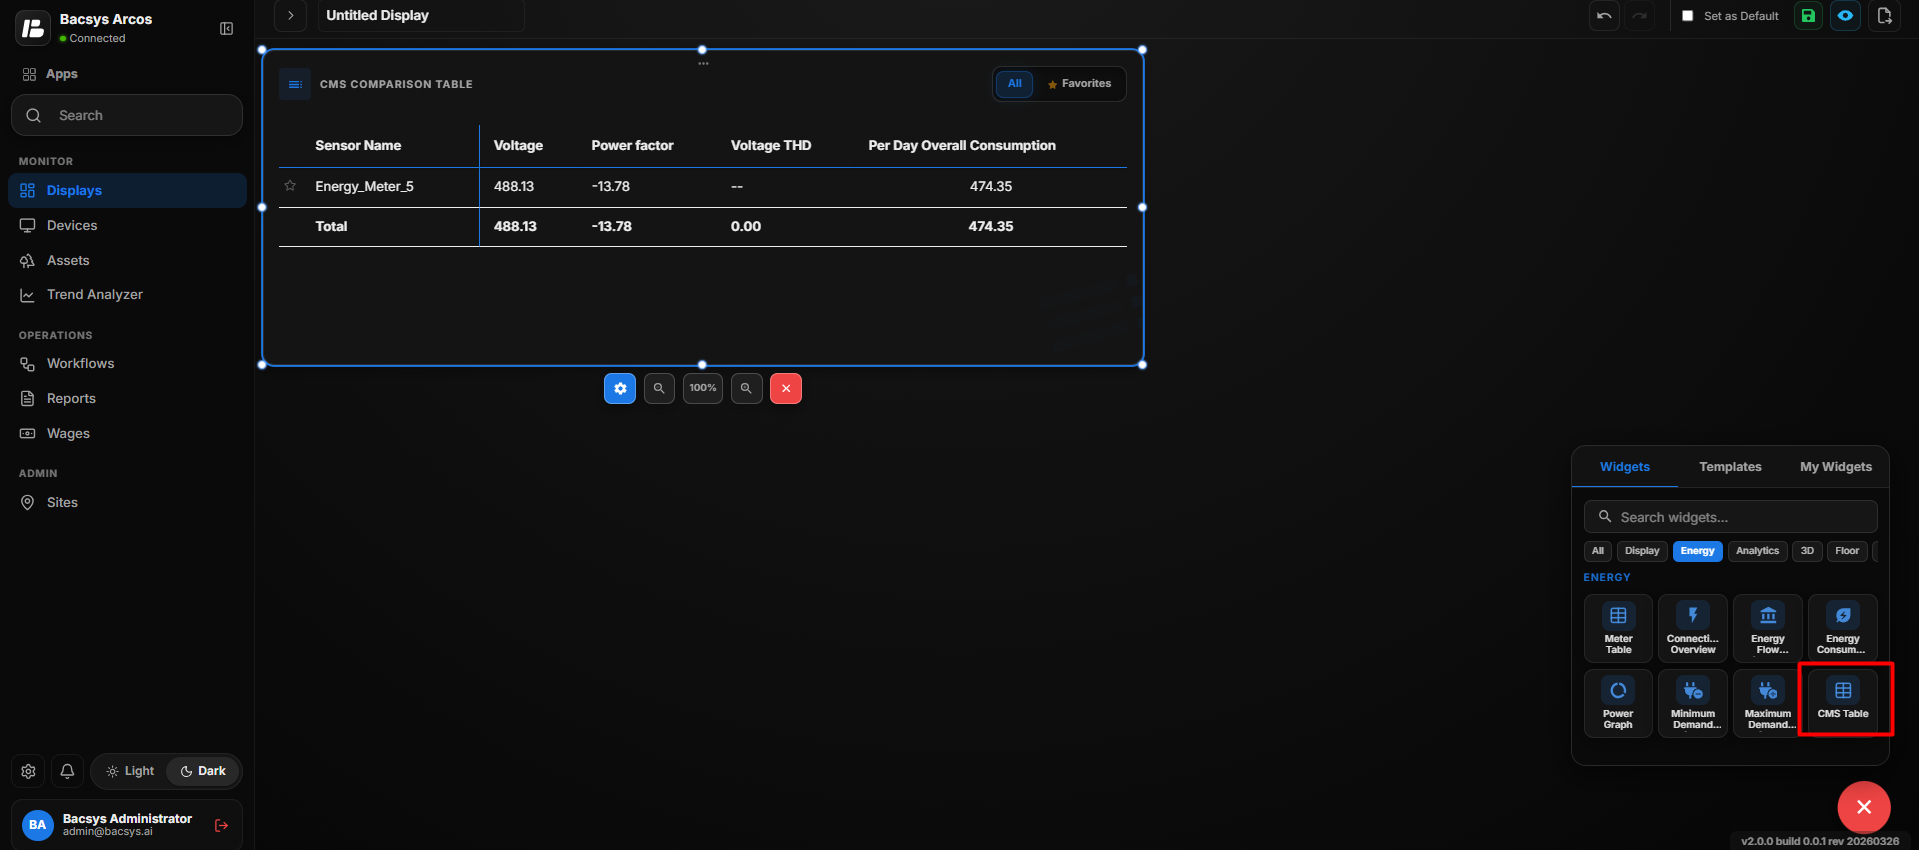
The CMMS Table Widget is updated on the display with the configured device information and selected settings.
Analytics
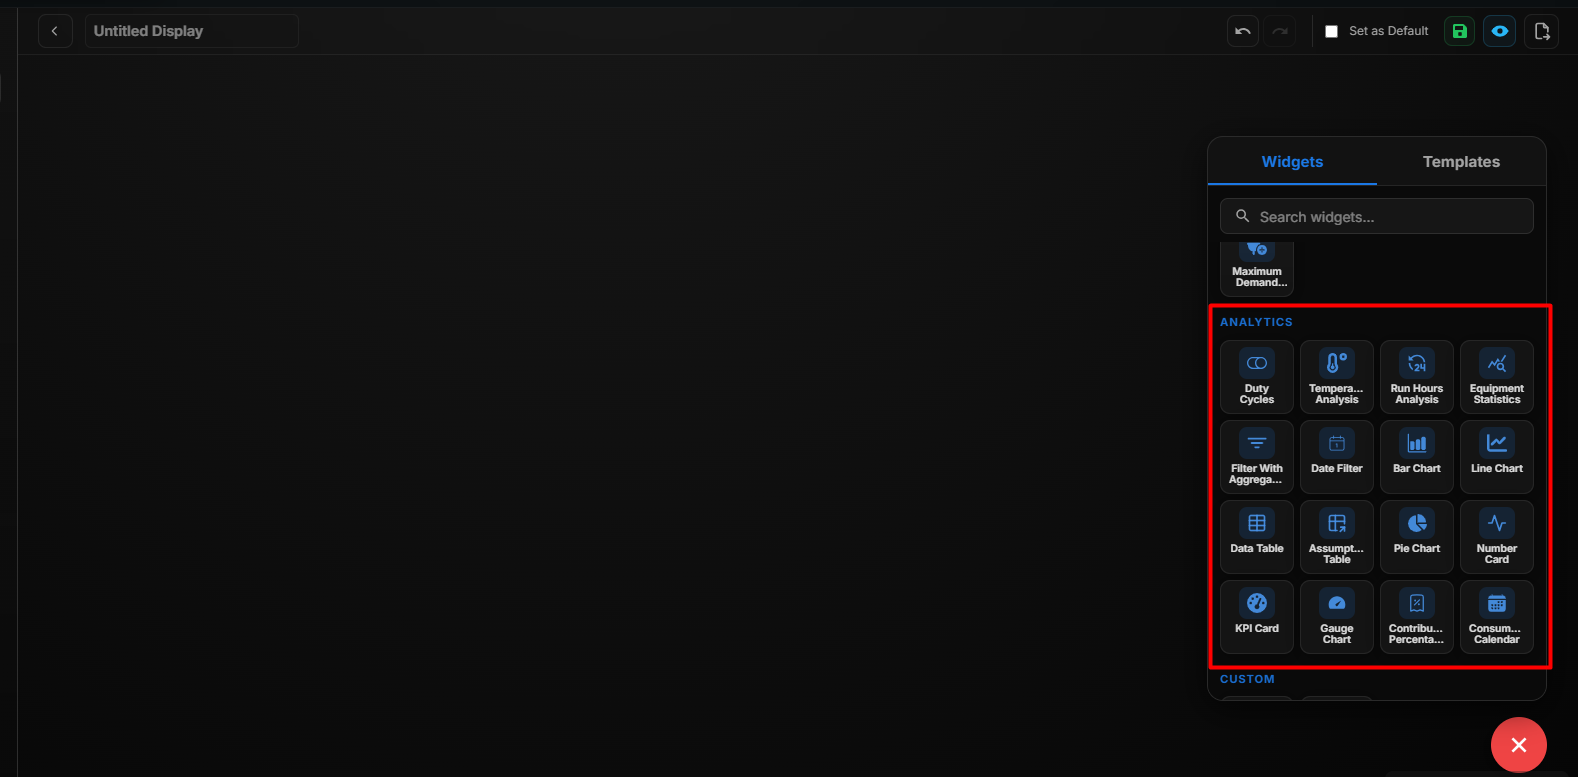 Analytics
The Analytics module provides advanced data visualization, filtering, and performance evaluation tools.
| Feature | Description |
|---|---|
| Duty Cycles | Analyzes the operational cycles of equipment, showing ON/OFF patterns and runtime distribution. |
| Temperature Analysis | Provides detailed analysis of temperature trends over time for selected points or systems. |
| Run Hours Analysis | Displays the total runtime hours of equipment within a selected period. |
| Equipment Statistics | Shows statistical summaries such as minimum, maximum, average, and total values for selected equipment. |
| Filter with Aggregation | Allows users to apply aggregation methods such as Min, Max, Average, or Sum to filtered data. |
| Data Filter | Enables filtering of data based on time range, equipment, site, or selected parameters. |
| Bar Chart | Visualizes comparative data using vertical or horizontal bars. |
| Line Chart | Displays trend-based data over time using line graphs. |
| Data Table | Shows structured tabular data for detailed review and export. |
| Assumption Table | Displays calculated or assumed values used for analytical comparisons. |
| Pie Chart | Shows proportional data distribution in a circular format. |
| Number Card | Displays a single key metric value in a compact card format. |
| KPI Card | Highlights key performance indicators with summarized values and performance status. |
| Gauge Chart | Displays performance metrics on a visual gauge scale. |
| Contribution Percentage | Shows the percentage contribution of individual components toward total consumption or performance. |
| Consumption Calendar | Displays daily or monthly energy consumption in a calendar view format for pattern analysis. |
Duty Cycles
The Duty Cycles widget analyzes the operational cycle of equipment by displaying its ON/OFF patterns and runtime distribution over a selected period.
Add the Duty Cycles Widget
- Click the + icon.
- Drag and drop the Duty Cycles Widget onto the display.
- Select the Duty Cycles Widget.
- Use Zoom In and Zoom Out to adjust the widget view.
- Click Settings to open the Configure Data panel.
- Configure the required Duty Cycles settings.
- Review the configured settings.
- Click Save.
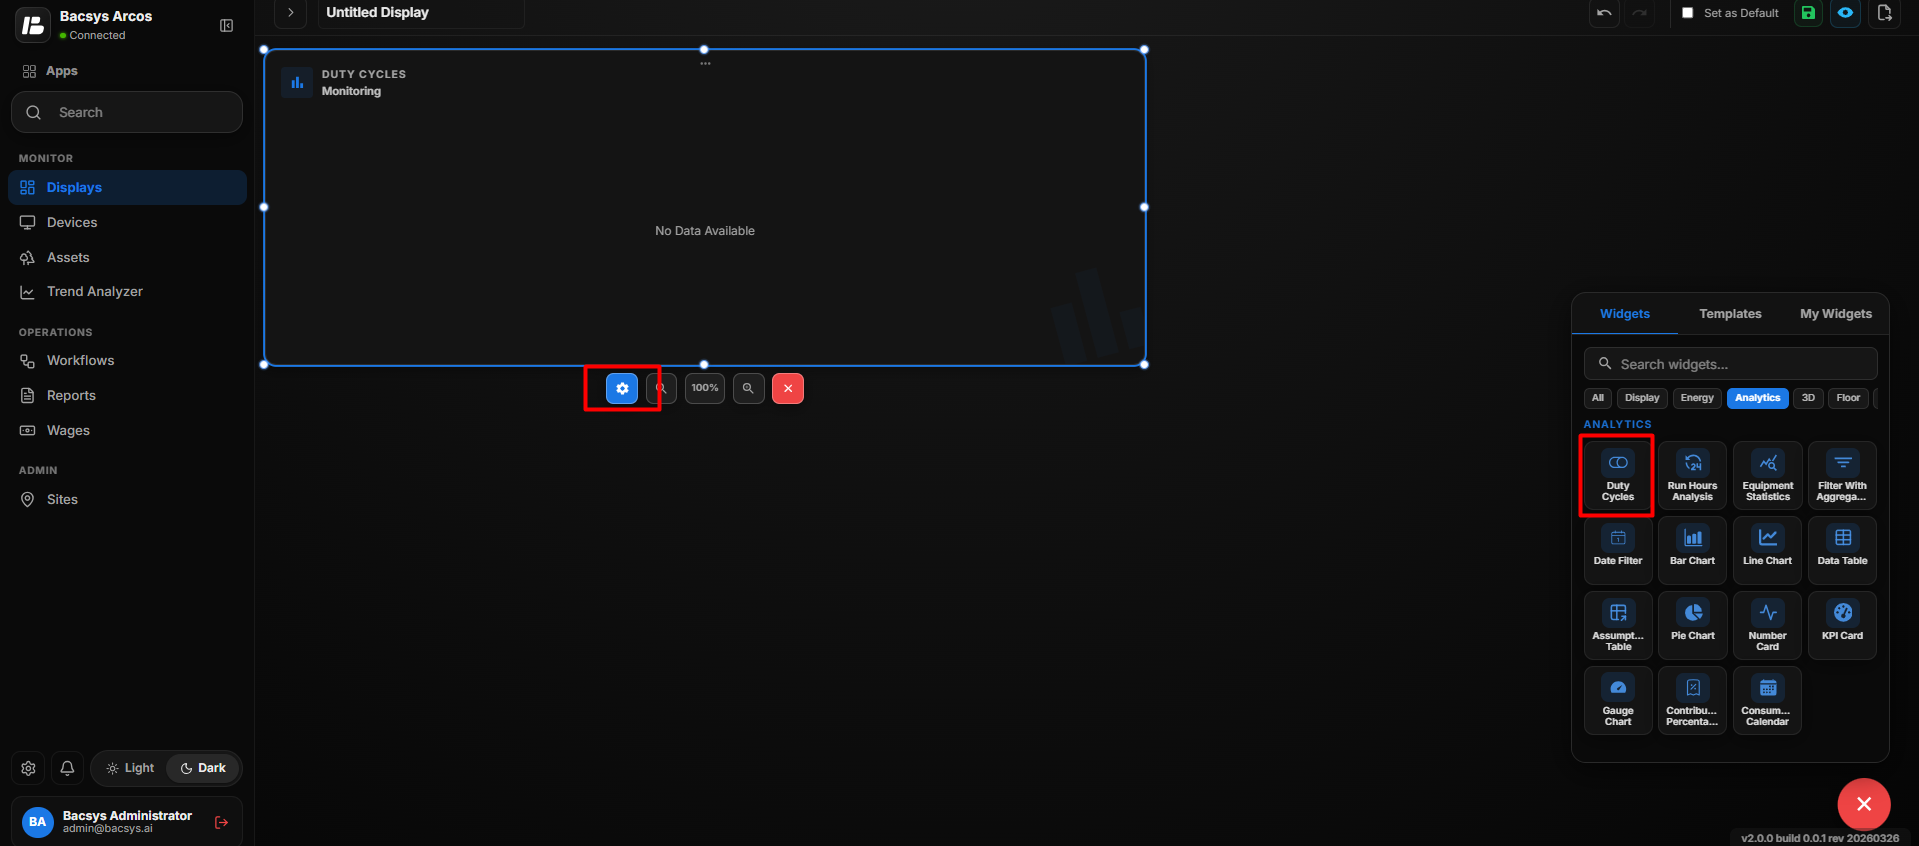 Duty Cycles
 Settings
| Option | Description |
|---|---|
| Title | Enter an optional title for the Duty Cycles widget. |
| Select Point | Select the point used to analyze the equipment's duty cycle. Click Browse Hierarchy to navigate through Network → Device → Point and select the required point. |
| Select Interval | Select the time interval for the duty cycle analysis. The available interval shown is Day Wise. |
| Date | Select the date for which the duty cycle data should be analyzed. |
| Show Background | Use the toggle button to show or hide the widget background. |
| Hide Header | Use the toggle button to show or hide the widget header. |
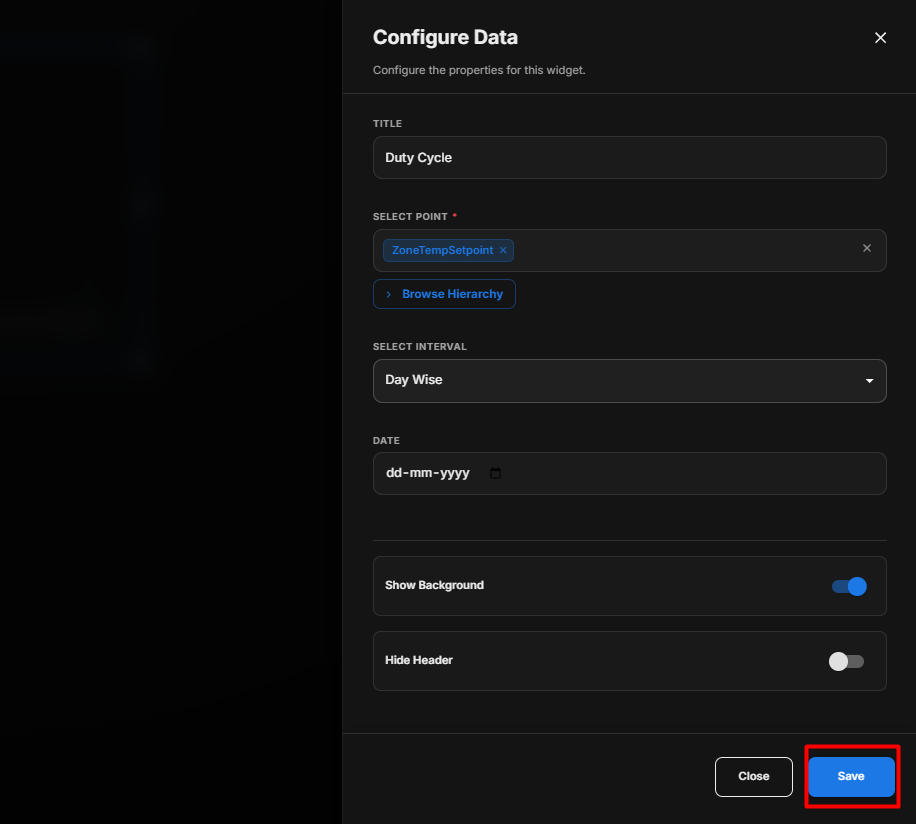 Duty Cycles Settings
Configure the Duty Cycles Widget
- Enter an optional Title.
- Under Select Point, click Browse Hierarchy.
- Navigate through Network → Device → Point.
- Select the required equipment status point.
- Under Select Interval, select the required analysis interval.
- Select the required Date.
- Configure Show Background according to your requirement.
- Configure Hide Header according to your requirement.
- Review the configured settings.
- Click Save.
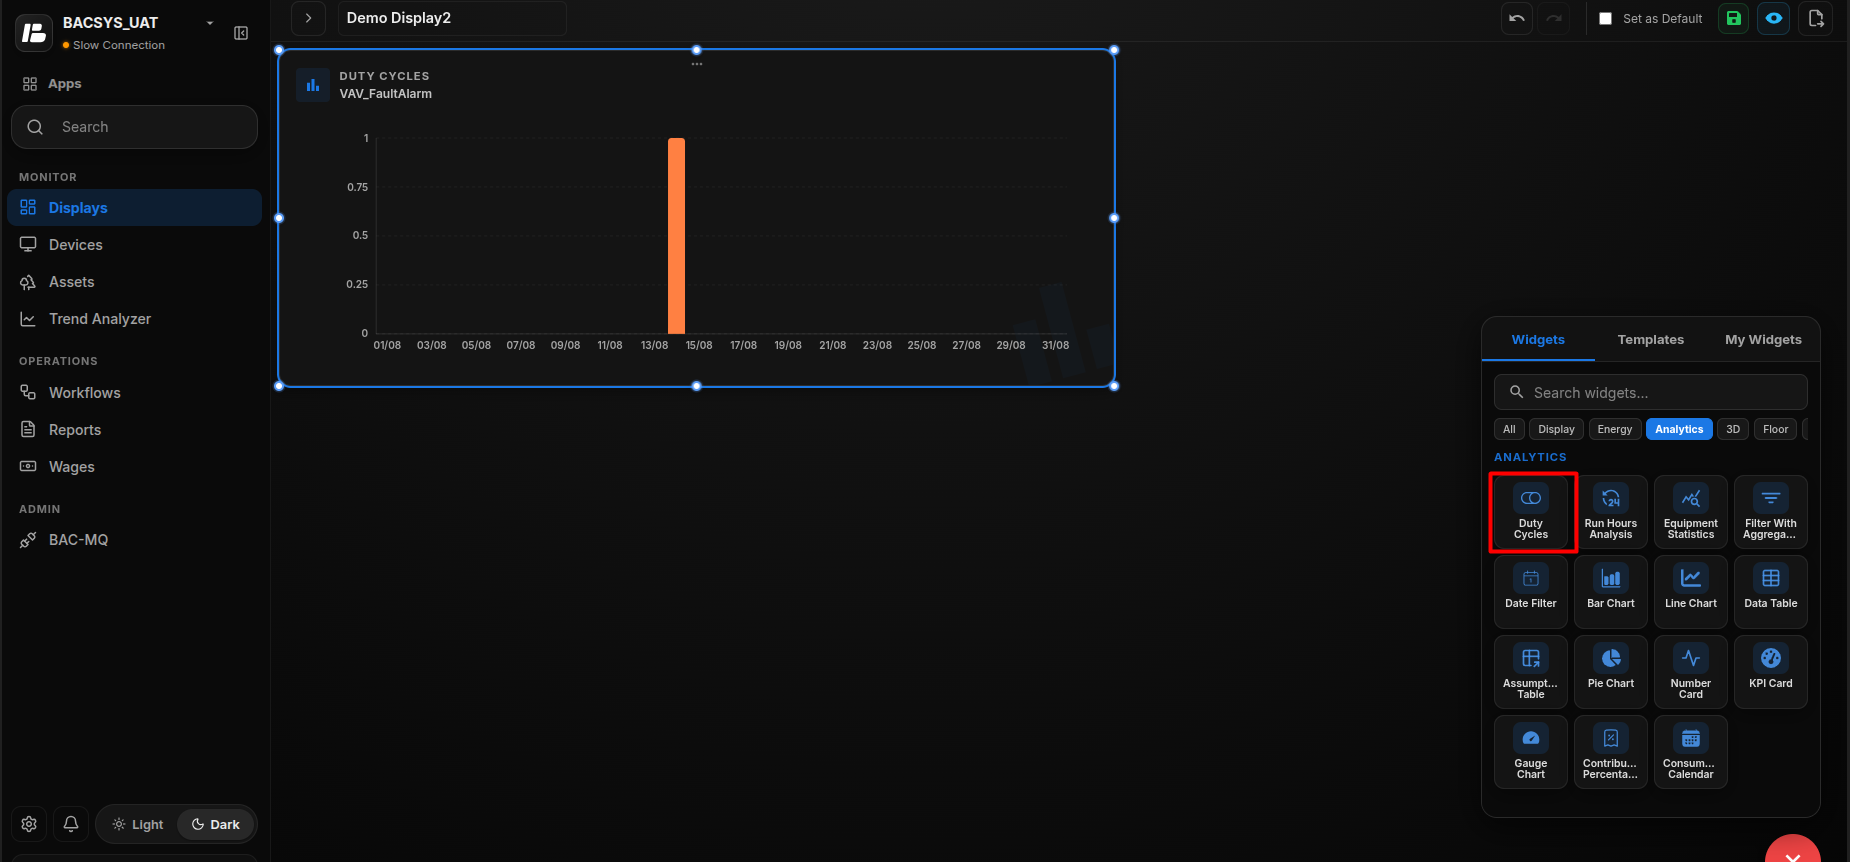 Configure Duty Cycles
Duty Cycle Analysis
After saving the configuration, the widget analyzes the selected point for the configured date and interval. It provides information about the equipment's operating cycle, including its ON/OFF behavior and runtime distribution.
Run Hours Analysis
The Run Hours Analysis widget displays the total operating hours of selected equipment based on its configured status point and a selected time interval.
Add the Run Hours Analysis Widget
- Click the + icon.
- Drag and drop the Run Hours Analysis Widget onto the display.
- Select the Run Hours Analysis Widget.
- Use Zoom In and Zoom Out to adjust the widget view.
- Click Settings to open the Configure Data panel.
- Configure the required Run Hours Analysis settings.
- Review the configured settings.
- Click Save.
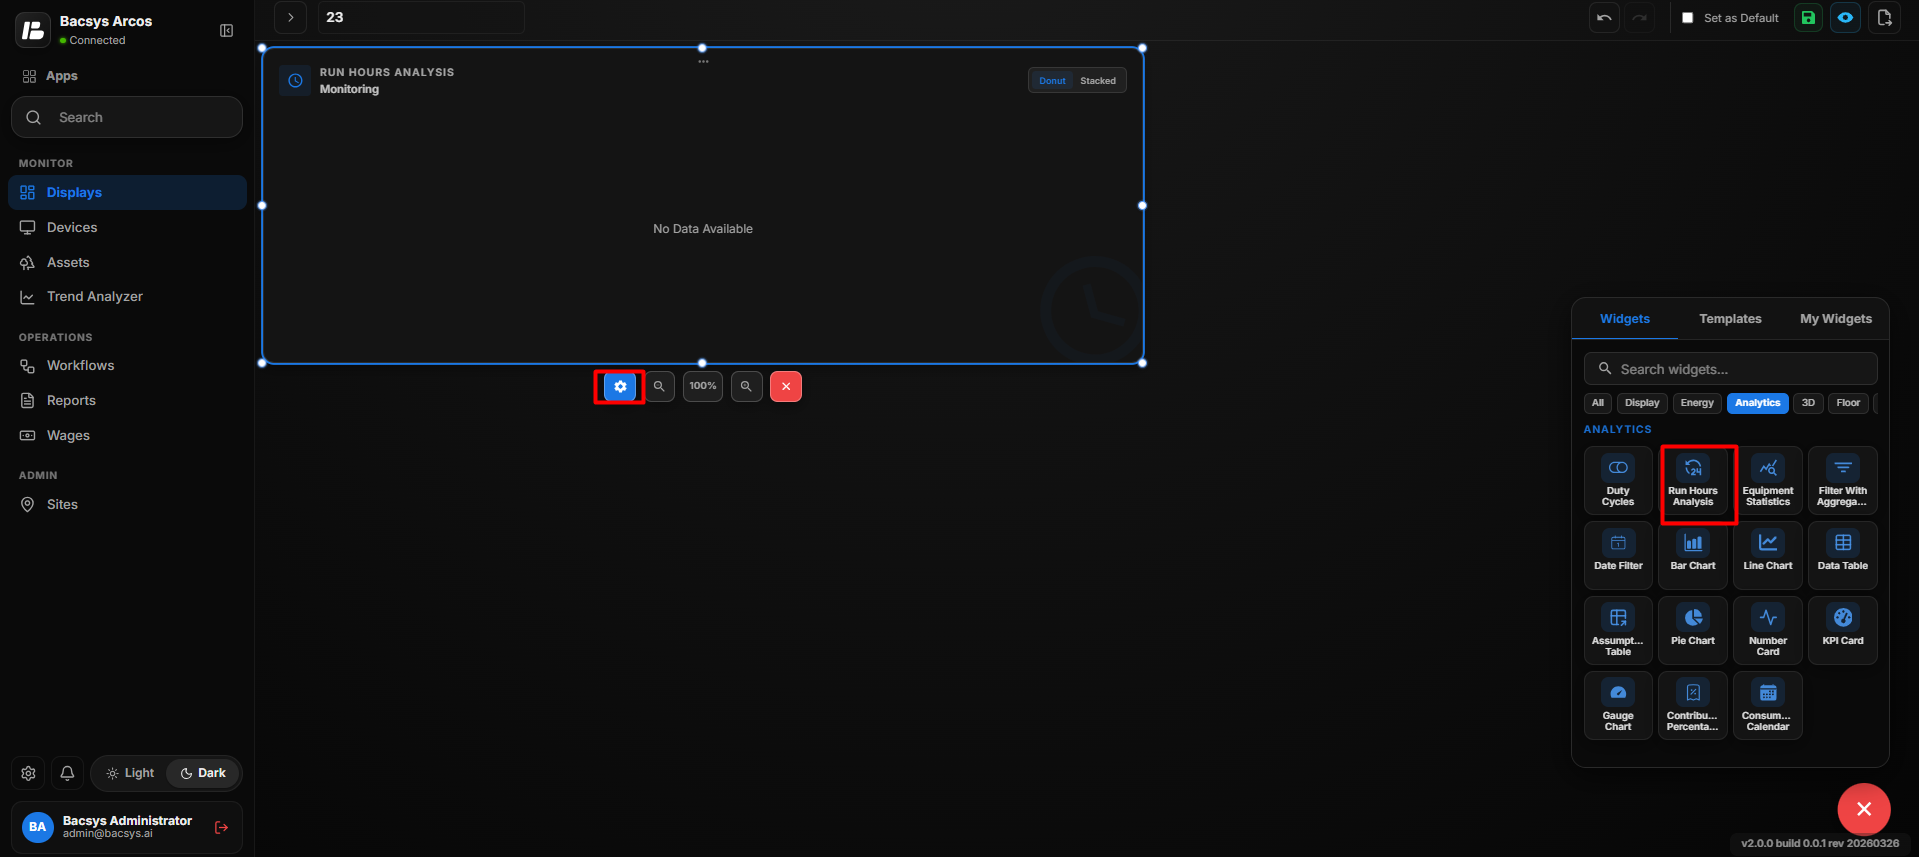 Add Run Hours Analysis
Run Hours Analysis Settings
| Option | Description |
|---|---|
| Title | Enter an optional title for the Run Hours Analysis widget. |
| Select Point | Select the point used to determine the equipment operating status. Click Browse Hierarchy to navigate through Network → Device → Point and select the required point. |
| Select Interval | Select the time interval for calculating the equipment run hours. The available interval shown is Day Wise. |
| Date | Select the date for which the equipment run hours should be calculated. |
| Show Background | Use the toggle button to show or hide the widget background. |
| Hide Header | Use the toggle button to show or hide the widget header. |
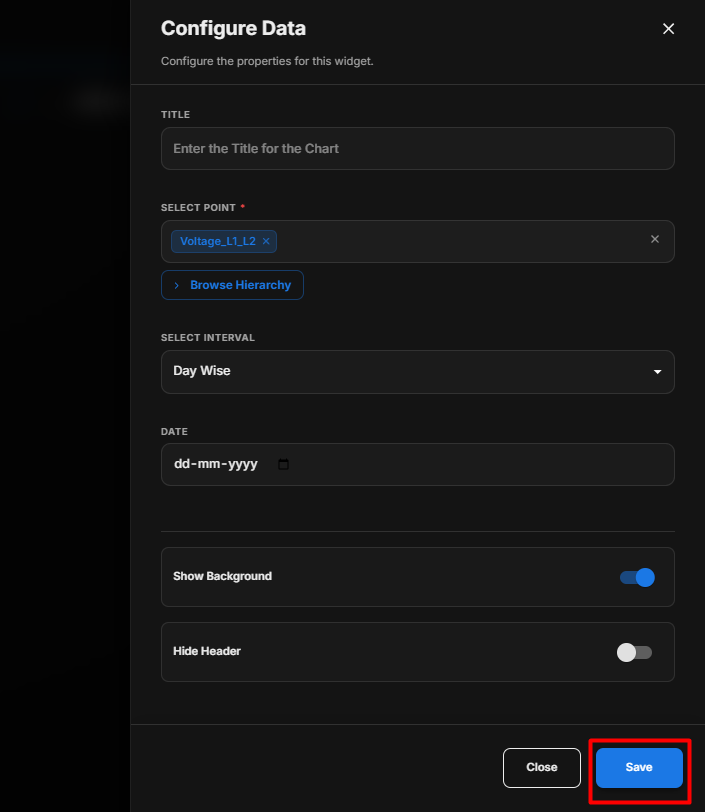 Run Hours Analysis Settings
Configure the Run Hours Analysis Widget
- Enter an optional Title.
- Under Select Point, click Browse Hierarchy.
- Navigate through Network → Device → Point.
- Select the required equipment status point.
- Under Select Interval, select the required interval.
- Select the required Date.
- Configure Show Background according to your requirement.
- Configure Hide Header according to your requirement.
- Review the configured settings.
- Click Save.
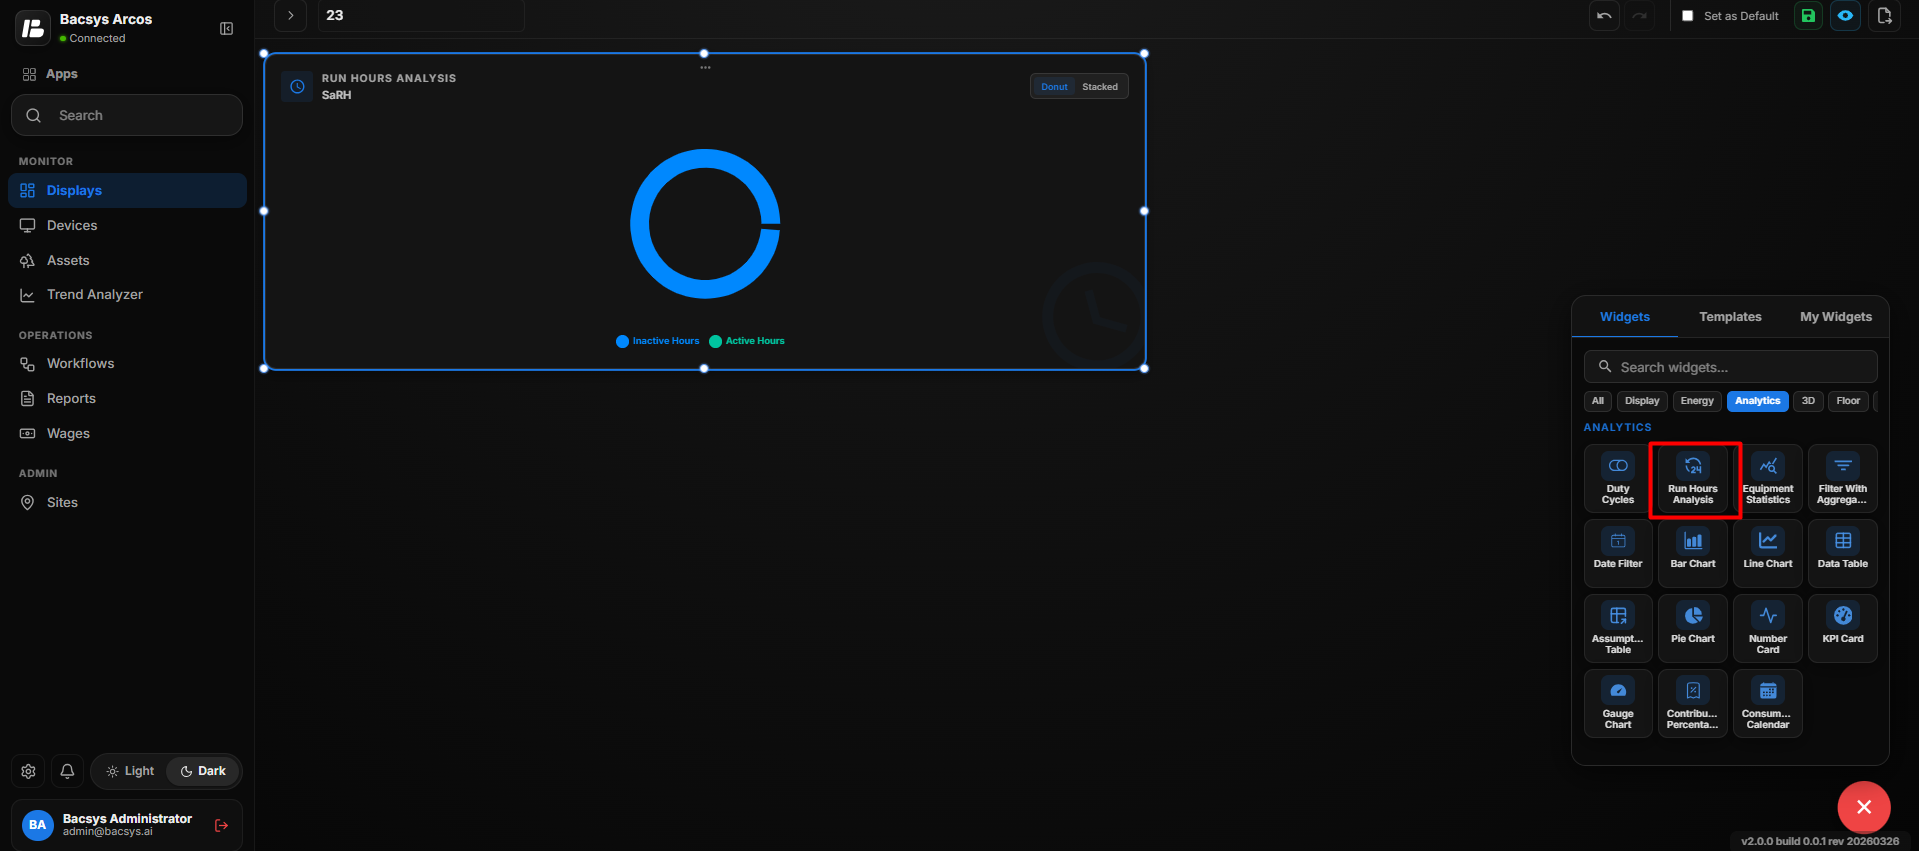 Configure Run Hours Analysis
Run Hours Calculation
After saving the configuration, the widget uses the selected point to determine the equipment's operating periods and calculates the total run hours for the selected date and interval.
Equipment Statistics
The Equipment Statistics widget provides statistical information for a selected equipment point over a specified time interval and date.
Add the Equipment Statistics Widget
- Click the + icon.
- Drag and drop the Equipment Statistics Widget onto the display.
- Select the Equipment Statistics Widget.
- Use Zoom In and Zoom Out to adjust the widget view.
- Click Settings to open the Configure Data panel.
- Configure the required Equipment Statistics settings.
- Review the configured settings.
- Click Save.
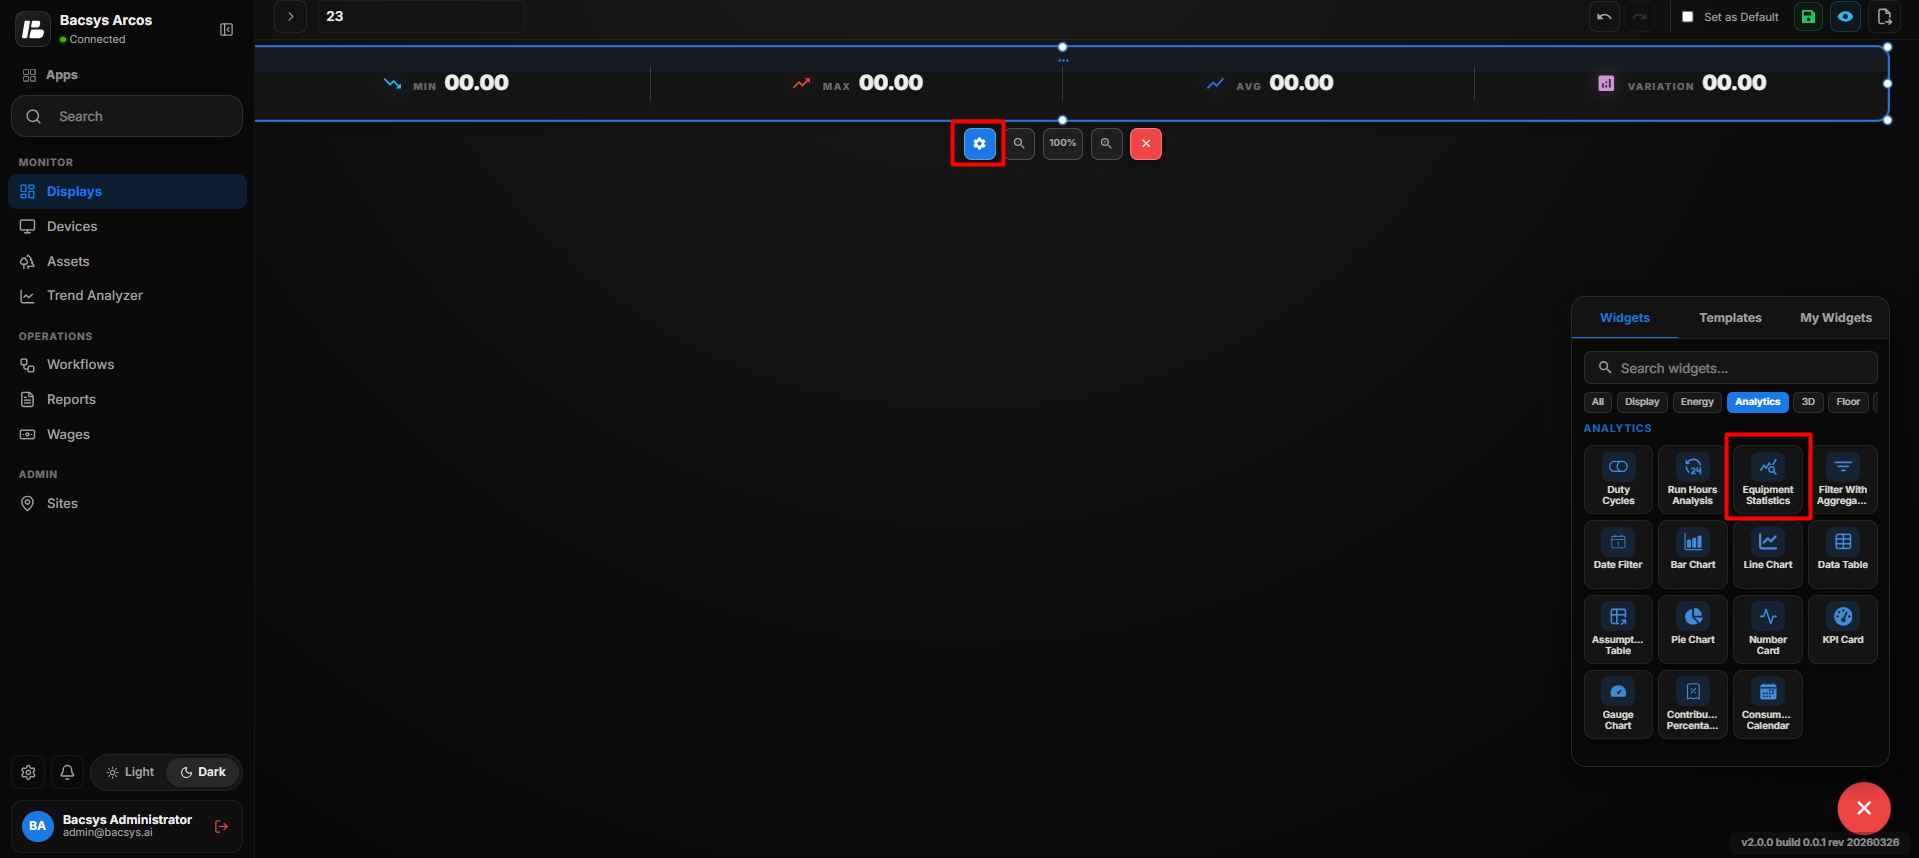 Add Equipment Statistics
Equipment Statistics Settings
| Option | Description |
|---|---|
| Title | Enter an optional title for the Equipment Statistics widget. |
| Select Point | Select the point for which the equipment statistics should be calculated. Click Browse Hierarchy to navigate through Network → Device → Point and select the required point. |
| Select Interval | Select the time interval used for the statistical analysis. The available interval shown is Day Wise. |
| Date | Select the date for which the equipment statistics should be calculated. |
| Show Background | Use the toggle button to show or hide the widget background. |
| Hide Header | Use the toggle button to show or hide the widget header. |
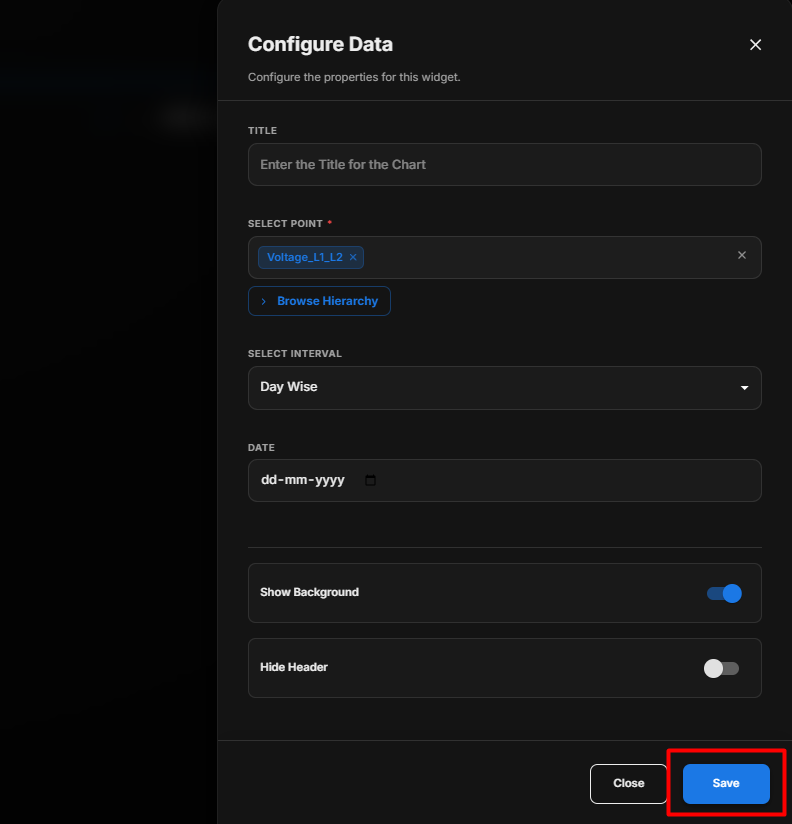 Equipment Statistics Settings
Configure the Equipment Statistics Widget
- Enter an optional Title.
- Under Select Point, click Browse Hierarchy.
- Navigate through Network → Device → Point.
- Select the required equipment point.
- Under Select Interval, select the required interval.
- Select the required Date.
- Configure Show Background according to your requirement.
- Configure Hide Header according to your requirement.
- Review the configured settings.
- Click Save.
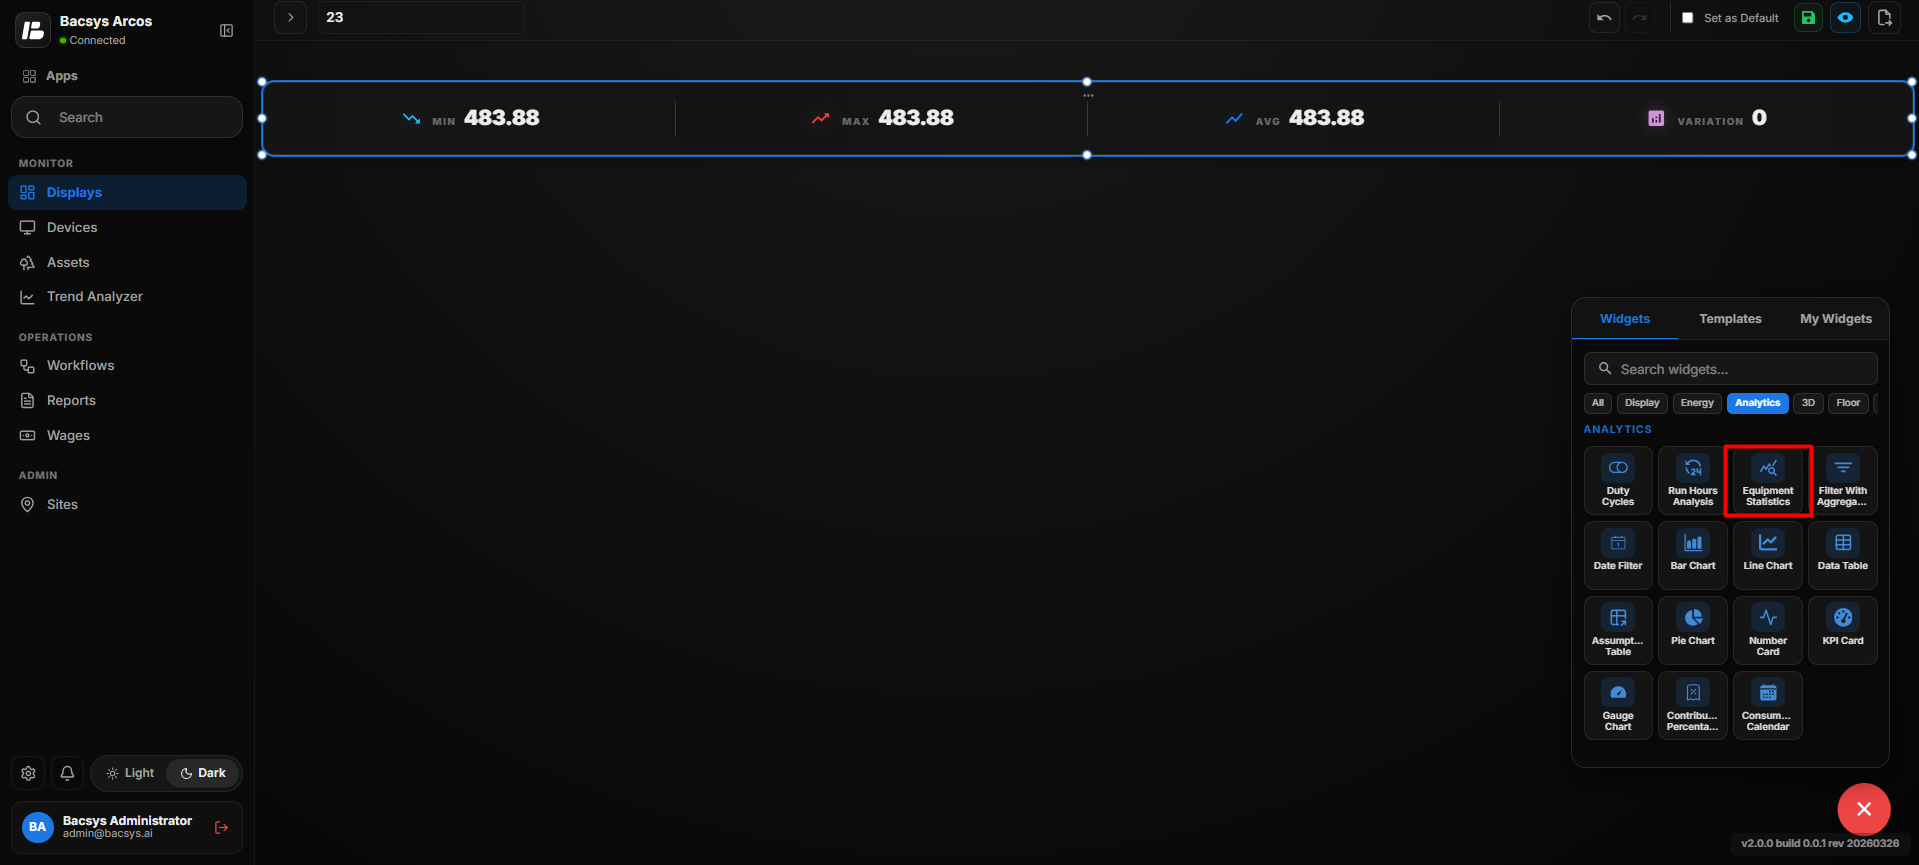 Configure Equipment Statistics
Equipment Statistics Analysis
After saving the configuration, the widget analyzes the selected point for the configured date and interval and displays the corresponding statistical information, such as minimum, maximum, average, and total values, where applicable.
Filter with Aggregation
The Filter with Aggregation widget allows users to filter data for a selected point based on a specific time interval and apply different aggregation methods to analyze the data.
Add the Filter with Aggregation Widget
- Click the + icon.
- Drag and drop the Filter with Aggregation Widget onto the display.
- Select the Filter with Aggregation Widget.
- Use Zoom In and Zoom Out to adjust the widget view.
- Click Settings to open the Configure Data panel.
- Configure the required Filter with Aggregation settings.
- Review the configured settings.
- Click Save.
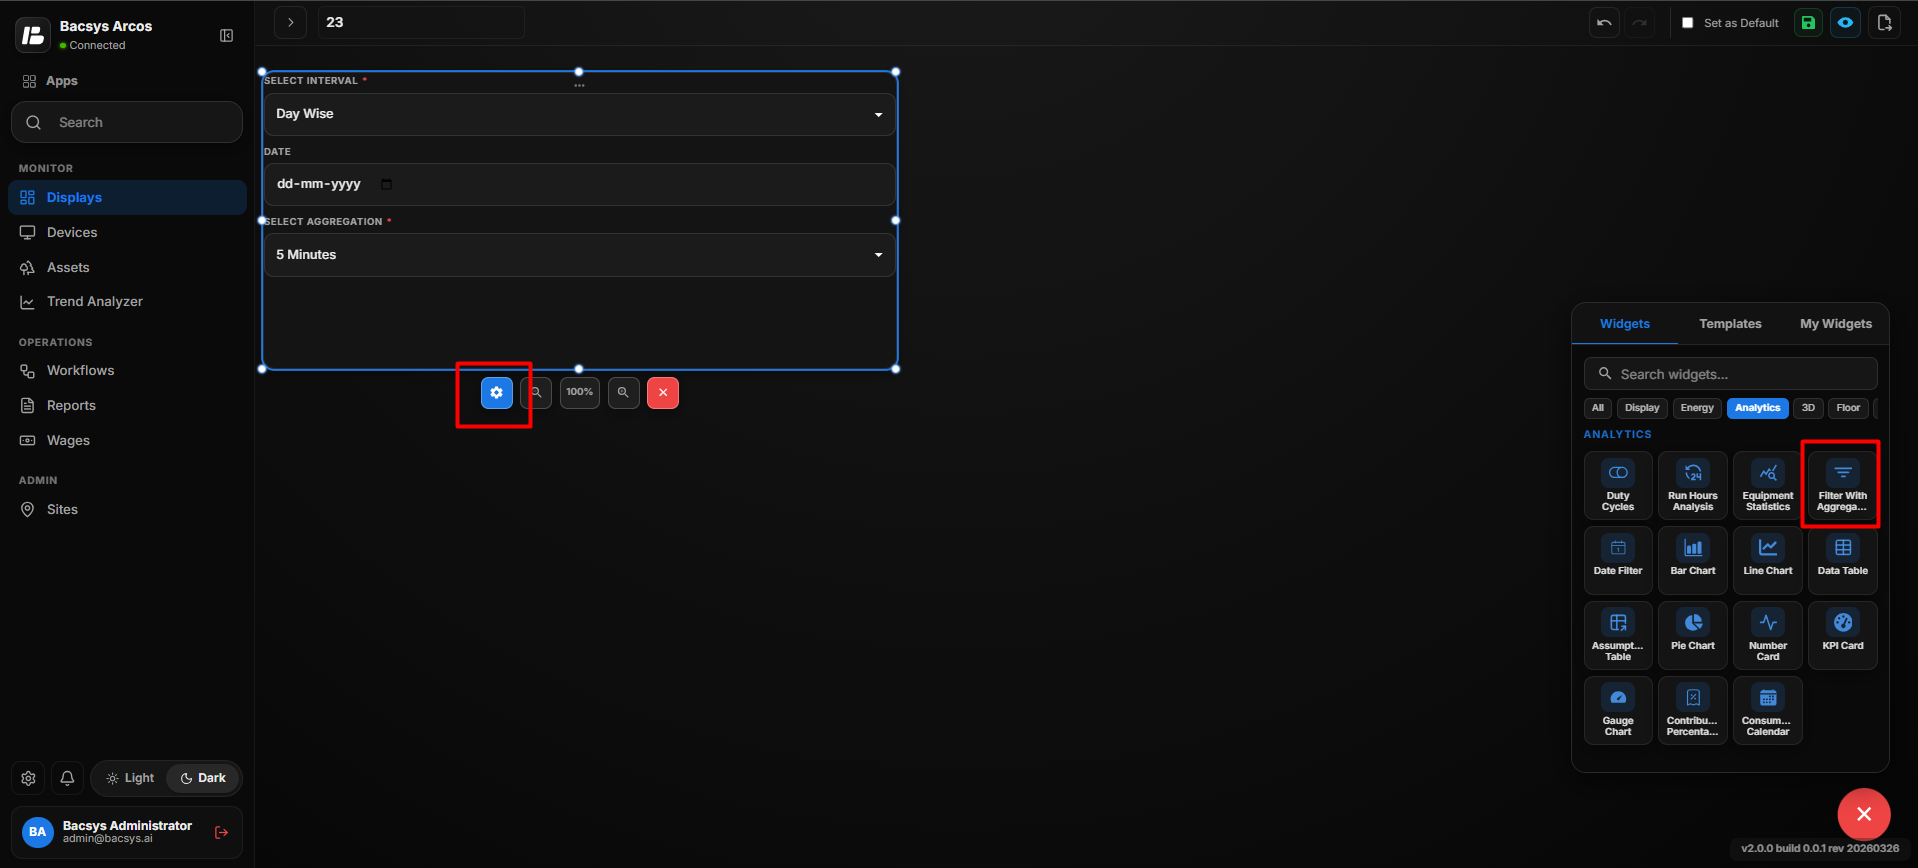 Add Filter with Aggregation
Filter with Aggregation Settings
| Option | Description |
|---|---|
| Title | Enter an optional title for the Filter with Aggregation widget. |
| Subtitle | Enter an optional subtitle for the widget. |
| Select Point | Select the point for which the data should be filtered and aggregated. Click Browse Hierarchy to navigate through Network → Device → Point. |
| Select Interval | Select the time period for filtering the data. Available options include Week Wise, Date Wise, and Month Wise. |
| Date | Select the required date or date range based on the selected interval. |
| Select Aggregation | Select the aggregation period to group the data. Available options include 5 Min, 15 Min, 1 Hour, 1 Day, 1 Week, and 1 Month. |
| Poll Frequency (Seconds) | Specifies how frequently the widget refreshes its data. |
| Show Background | Use the toggle button to show or hide the widget background. |
| Hide Header | Use the toggle button to show or hide the widget header. |

Configure the Filter with Aggregation Widget
- Enter an optional Title.
- Enter an optional Subtitle.
- Under Select Point, click Browse Hierarchy.
- Navigate through Network → Device → Point.
- Select the required point.
- Under Select Interval, select the required interval:
- Week Wise
- Date Wise
- Month Wise
- Select the required Date or date range.
- Under Select Aggregation, select the required aggregation period:
- 5 Min
- 15 Min
- 1 Hour
- 1 Day
- 1 Week
- 1 Month
- Configure Poll Frequency (Seconds) if available.
- Configure Show Background according to your requirement.
- Configure Hide Header according to your requirement.
- Review the configured settings.
- Click Save.
Data Aggregation
The selected aggregation period determines how the filtered data is grouped for analysis.
| Aggregation | Description |
|---|---|
| 5 Min | Groups data into 5-minute intervals. |
| 15 Min | Groups data into 15-minute intervals. |
| 1 Hour | Groups data into hourly intervals. |
| 1 Day | Groups data into daily intervals. |
| 1 Week | Groups data into weekly intervals. |
| 1 Month | Groups data into monthly intervals. |
Widget Display
After saving the configuration, the widget displays the filtered and aggregated data according to the selected point, interval, date, and aggregation period.
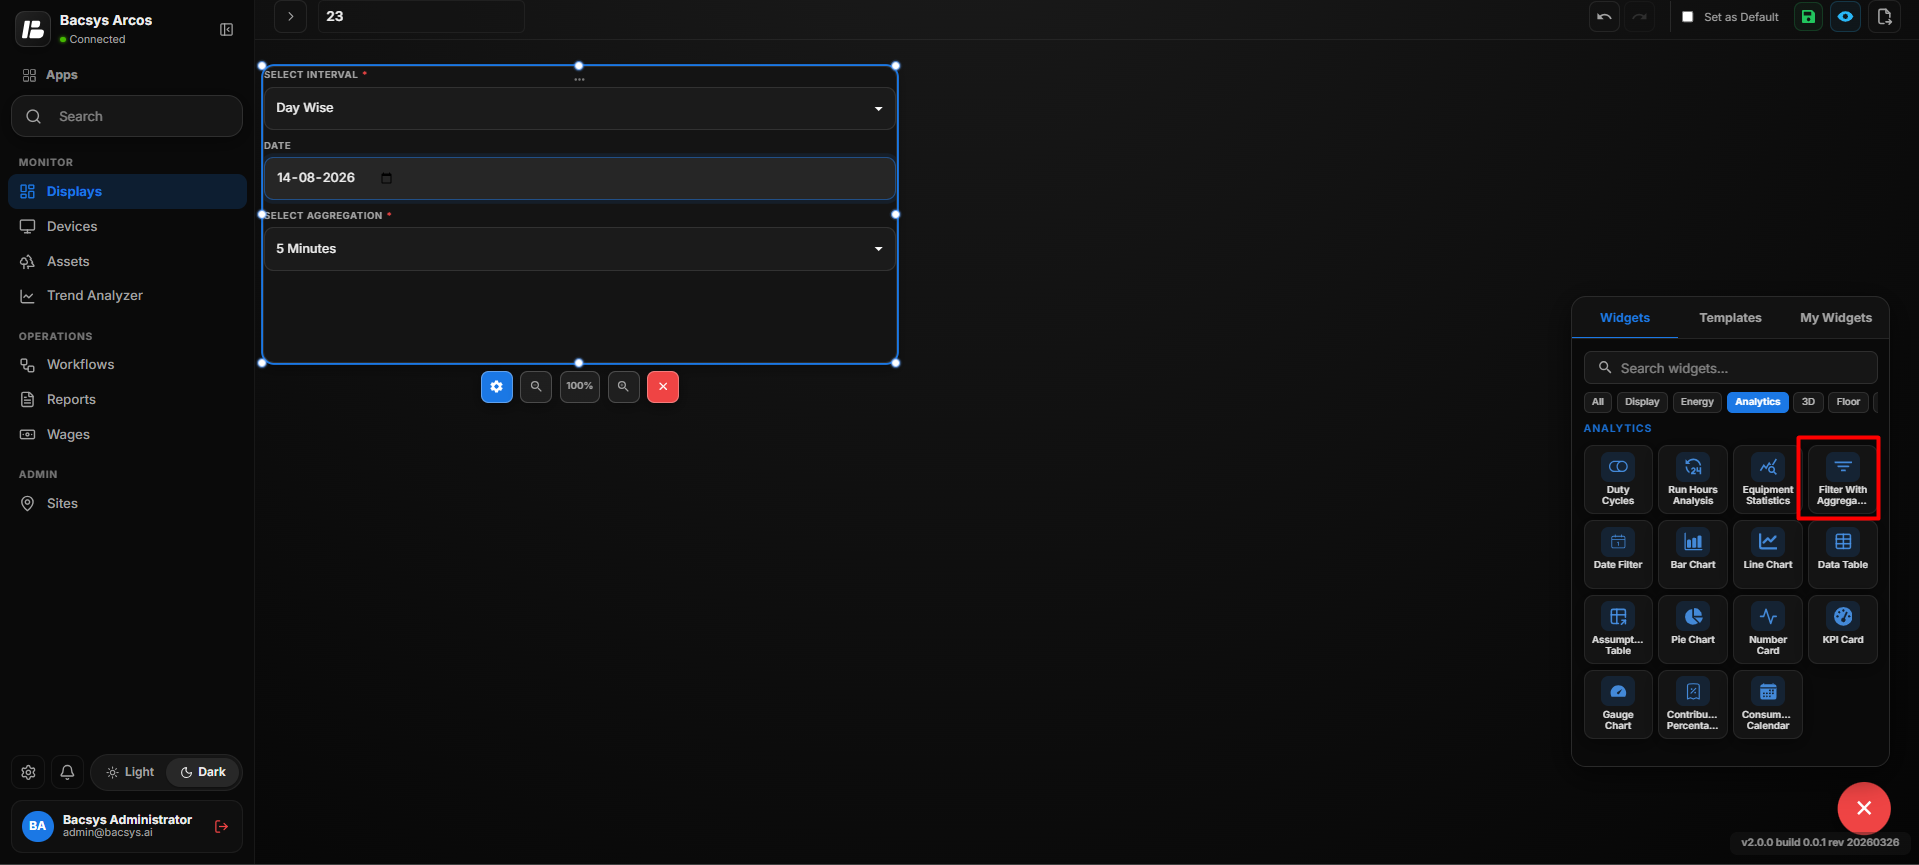 Filter with Aggregation Settings
Note: If the widget is arranged or resized to occupy the full available display area, the widget can expand to fill the display.
Date Filter
The Date Filter widget allows users to select a time interval and date range that can be applied to the display. When the filter is applied, the selected date range updates the data displayed across the widgets on the display.
Add the Date Filter Widget
- Click the + icon.
- Drag and drop the Date Filter Widget onto the display.
- Select the Date Filter Widget.
- Use Zoom In and Zoom Out to adjust the widget view.
- Configure the required date filter settings.
- Select the required interval and dates.
- Click Apply to apply the selected date range.
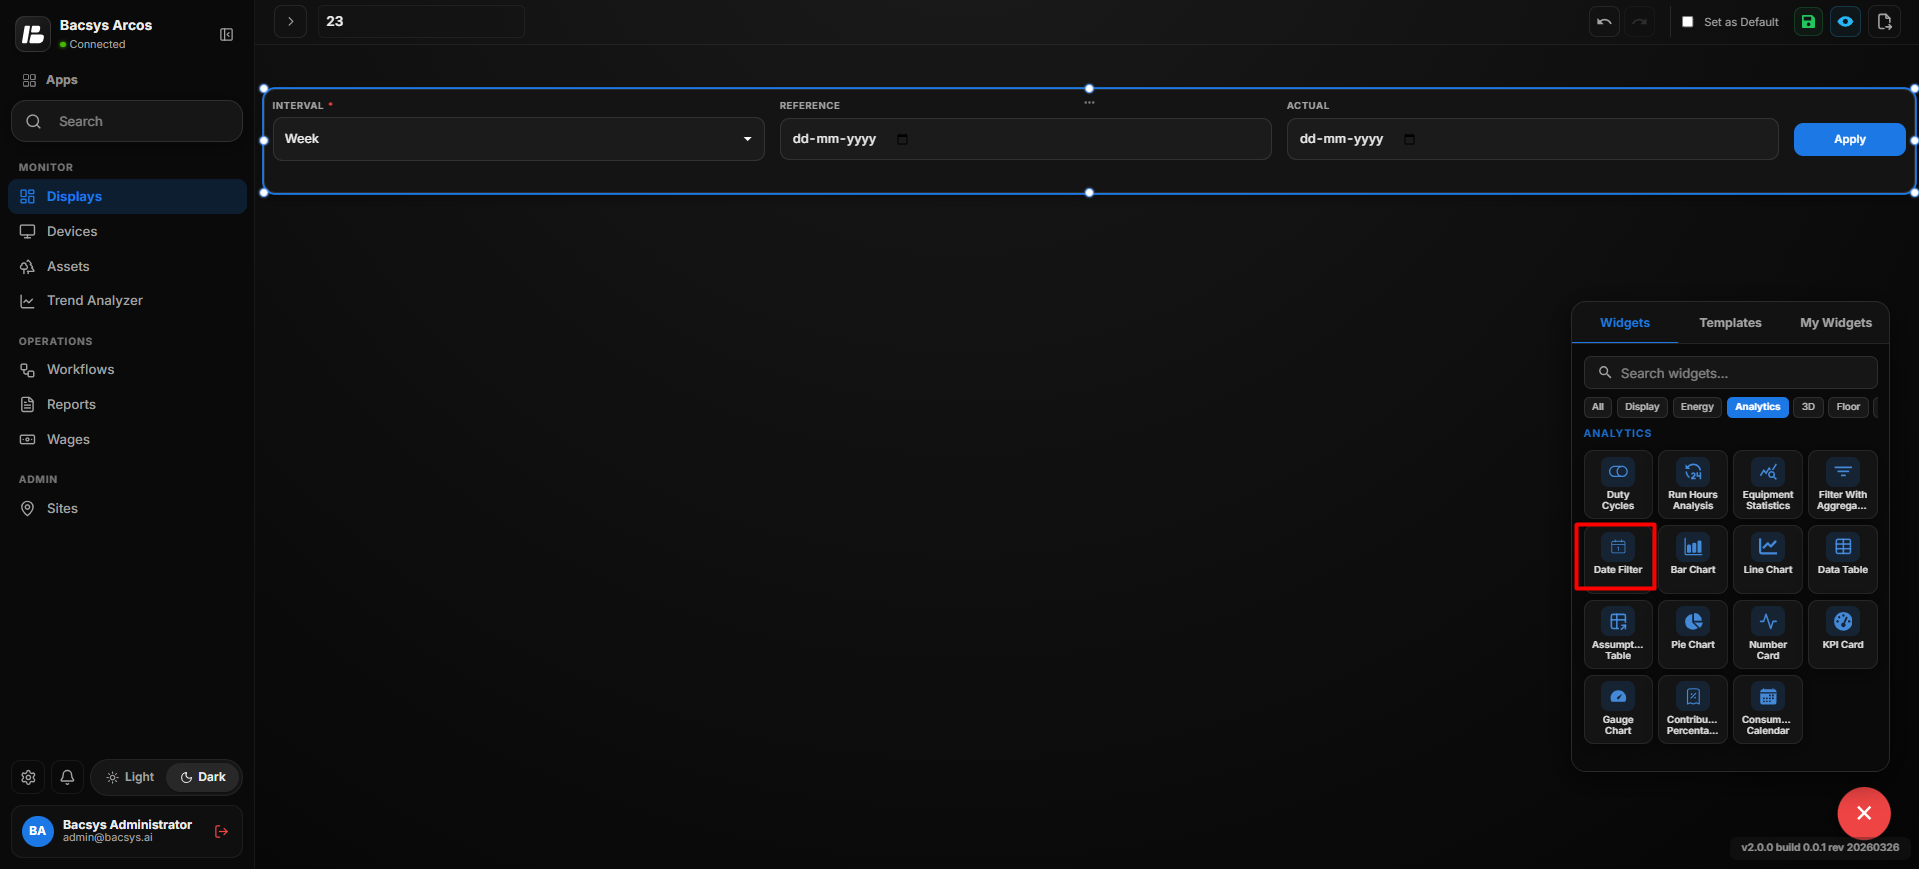 Add Date Filter
Date Filter Options
| Option | Description |
|---|---|
| Interval | Select the time period for filtering the display data. |
| Reference | Select the reference date used for the selected interval. |
| Actual | Select the actual date used for the selected interval. |
| Apply | Applies the selected interval and dates to the display. |
Configure the Date Filter
- Under Interval, select the required interval, such as Week.
- Select the required Reference date.
- Select the required Actual date.
- Review the selected date range.
- Click Apply.
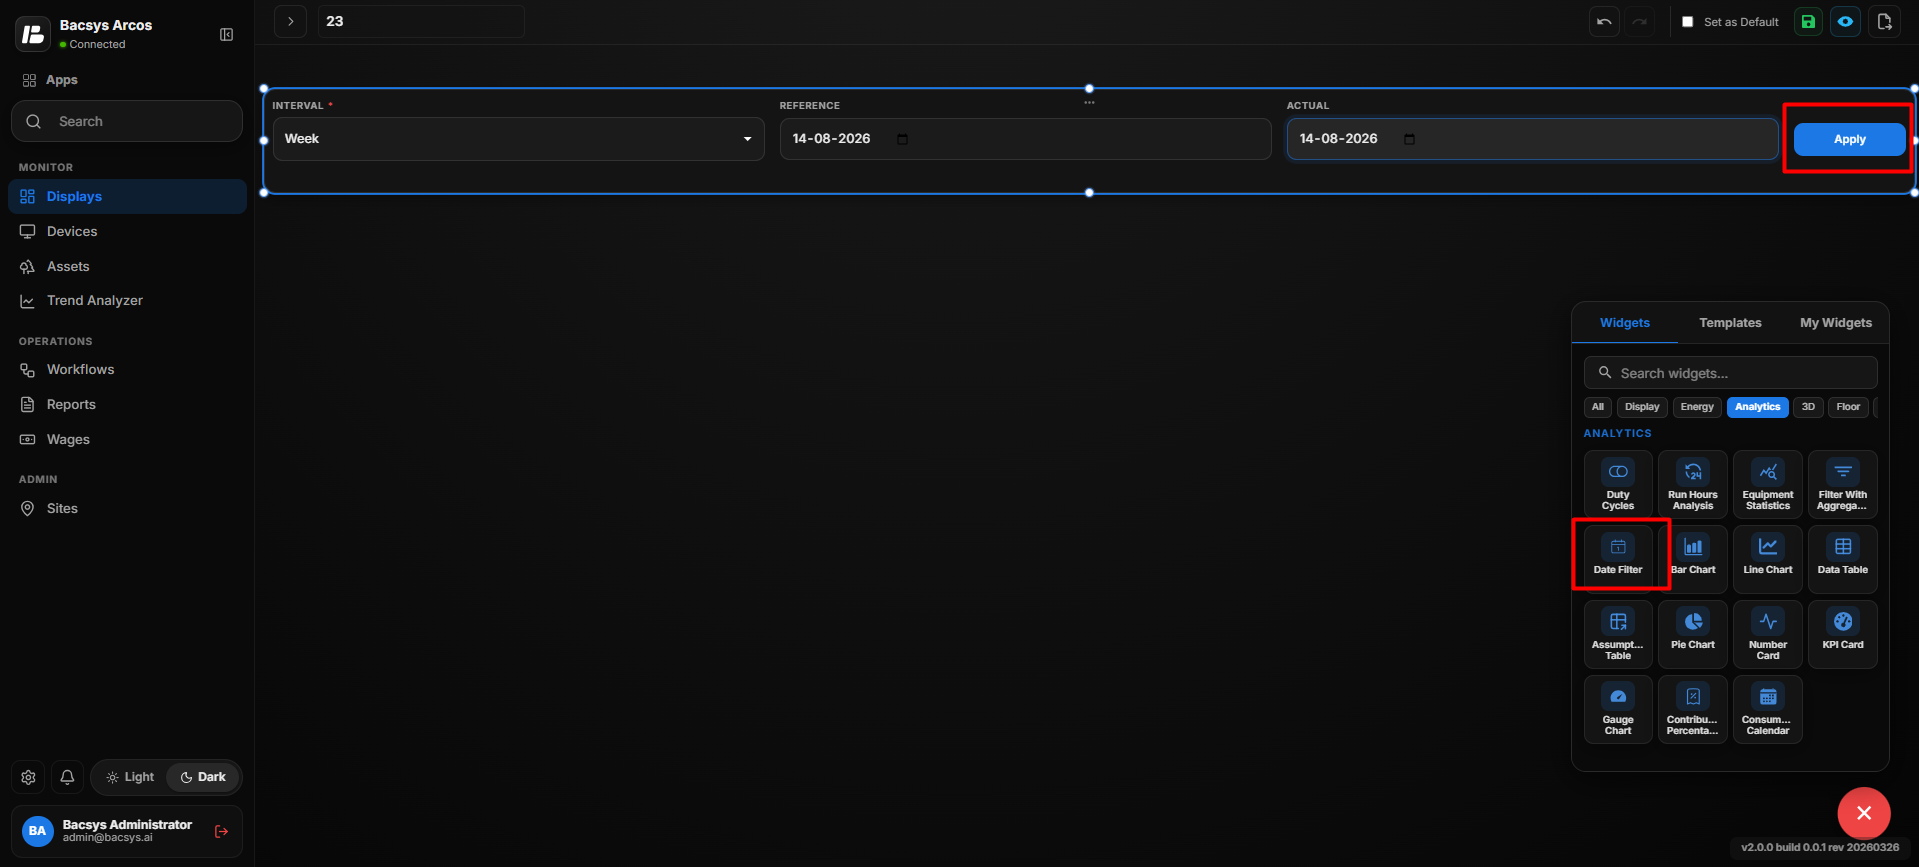 Date Filter Settings
Apply the Date Filter
After clicking Apply, the selected date range is applied to the entire display.
The widgets that use date-based or historical data will refresh their displayed data according to the selected filter.
Note: The Date Filter acts as a common display-level filter. Changing the interval or dates and clicking Apply updates the applicable widgets across the display.
Bar Chart
The Bar Chart widget visualizes and compares data from selected points using bars. It allows users to compare point consumption or other values based on a selected comparison period.
Add the Bar Chart Widget
- Click the + icon.
- Drag and drop the Bar Chart Widget onto the display.
- Select the Bar Chart Widget.
- Use Zoom In and Zoom Out to adjust the widget view.
- Click Settings to open the Configure Data panel.
- Configure the required Bar Chart settings.
- Review the configured settings.
- Click Save.
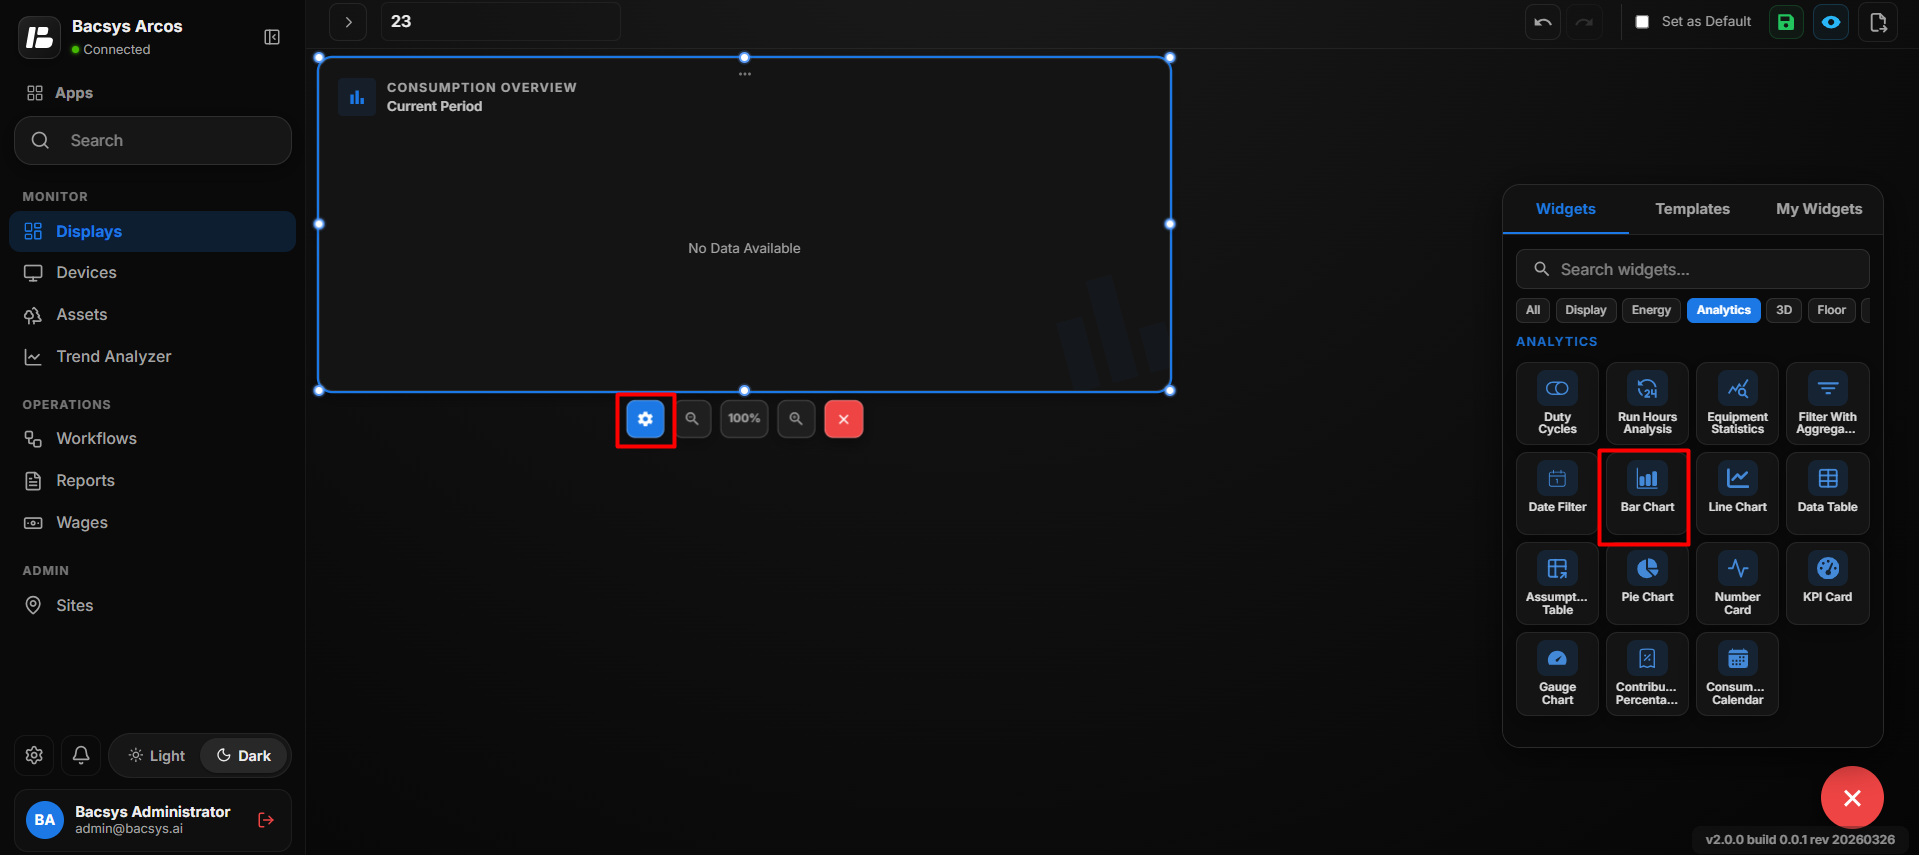 Add Bar Chart
Bar Chart Settings
| Option | Description |
|---|---|
| Title | Enter an optional title for the Bar Chart widget. |
| Select Point | Select one or more points to be displayed in the bar chart. Click Browse Hierarchy to navigate through Network → Device → Point and select the required points. |
| Compare As | Select how the selected point data should be compared. The available option shown is Day. |
| Reference | Select the reference date used for comparison. |
| Actual | Select the actual date used for comparison. |
| Overall Point Consumption | Enable this option to display the overall consumption of the selected points. |
| Represent As | Select the required calculation or representation method for the selected data. |
| Show Background | Use the toggle button to show or hide the widget background. |
| Hide Header | Use the toggle button to show or hide the widget header. |
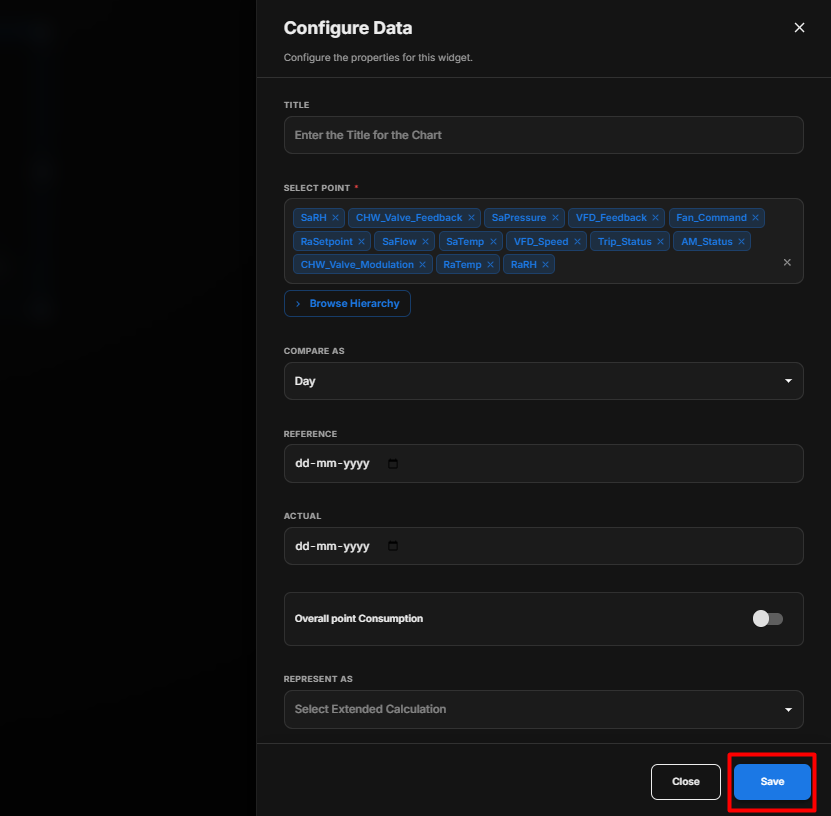 Bar Chart Settings
Configure the Bar Chart
- Enter an optional Title.
- Under Select Point, click Browse Hierarchy.
- Navigate through Network → Device → Point.
- Select the required points.
- Under Compare As, select the required comparison period.
- Select the Reference date.
- Select the Actual date.
- Enable Overall Point Consumption if required.
- Under Represent As, select the required calculation or representation.
- Configure Show Background according to your requirement.
- Configure Hide Header according to your requirement.
- Review the configured settings.
- Click Save.
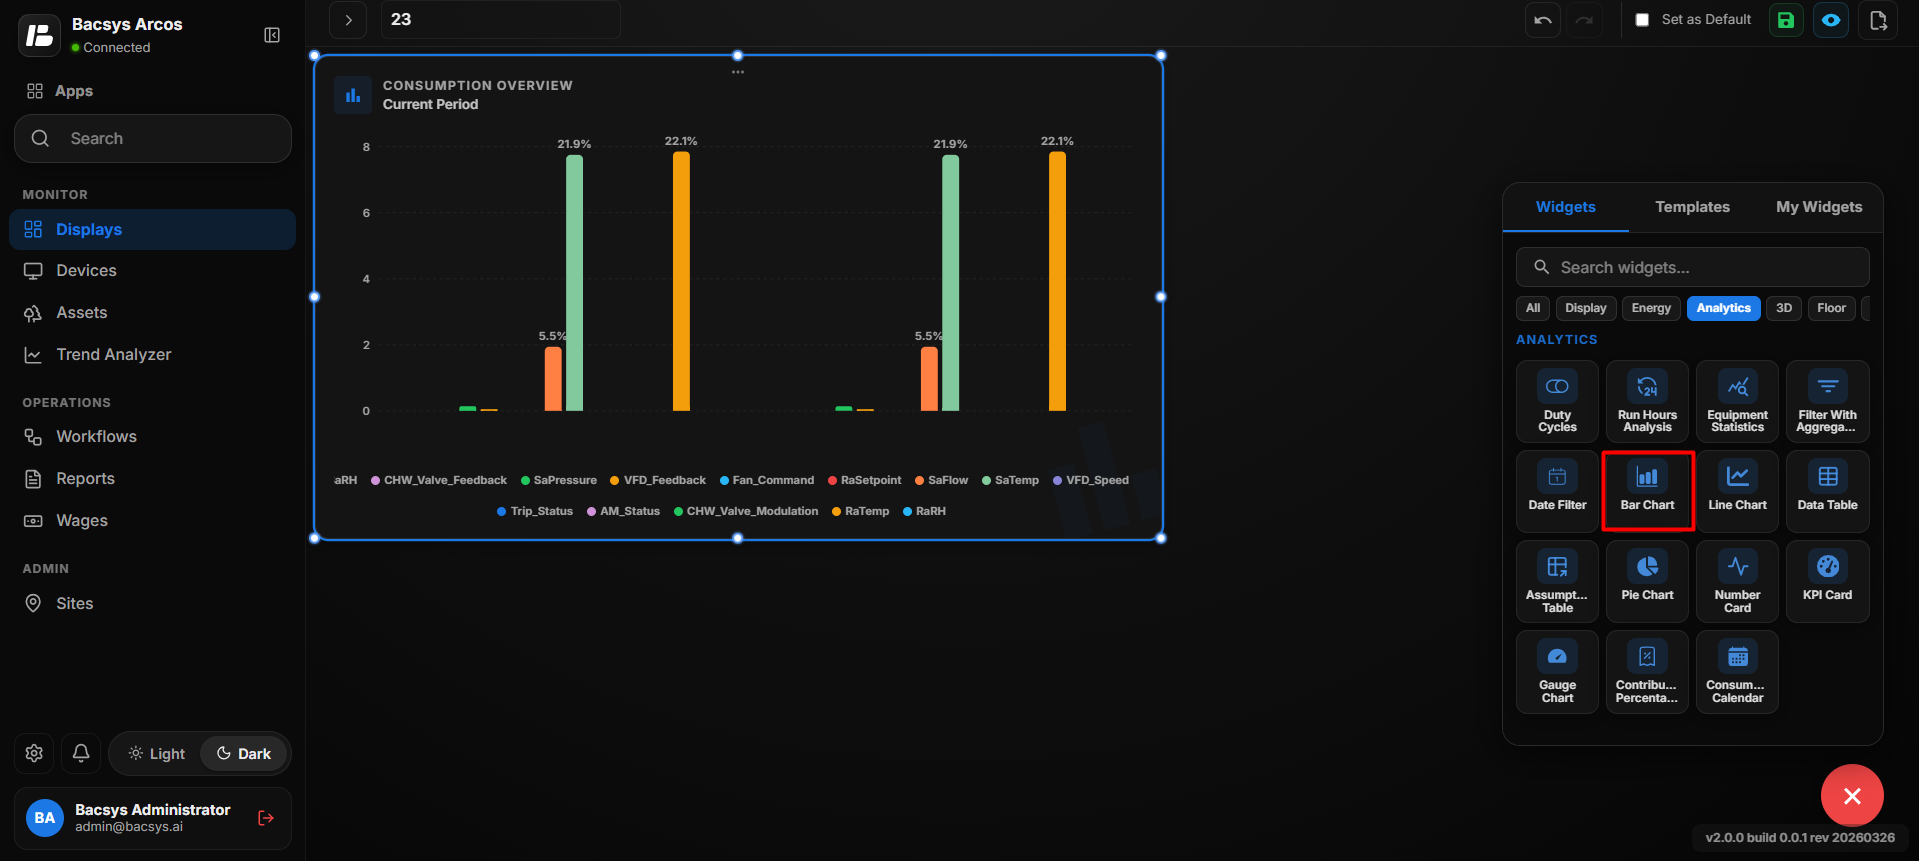 Configure Bar Chart
Bar Chart Comparison
After saving the configuration, the widget displays the selected points as bars and compares the data according to the configured comparison period, reference date, actual date, and representation method.
The Bar Chart can be used to visually compare consumption or other selected point values across the configured periods.
Line Chart
The Line Chart widget visualizes data points using lines, allowing users to compare values and identify trends across selected time periods.
Add the Line Chart Widget
- Click the + icon.
- Drag and drop the Line Chart Widget onto the display.
- Select the Line Chart Widget.
- Use Zoom In and Zoom Out to adjust the widget view.
- Click Settings to open the Configure Data panel.
- Configure the required Line Chart settings.
- Review the configured settings.
- Click Save.
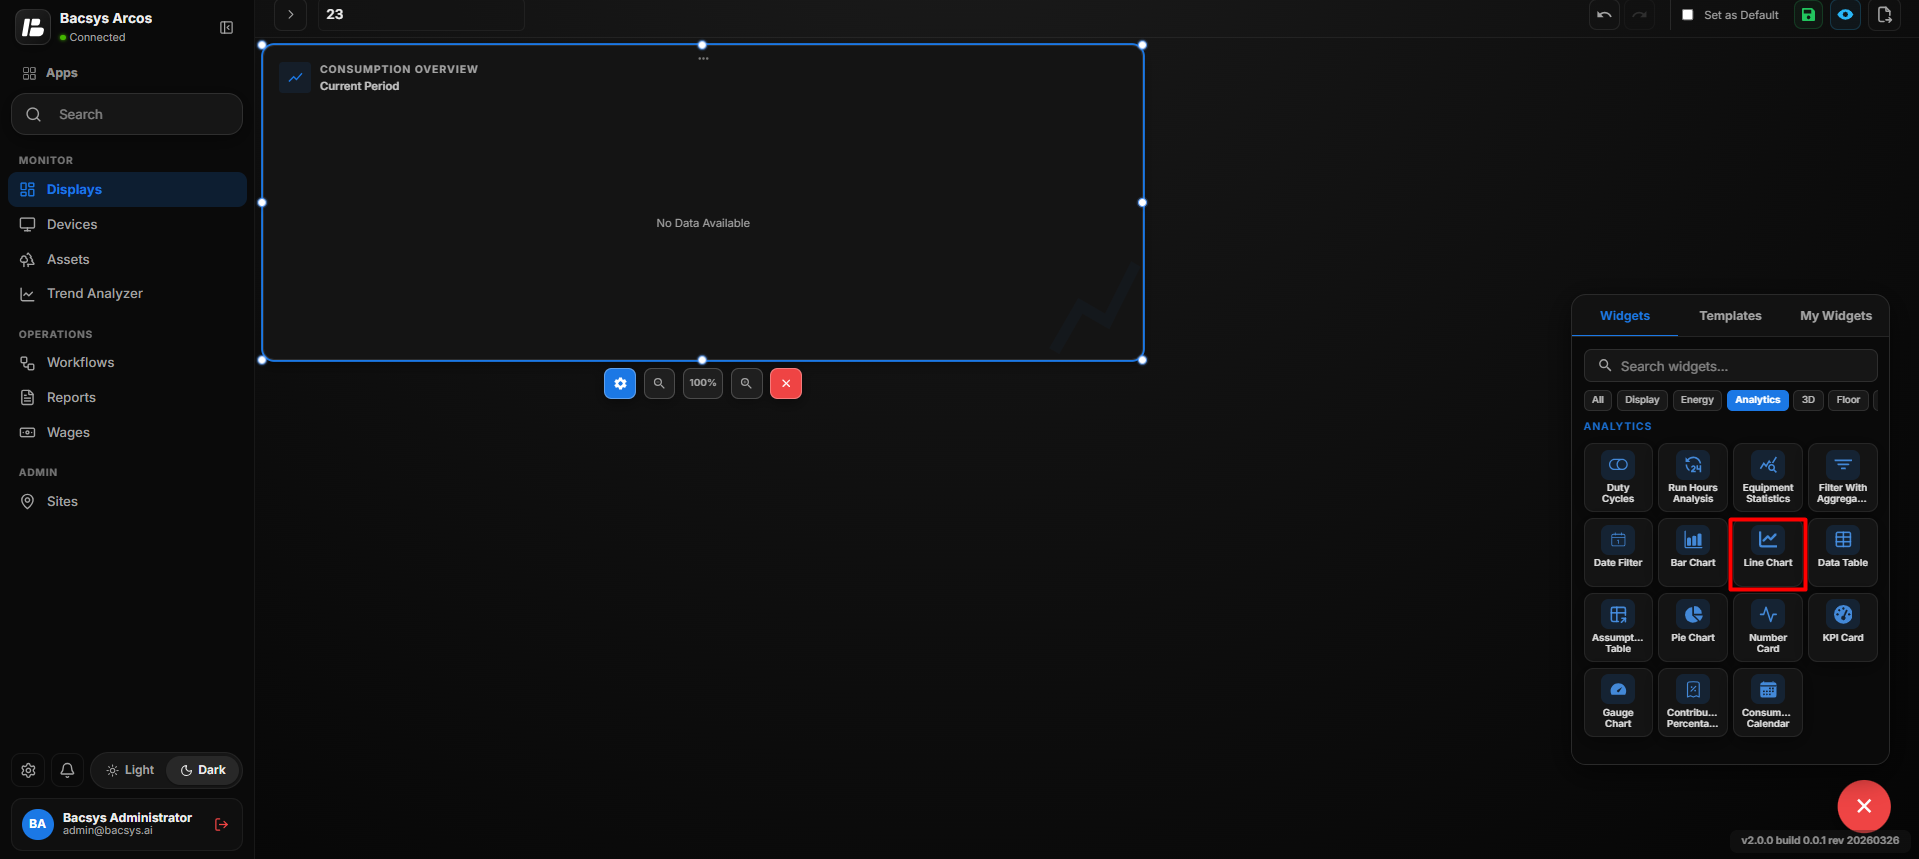 Add Line Chart
Line Chart Settings
| Option | Description |
|---|---|
| Title | Enter an optional title for the Line Chart widget. |
| Select Point | Select the point to be displayed in the line chart. Click Browse Hierarchy to navigate through Network → Device → Point and select the required point. |
| Compare As | Select the period used to compare the selected point data. The available option shown is Day. |
| Reference | Select the reference date used for comparison. |
| Actual | Select the actual date used for comparison. |
| Overall Point Consumption | Enable this option to display the overall consumption of the selected point. |
| Represent As | Select the required calculation or representation method for the selected data. |
| Show Background | Use the toggle button to show or hide the widget background. |
| Hide Header | Use the toggle button to show or hide the widget header. |
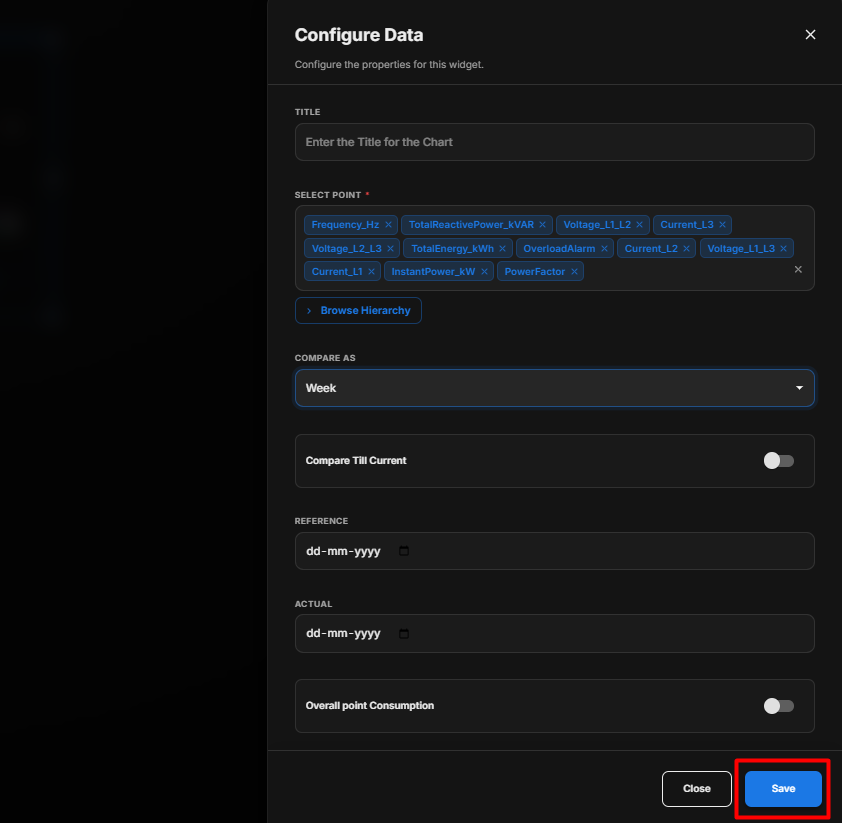
Configure the Line Chart
- Enter an optional Title.
- Under Select Point, click Browse Hierarchy.
- Navigate through Network → Device → Point.
- Select the required point.
- Under Compare As, select the required comparison period.
- Select the Reference date.
- Select the Actual date.
- Enable Overall Point Consumption if required.
- Under Represent As, select the required calculation or representation.
- Configure Show Background according to your requirement.
- Configure Hide Header according to your requirement.
- Review the configured settings.
- Click Save.
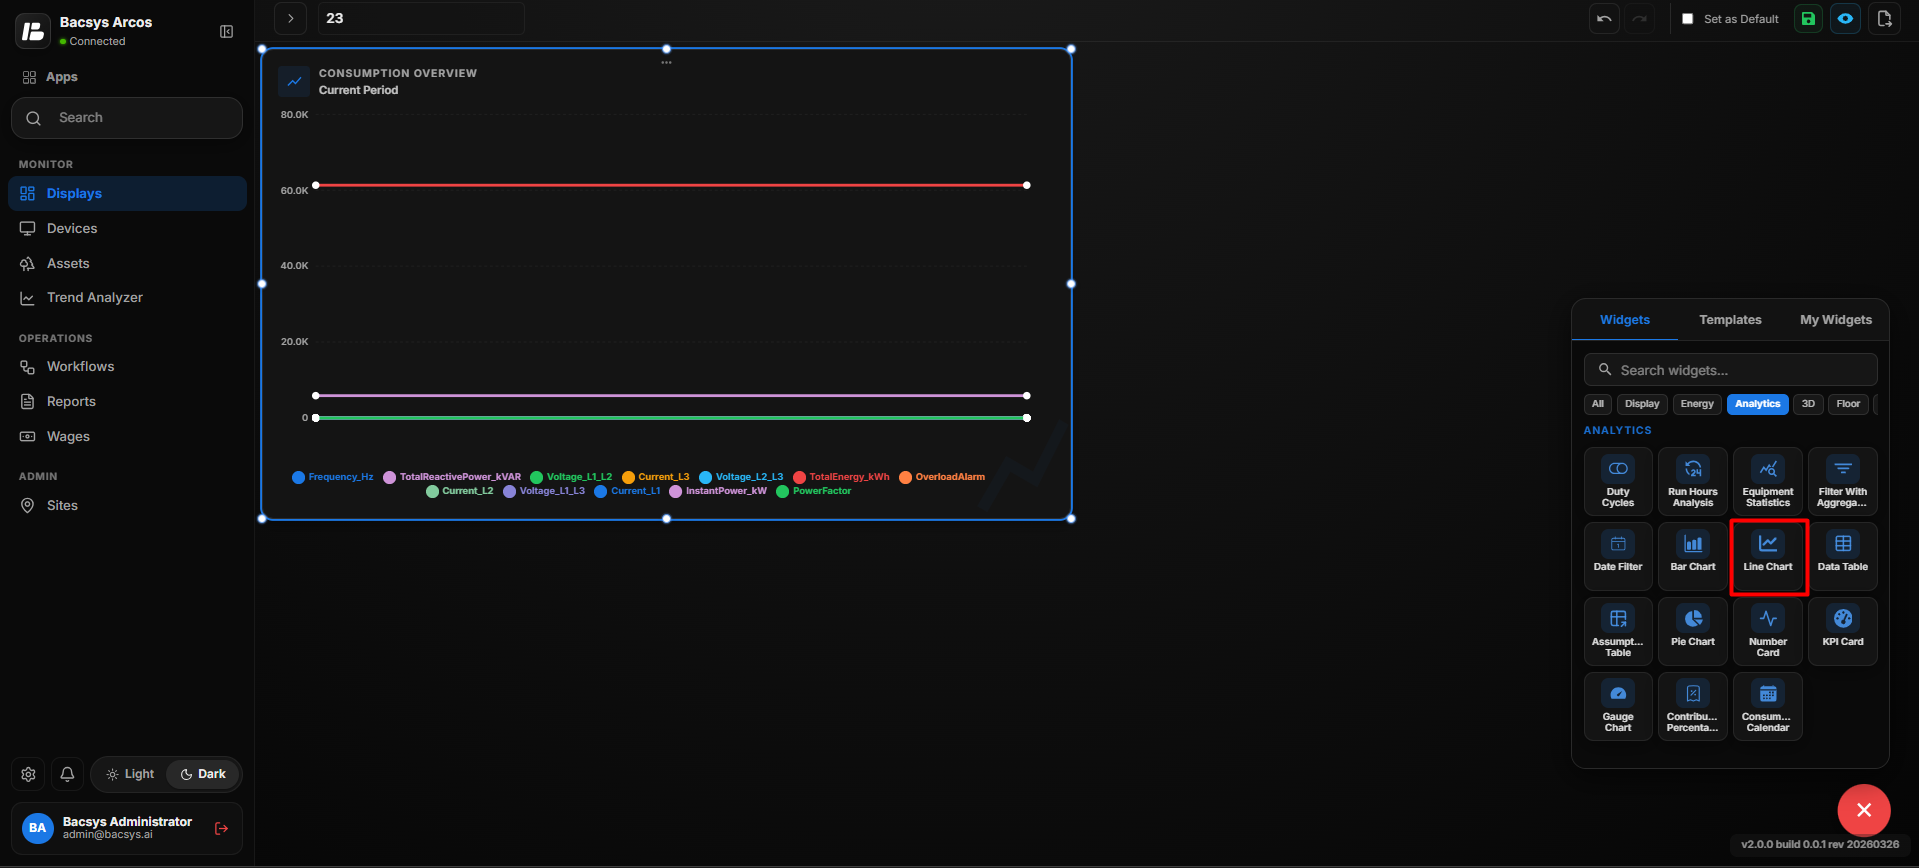
Line Chart Comparison
After saving the configuration, the widget displays the selected point as a line chart and compares the data according to the configured comparison period, reference date, actual date, and representation method.
The Line Chart can be used to identify data trends, consumption patterns, and changes over the selected comparison periods.
Data Table
The Data Table widget displays selected point data in a structured table format. It allows users to compare data based on selected dates and comparison periods and provides additional fields for displaying points and delta information.
Add the Data Table Widget
- Click the + icon.
- Drag and drop the Data Table Widget onto the display.
- Select the Data Table Widget.
- Use Zoom In and Zoom Out to adjust the widget view.
- Click Settings to open the Configure Data panel.
- Configure the required Data Table settings.
- Review the configured settings.
- Click Save.
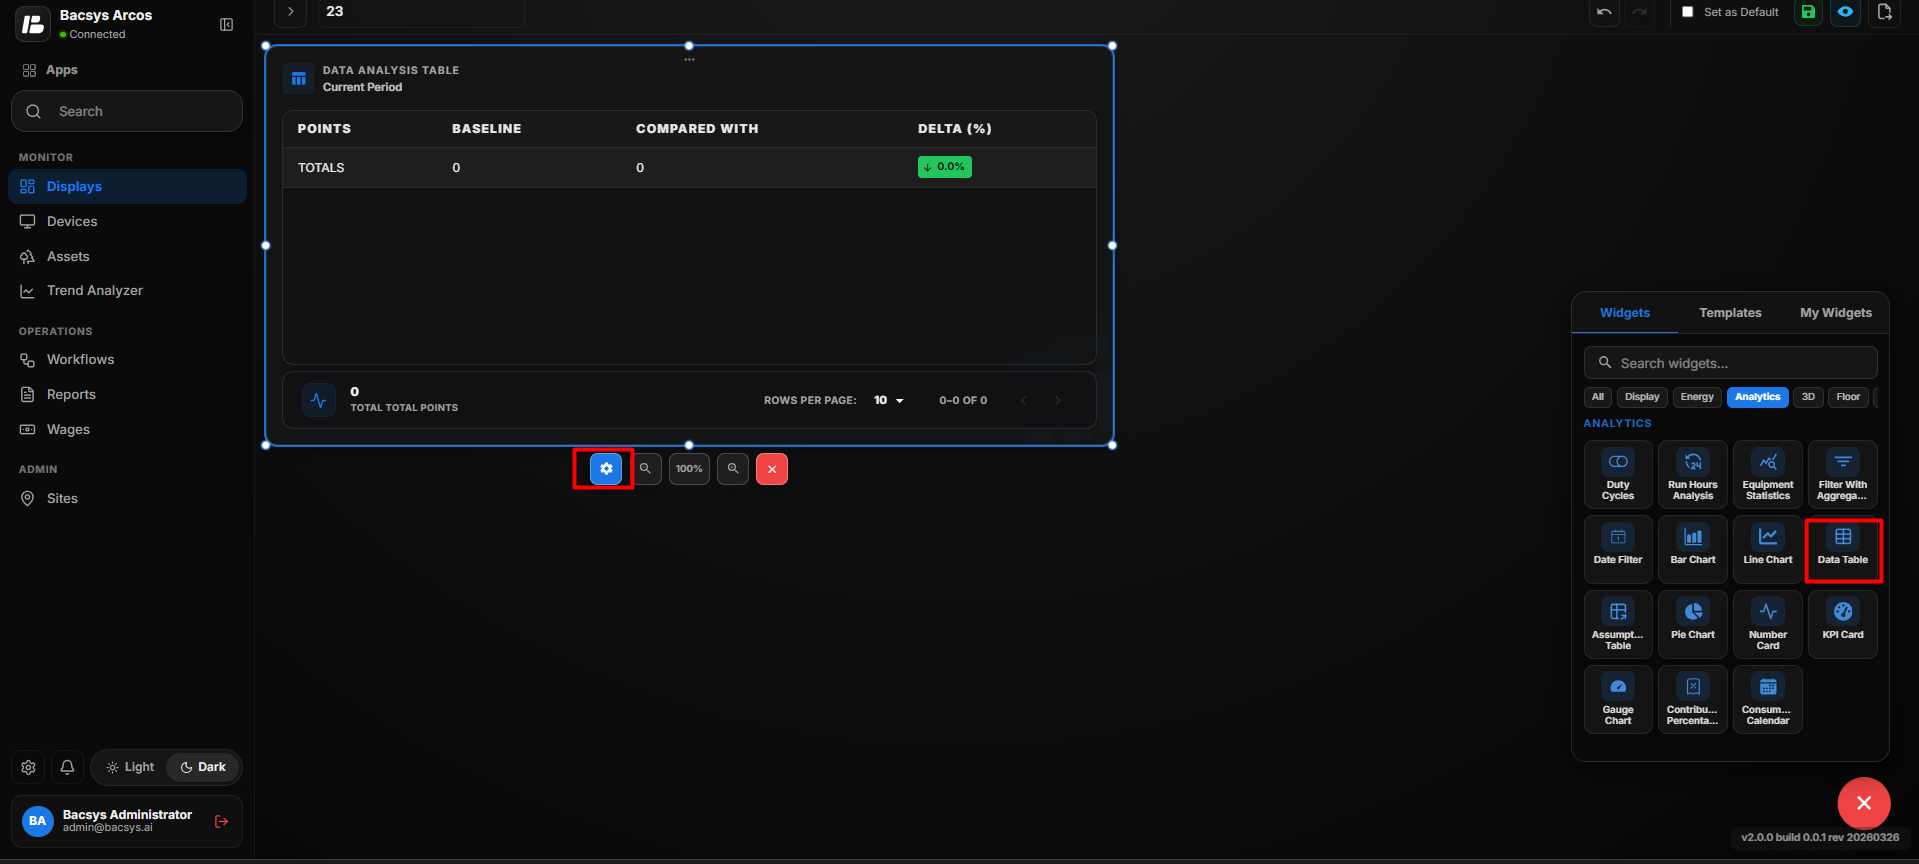 Add Data Table
Data Table Settings
| Option | Description |
|---|---|
| Title | Enter an optional title for the Data Table widget. |
| Select Point | Select the point whose data should be displayed in the table. Click Browse Hierarchy to navigate through Network → Device → Point and select the required point. |
| Compare As | Select the period used to compare the selected point data. The available option shown is Day. |
| Reference | Select the reference date used for comparison. |
| Actual | Select the actual date used for comparison. |
| Represent As | Select the required calculation or representation method for the selected data. |
| Placeholder for Points | Enter placeholder text for displaying or representing points in the table. |
| Placeholder for Delta | Enter placeholder text for displaying the difference or delta between the compared values. |
| Show Background | Use the toggle button to show or hide the widget background. |
| Hide Header | Use the toggle button to show or hide the widget header. |
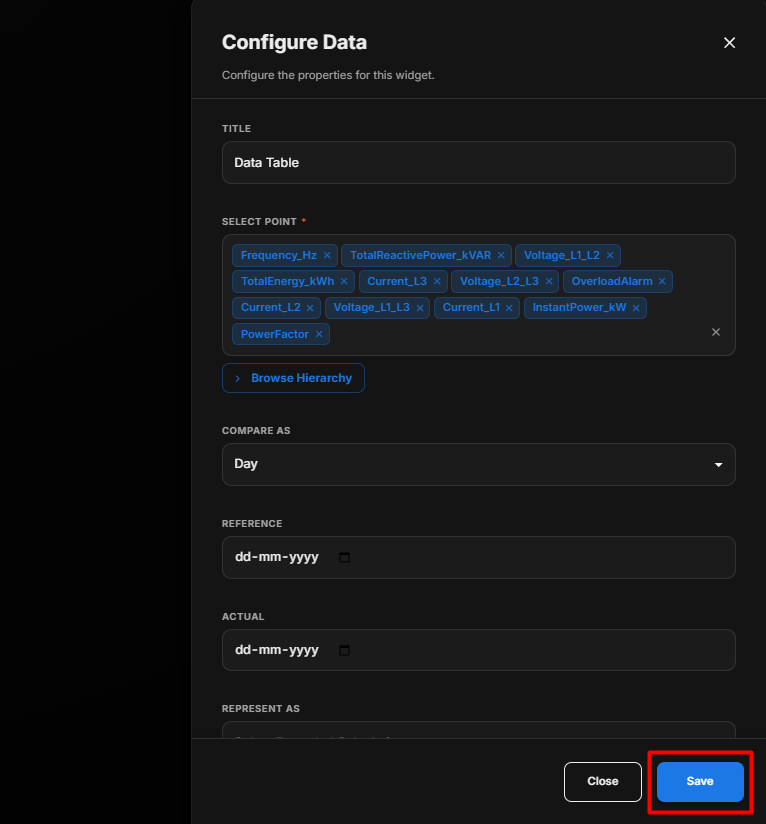 Data Table Settings
Configure the Data Table
- Enter an optional Title.
- Under Select Point, click Browse Hierarchy.
- Navigate through Network → Device → Point.
- Select the required point.
- Under Compare As, select the required comparison period.
- Select the Reference date.
- Select the Actual date.
- Under Represent As, select the required calculation or representation.
- Enter the required Placeholder for Points text.
- Enter the required Placeholder for Delta text.
- Configure Show Background according to your requirement.
- Configure Hide Header according to your requirement.
- Review the configured settings.
- Click Save.
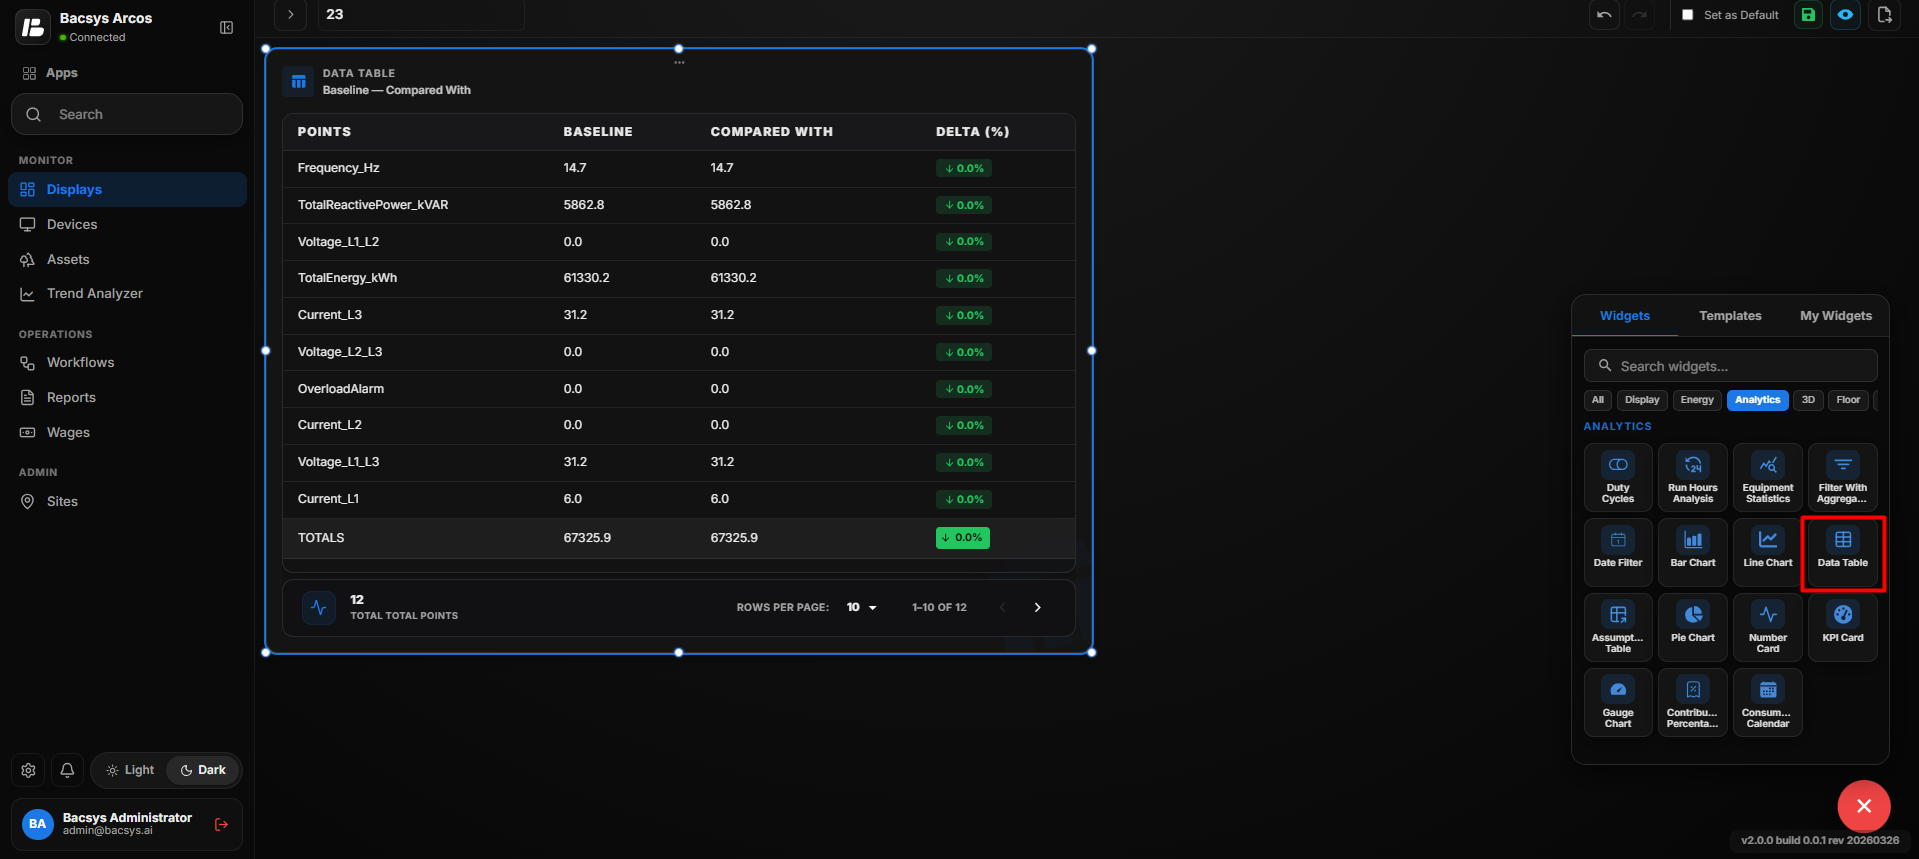 Configure Data Table
Data Table Comparison
After saving the configuration, the widget displays the selected point data in a table format based on the configured comparison period, reference date, actual date, and representation method.
The Placeholder for Points and Placeholder for Delta fields can be used to define how point values and their differences are represented in the table.
Assumption Table
The Assumption Table widget displays assumption-based percentage values for different categories. It allows users to configure comparison settings, define category percentages, and customize how points and delta values are represented.
Add the Assumption Table Widget
- Click the + icon.
- Drag and drop the Assumption Table Widget onto the display.
- Select the Assumption Table Widget.
- Use Zoom In and Zoom Out to adjust the widget view.
- Click Settings to open the Configure Data panel.
- Configure the required Assumption Table settings.
- Review the configured values.
- Click Save.
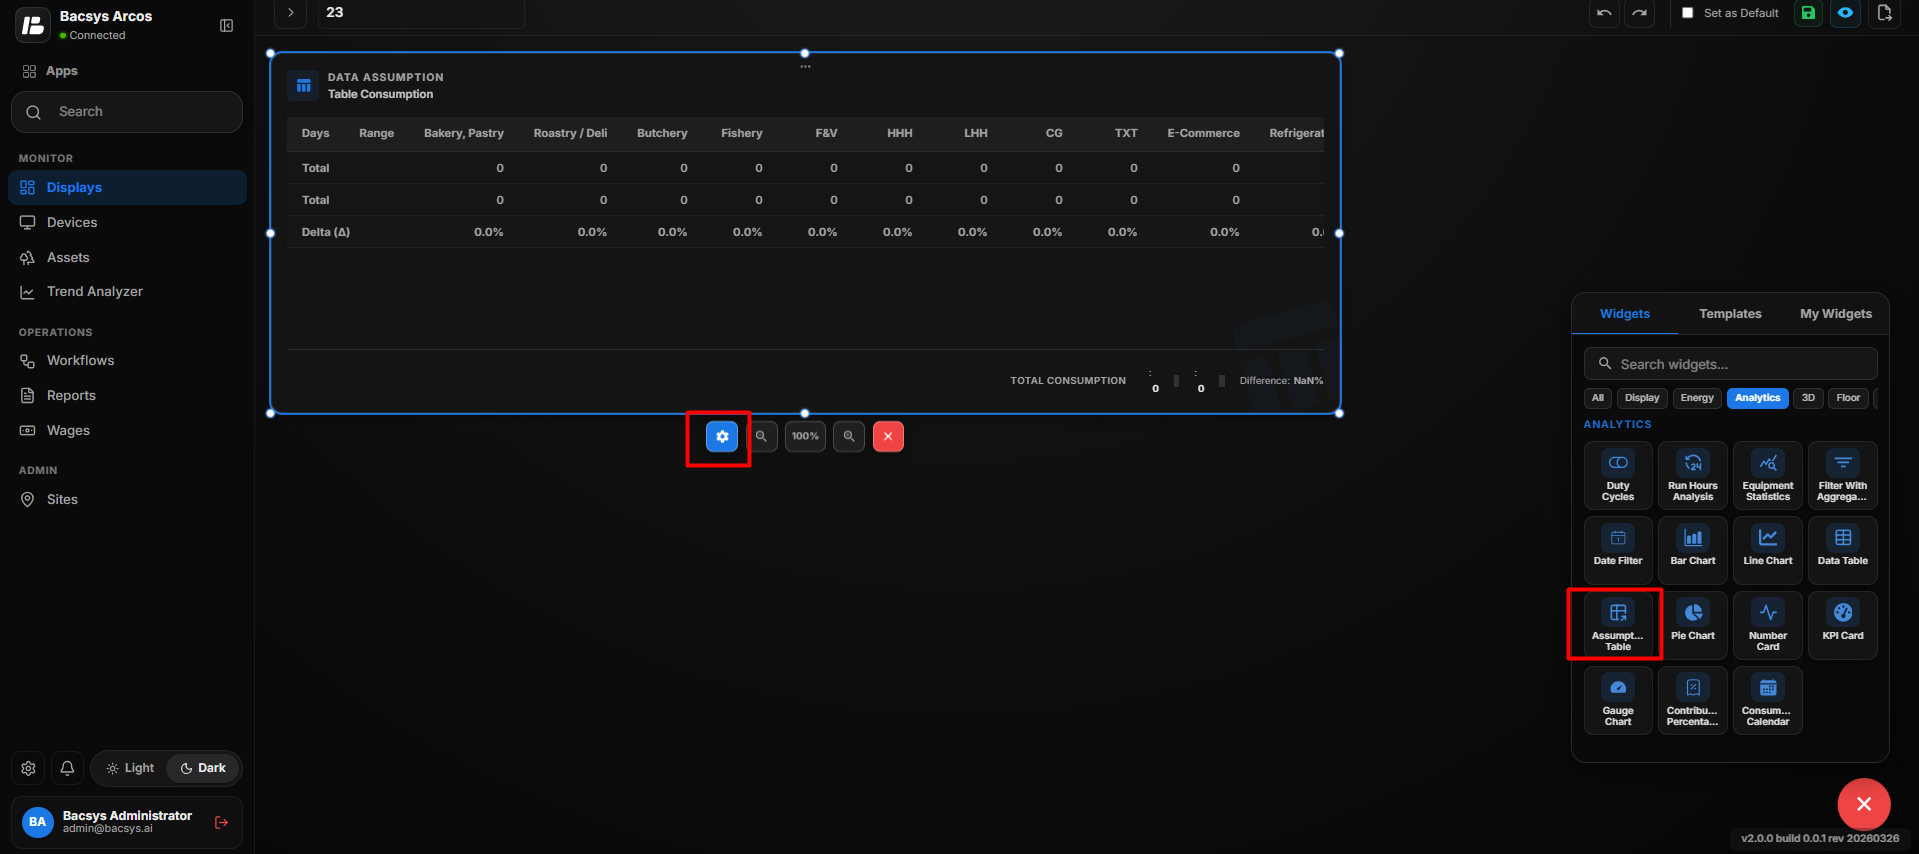 Add Assumption Table
Assumption Table Settings
| Option | Description |
|---|---|
| Title | Enter an optional title for the Assumption Table. |
| Select Point | Select the point used for the assumption calculation. Click Browse Hierarchy to navigate through Network → Device → Point. |
| Compare As | Select the comparison period used for the assumption table. |
| Reference | Select the reference date for comparison. |
| Actual | Select the actual date for comparison. |
| Represent As | Select the required extended calculation or representation method. |
| Bakery, Pastry Percentage | Enter the assumed percentage allocated to Bakery and Pastry usage. |
| Roastery/Deli Percentage | Enter the assumed percentage allocated to Roastery/Deli usage. |
| Butchery Percentage | Enter the assumed percentage allocated to Butchery usage. |
| Fishery Percentage | Enter the assumed percentage allocated to Fishery usage. |
| F&B Percentage | Enter the assumed percentage allocated to Food & Beverage usage. |
| HHH Percentage | Enter the assumed percentage allocated to HHH usage. |
| LHH Percentage | Enter the assumed percentage allocated to LHH usage. |
| CG Percentage | Enter the assumed percentage allocated to CG usage. |
| TXT Percentage | Enter the assumed percentage allocated to TXT usage. |
| E-Commerce Percentage | Enter the assumed percentage allocated to E-Commerce usage. |
| Refrigeration Percentage | Enter the assumed percentage allocated to Refrigeration usage. |
| Lighting Percentage | Enter the assumed percentage allocated to Lighting usage. |
| Chillers Percentage | Enter the assumed percentage allocated to Chillers usage. |
| Warehouse Percentage | Enter the assumed percentage allocated to Warehouse usage. |
| UPS Percentage | Enter the assumed percentage allocated to UPS usage. |
| Offices Percentage | Enter the assumed percentage allocated to Offices usage. |
| FCU/AHU Percentage | Enter the assumed percentage allocated to FCU/AHU usage. |
| Pumps Percentage | Enter the assumed percentage allocated to Pumps usage. |
| Security Percentage | Enter the assumed percentage allocated to Security usage. |
| Signages Percentage | Enter the assumed percentage allocated to Signages usage. |
| Ventilation Percentage | Enter the assumed percentage allocated to Ventilation usage. |
| Placeholder for Points | Enter placeholder text used for point or category values in the table. |
| Placeholder for Delta | Enter placeholder text used for difference or delta values in the table. |
| Show Background | Use the toggle button to show or hide the widget background. |
| Hide Header | Use the toggle button to show or hide the widget header. |
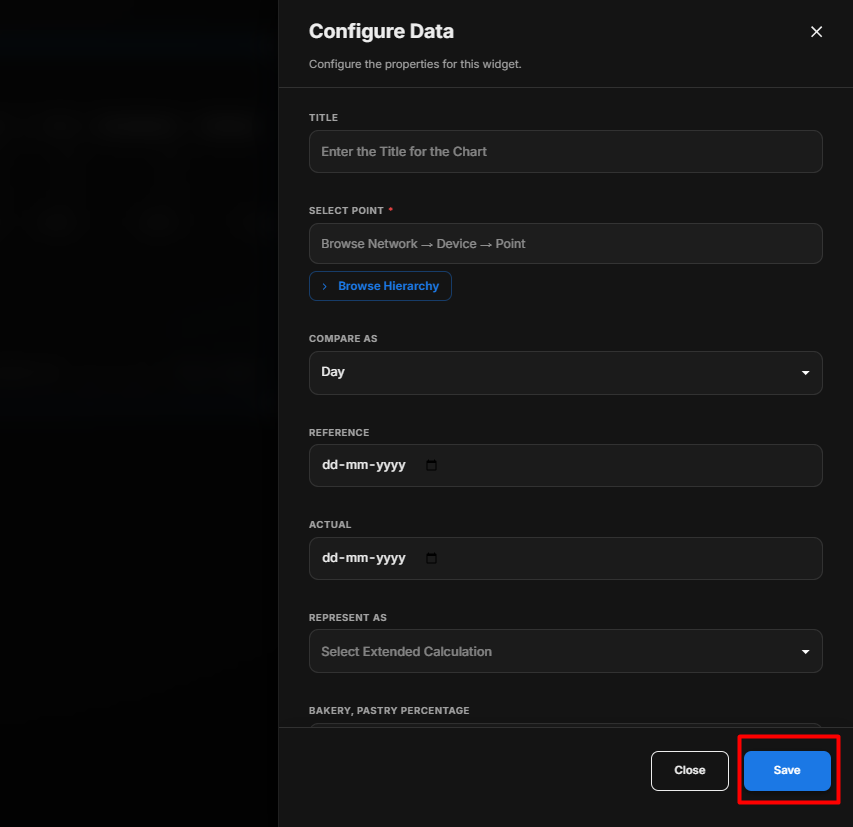 Assumption Table Settings
Configure the Assumption Table
- Enter the required Title.
- Under Select Point, click Browse Hierarchy and select the required point.
- Select the required Compare As option.
- Select the Reference date.
- Select the Actual date.
- Select the required option under Represent As.
- Enter the required percentage values for each assumption category.
- Enter the Placeholder for Points text.
- Enter the Placeholder for Delta text.
- Configure Show Background according to your requirement.
- Configure Hide Header according to your requirement.
- Review all configured assumption percentages.
- Click Save.
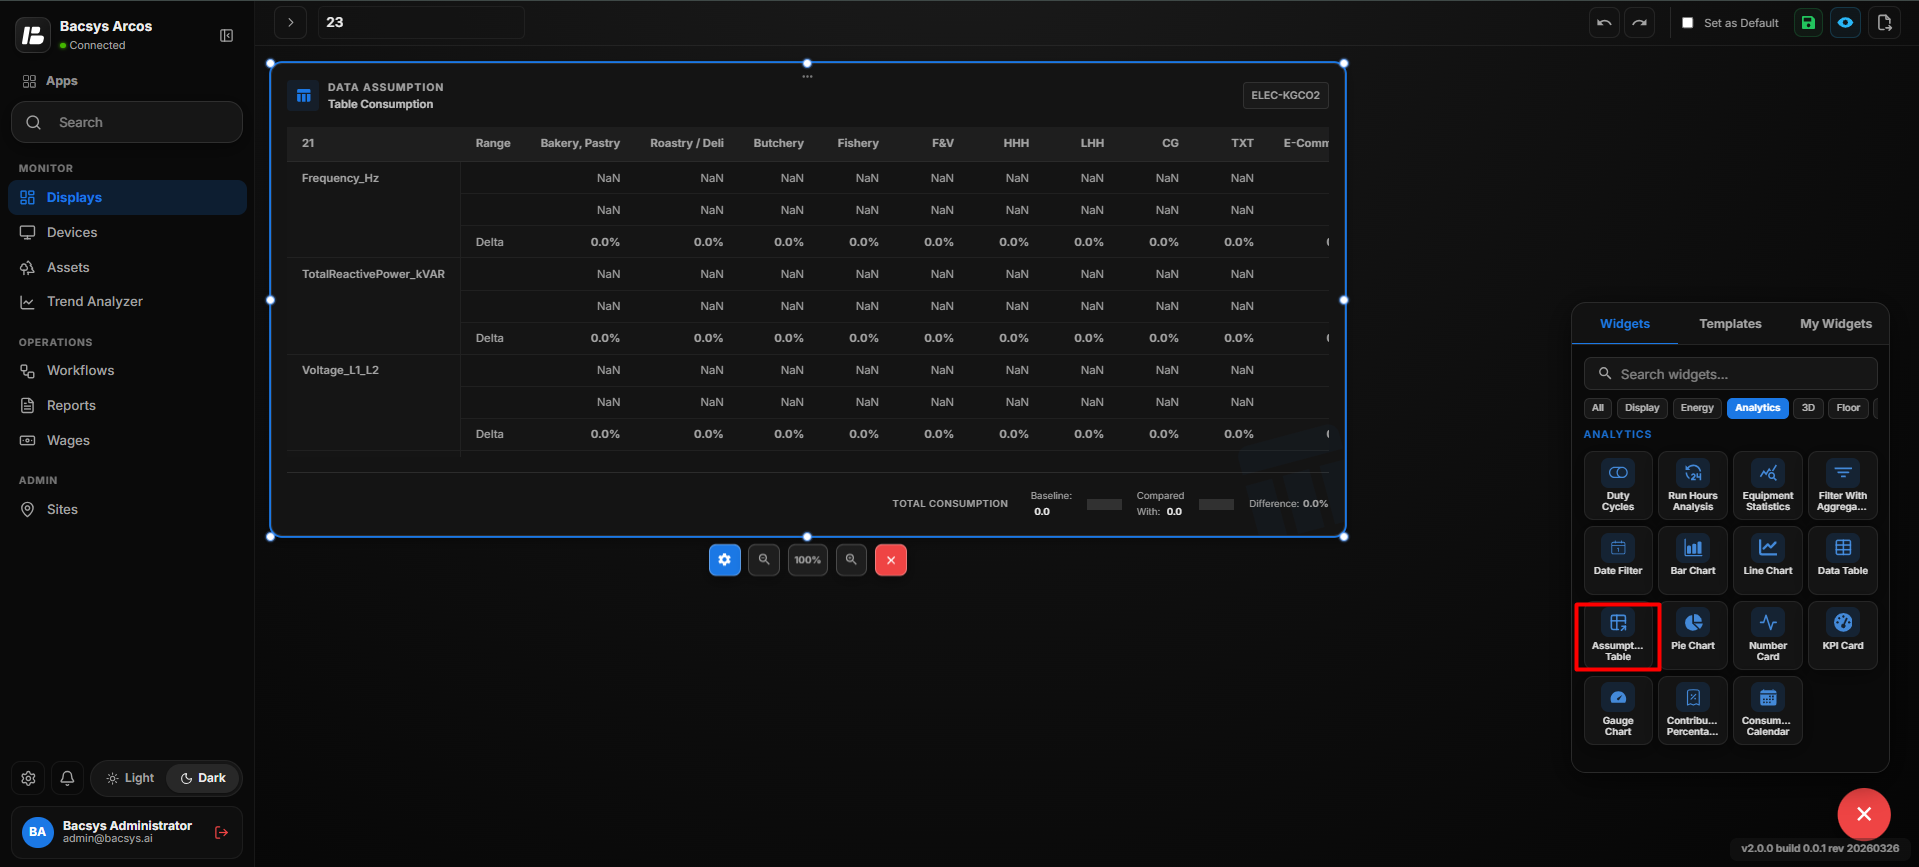 Configure Assumption Table
Assumption Percentage Configuration
The percentage fields allow users to define how the selected consumption or calculated value is distributed across different categories. Each category can be assigned its own percentage value, which is then used when displaying the assumption-based data in the table.
After saving, the Assumption Table displays the configured categories and their corresponding assumption values based on the selected point, comparison dates, and calculation settings.
Pie Chart
The Pie Chart widget displays the distribution of selected data as proportional segments of a circular chart. It can be used to compare the contribution of different values or categories.
Add the Pie Chart Widget
- Click the + icon.
- Drag and drop the Pie Chart Widget onto the display.
- Select the Pie Chart Widget.
- Use Zoom In and Zoom Out to adjust the widget view.
- Click Settings to open the Configure Data panel.
- Configure the required Pie Chart settings.
- Click Save.
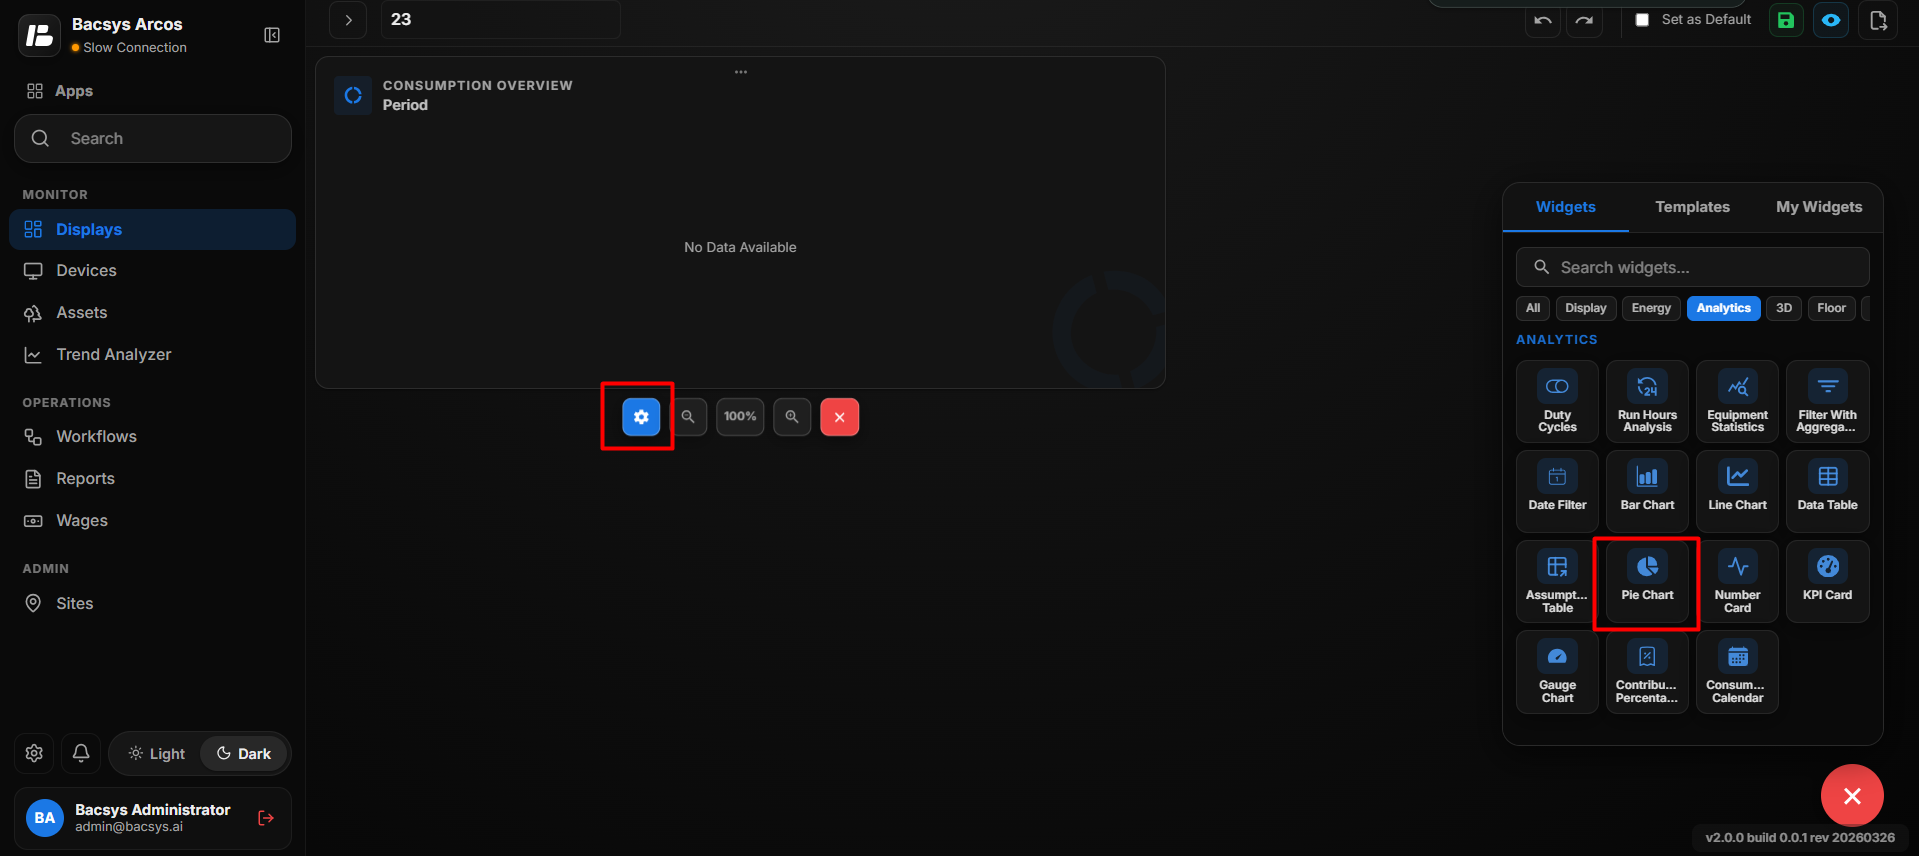 Add Pie Chart
Pie Chart Settings
| Option | Description |
|---|---|
| Title | Enter the title to be displayed for the Pie Chart. |
| Select Point | Select the point used to generate the pie chart data. Click Browse Hierarchy to navigate through Network → Device → Point. |
| Compare As | Select the comparison period used to calculate the displayed data, such as Day. |
| Date | Select the date for which the data should be displayed. |
| Show Cell Percentage | Use the toggle button to show or hide the percentage value for each pie chart segment. |
| Represent As | Select the required extended calculation or representation method for the selected data. |
| Show Background | Use the toggle button to show or hide the widget background. |
| Hide Header | Use the toggle button to show or hide the widget header. |
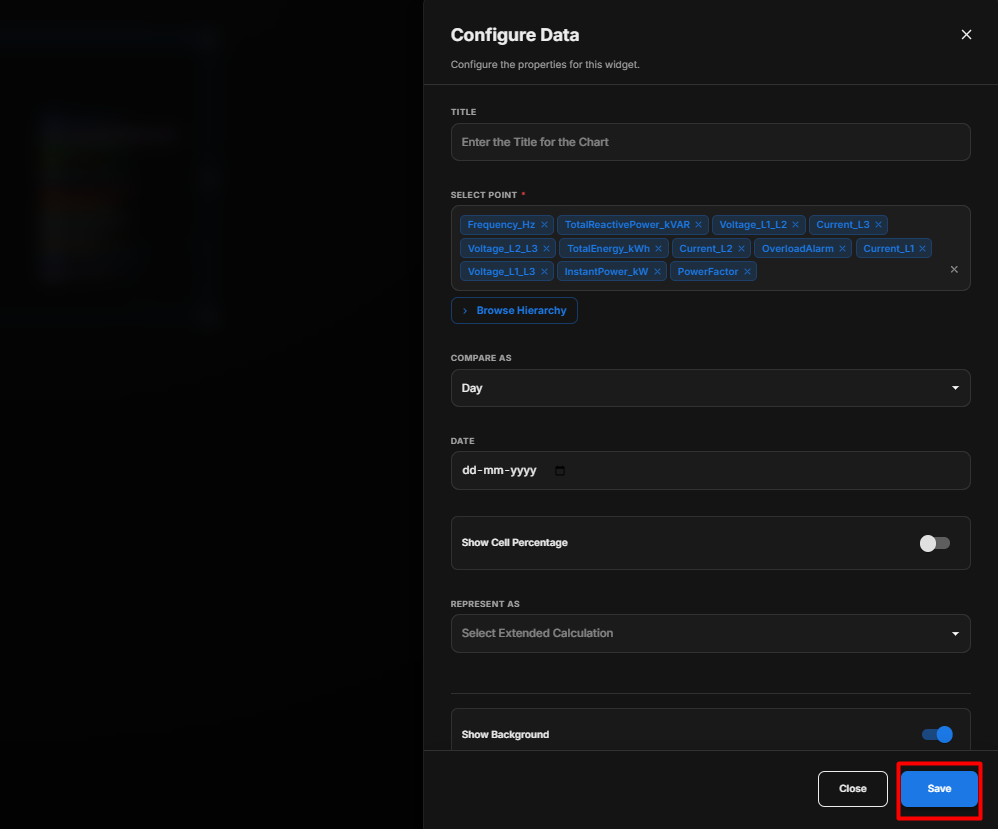 Pie Chart Settings
Configure the Pie Chart
- Enter the required Title.
- Under Select Point, click Browse Hierarchy and select the required point.
- Select the required Compare As period.
- Select the required Date.
- Enable Show Cell Percentage if percentage values should be displayed on the chart.
- Select the required option under Represent As.
- Configure Show Background according to your requirement.
- Configure Hide Header according to your requirement.
- Review the configured settings.
- Click Save.
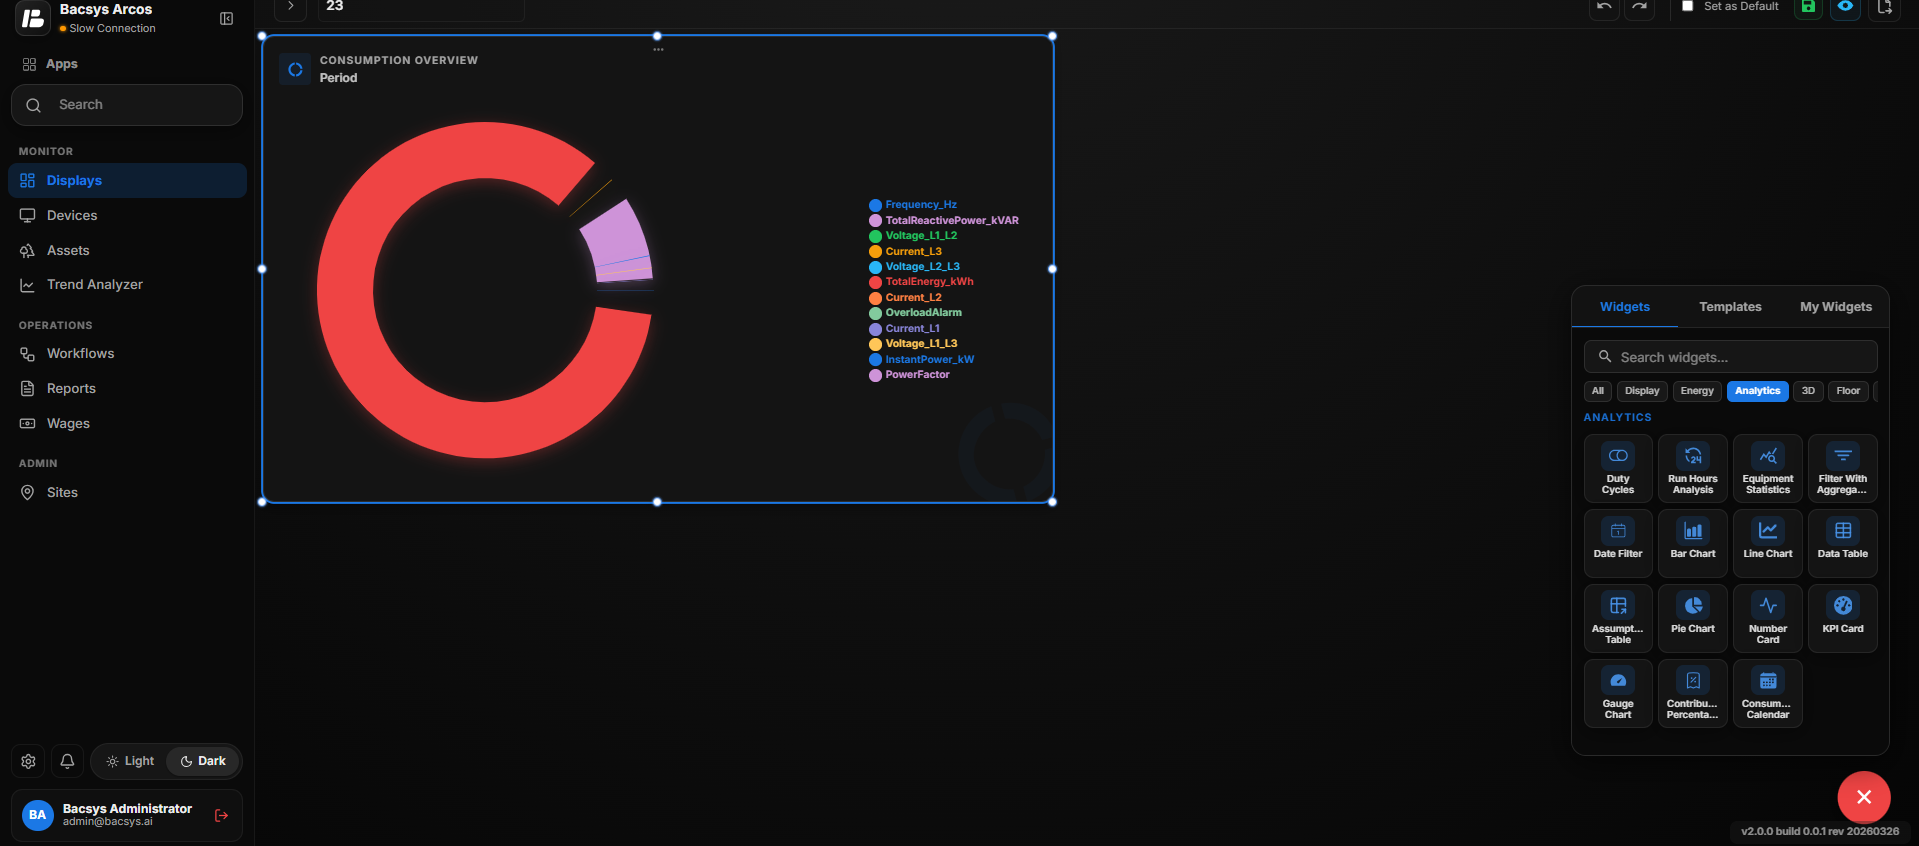 Configure Pie Chart
After saving, the Pie Chart displays the selected data as proportional segments. When Show Cell Percentage is enabled, the percentage contribution of each segment is also displayed.
--
Number Card
The Number Card widget displays a selected point value as a prominent numerical value. It can be used to quickly monitor important real-time or historical metrics.
Add the Number Card Widget
- Click the + icon.
- Drag and drop the Number Card Widget onto the display.
- Select the Number Card Widget.
- Use Zoom In and Zoom Out to adjust the widget view.
- Click Settings to open the Configure Data panel.
- Configure the required Number Card settings.
- Click Save.
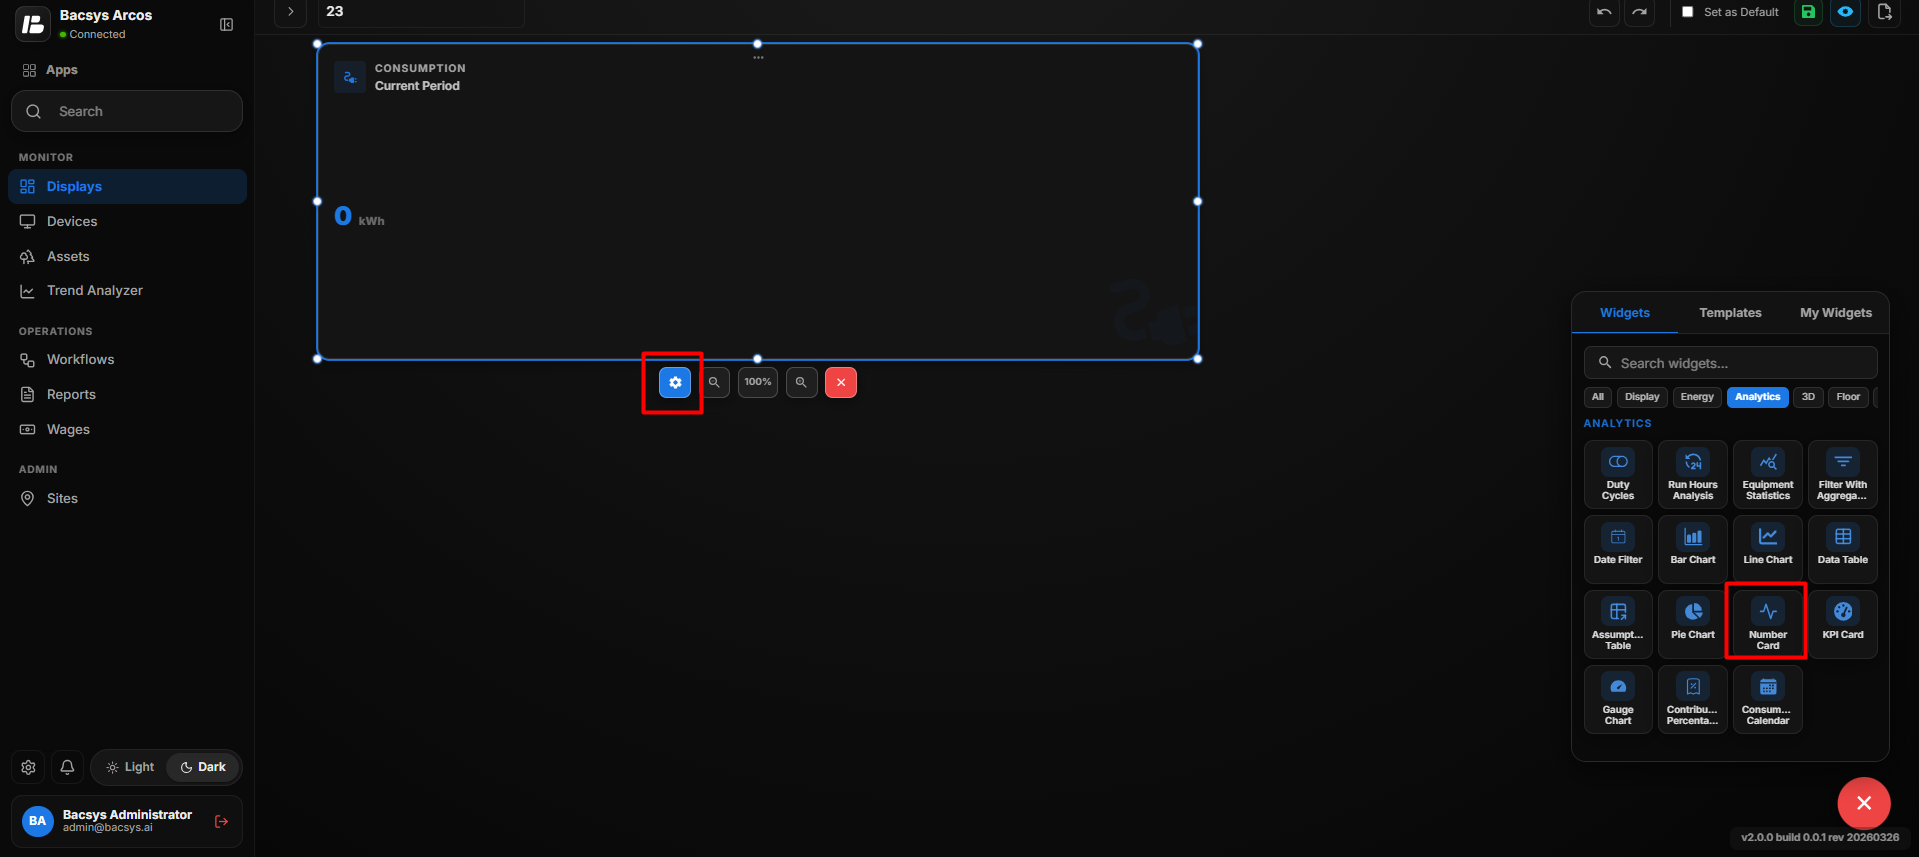 Add Number Card
Number Card Settings
| Option | Description |
|---|---|
| Title | Enter the title to be displayed for the Number Card. |
| Select Point | Select the point whose value should be displayed. Click Browse Hierarchy to navigate through the available Network → Device → Point hierarchy. |
| Font Size | Specify the font size of the displayed value. |
| Font Color | Select the color of the numerical value from the available color palette. Recently used colors are also available. |
| Background Color | Select the background color of the Number Card from the available color palette. Recently used colors are also available. |
| Hide Label | Use the toggle button to show or hide the point label displayed on the Number Card. |
| Compare As | Select the comparison period used to calculate the displayed value, such as Day. |
| Date | Select the date for which the value should be displayed. |
| Represent As | Select the required extended calculation or representation method for the selected point. |
| Show Background | Use the toggle button to show or hide the widget background. |
| Hide Header | Use the toggle button to show or hide the widget header. |
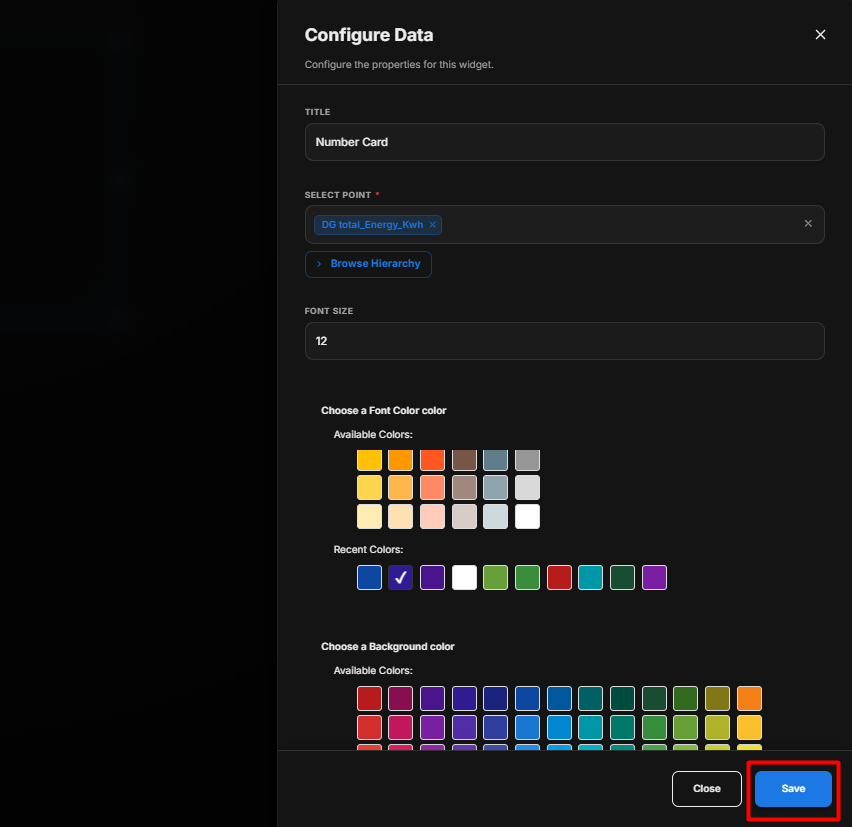 Number Card Settings
Configure the Number Card
- Enter the required Title.
- Under Select Point, click Browse Hierarchy and select the required point.
- Enter the required Font Size.
- Select the required Font Color.
- Select the required Background Color.
- Enable Hide Label if the point label should not be displayed.
- Select the required Compare As period.
- Select the required Date.
- Select the required option under Represent As.
- Configure Show Background according to your requirement.
- Configure Hide Header according to your requirement.
- Review the configured settings.
- Click Save.
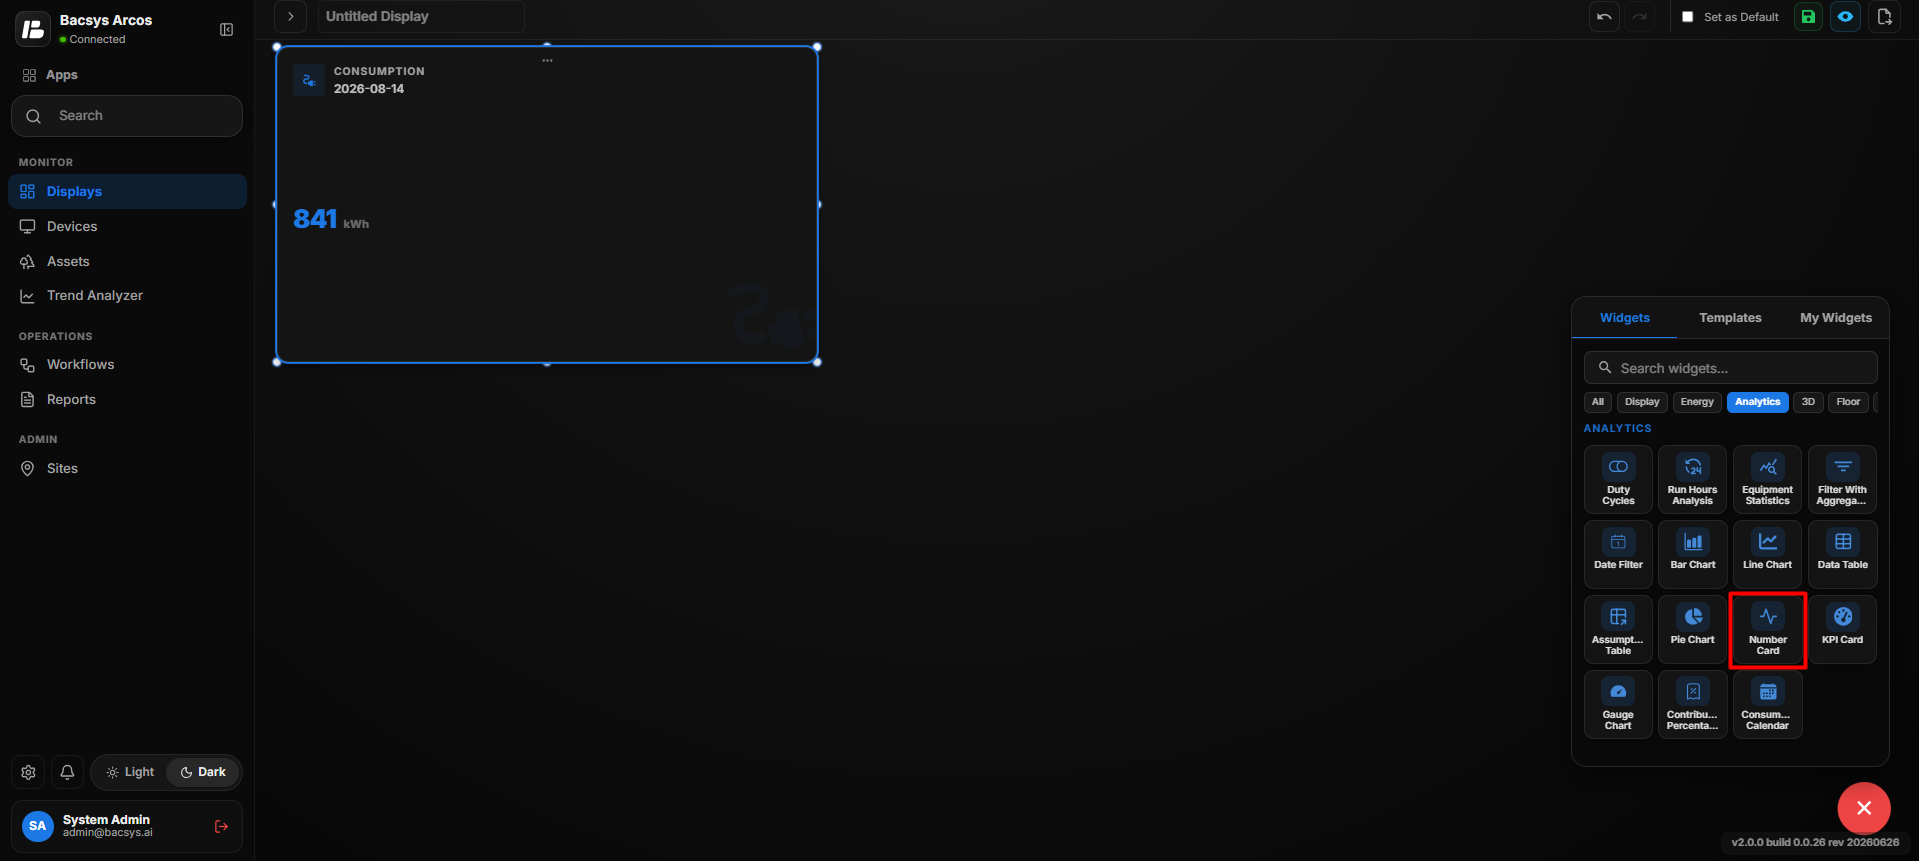 Configure Number Card
After saving, the Number Card displays the selected point value as a large numerical value using the configured font, background, label, and calculation settings.
KPI Card
The KPI Card widget displays a key performance indicator for a selected point and allows users to compare the value between a reference date and an actual date.
Add the KPI Card Widget
- Click the + icon.
- Drag and drop the KPI Card Widget onto the display.
- Select the KPI Card Widget.
- Use Zoom In and Zoom Out to adjust the widget view.
- Click Settings to open the Configure Data panel.
- Configure the required KPI Card settings.
- Click Save.
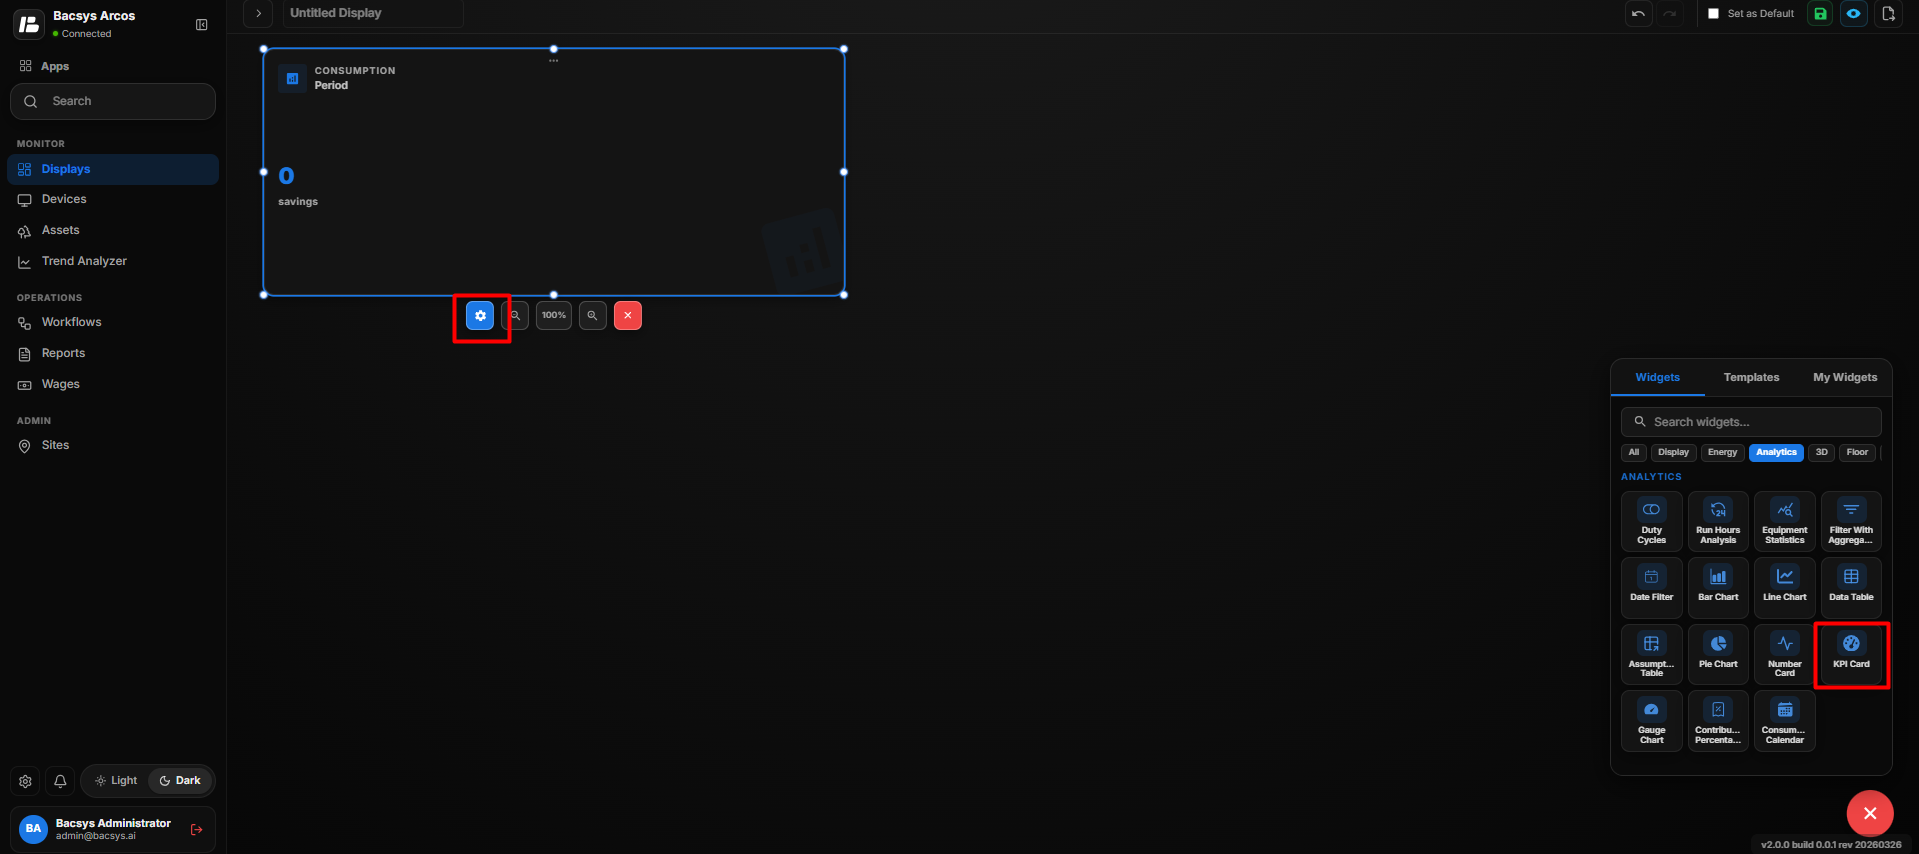 Add KPI Card
KPI Card Settings
| Option | Description |
|---|---|
| Title | Enter the title to be displayed for the KPI Card. |
| Select Point | Select the trend point used for the KPI calculation. Click Browse Hierarchy to select the required point. |
| Compare As | Select the comparison period, such as Day,Week,Month,Year,Quarter,Year,Year to Month,year to Year for comparing KPI values. |
| Reference | Select the reference date used as the baseline for comparison. |
| Actual | Select the actual date whose value is compared against the reference value. |
| Represent As | Select the required extended calculation or representation method for the selected trend point. |
| Show Background | Use the toggle button to show or hide the widget background. |
| Hide Header | Use the toggle button to show or hide the widget header. |
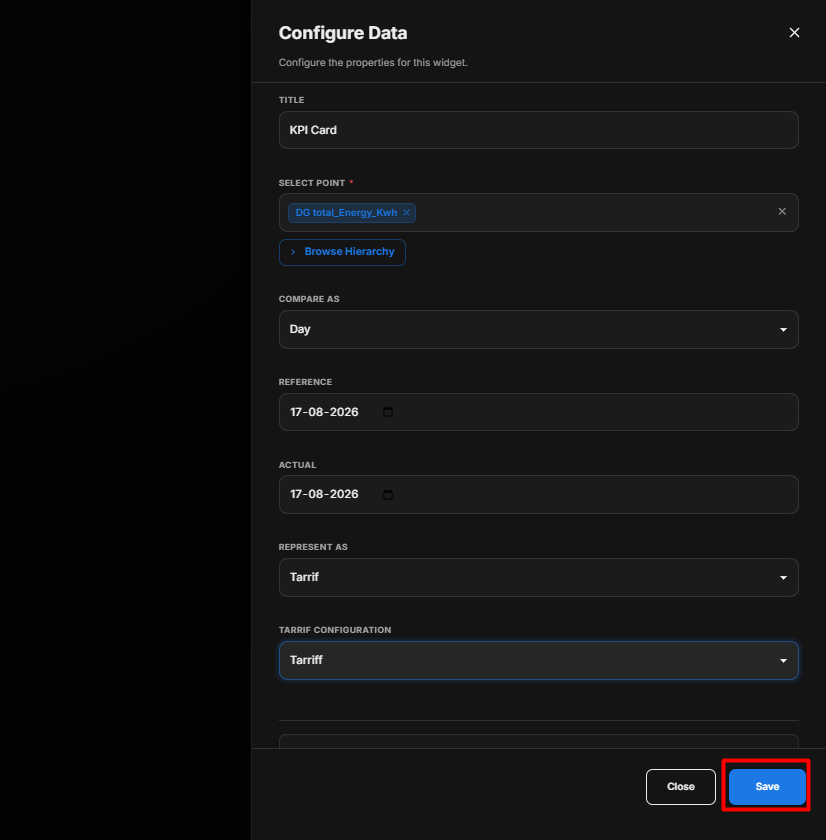 KPI Card Settings
Configure the KPI Card
- Enter the required Title.
- Under Select Point, click Browse Hierarchy and select the required trend point.
- Select the required Compare As period.
- Select the Reference date.
- Select the Actual date.
- Select the required option under Represent As.
- Configure Show Background according to your requirement.
- Configure Hide Header according to your requirement.
- Review the configured settings.
- Click Save.
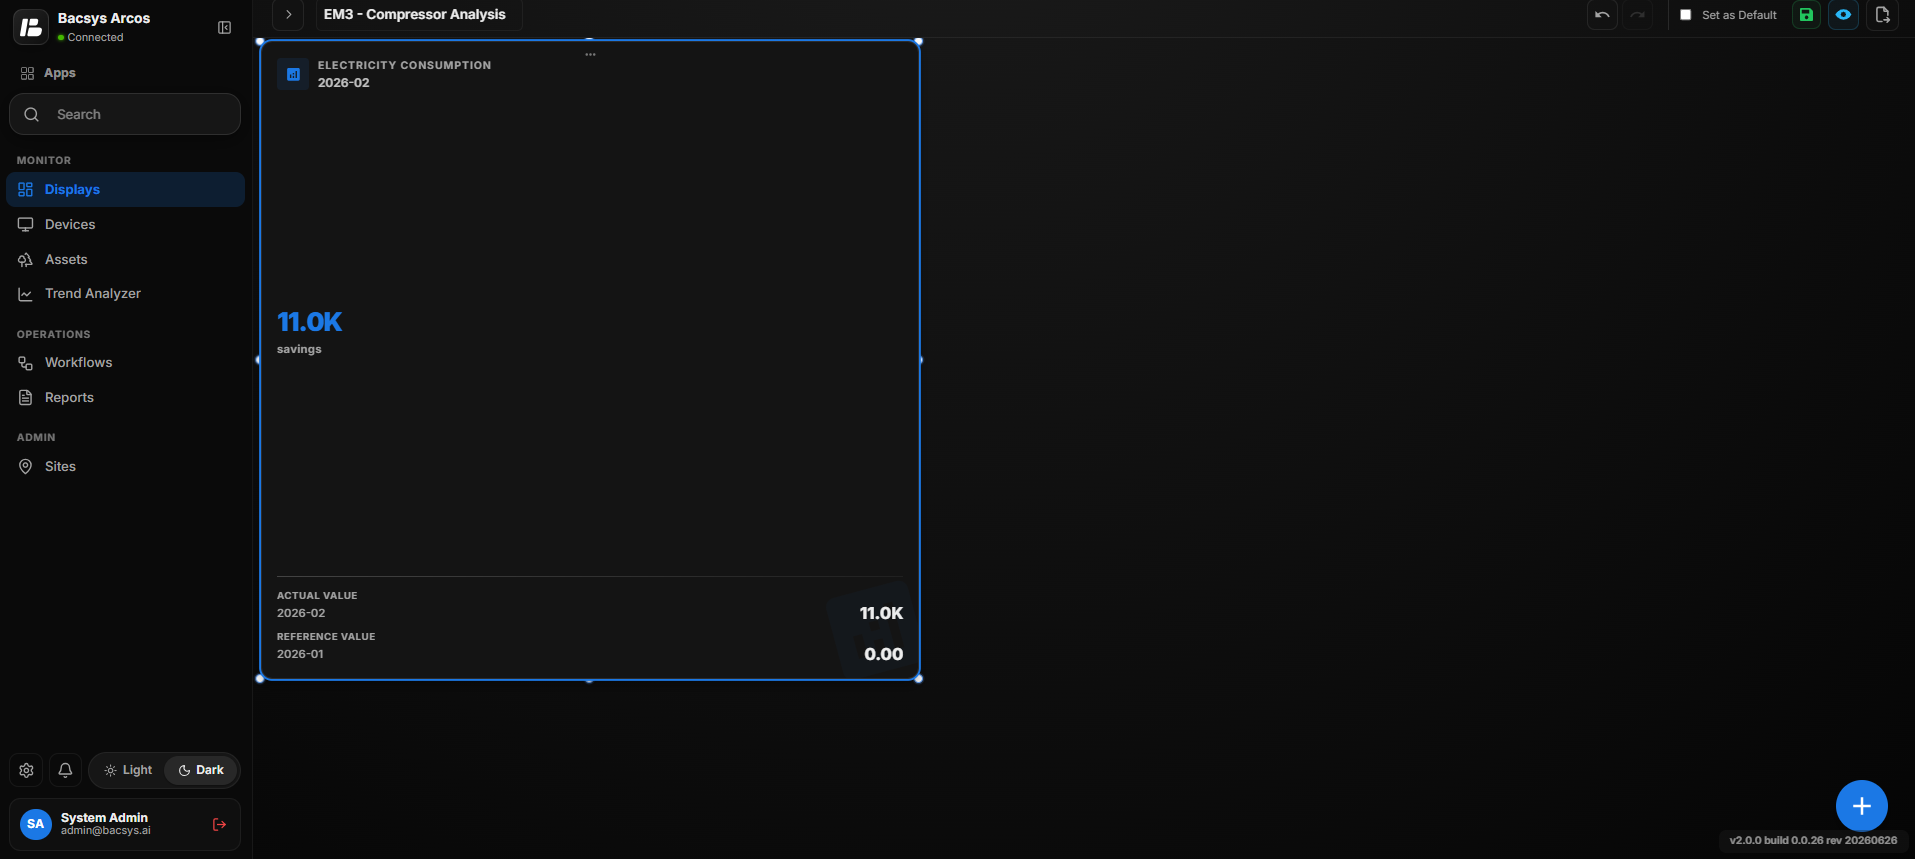 Configure KPI Card
After saving, the KPI Card displays the calculated KPI value based on the selected trend point, comparison period, reference date, actual date, and extended calculation settings.
Gauge Consumption Chart
The Gauge Consumption Chart widget displays consumption performance using a gauge with configurable threshold levels. It allows users to compare consumption values against defined success, warning, and error limits.
Add the Gauge Consumption Chart Widget
- Click the + icon.
- Drag and drop the Gauge Consumption Chart Widget onto the display.
- Select the Gauge Consumption Chart Widget.
- Use Zoom In and Zoom Out to adjust the widget view.
- Click Settings to open the Configure Data panel.
- Configure the required Gauge Consumption Chart settings.
- Click Save.
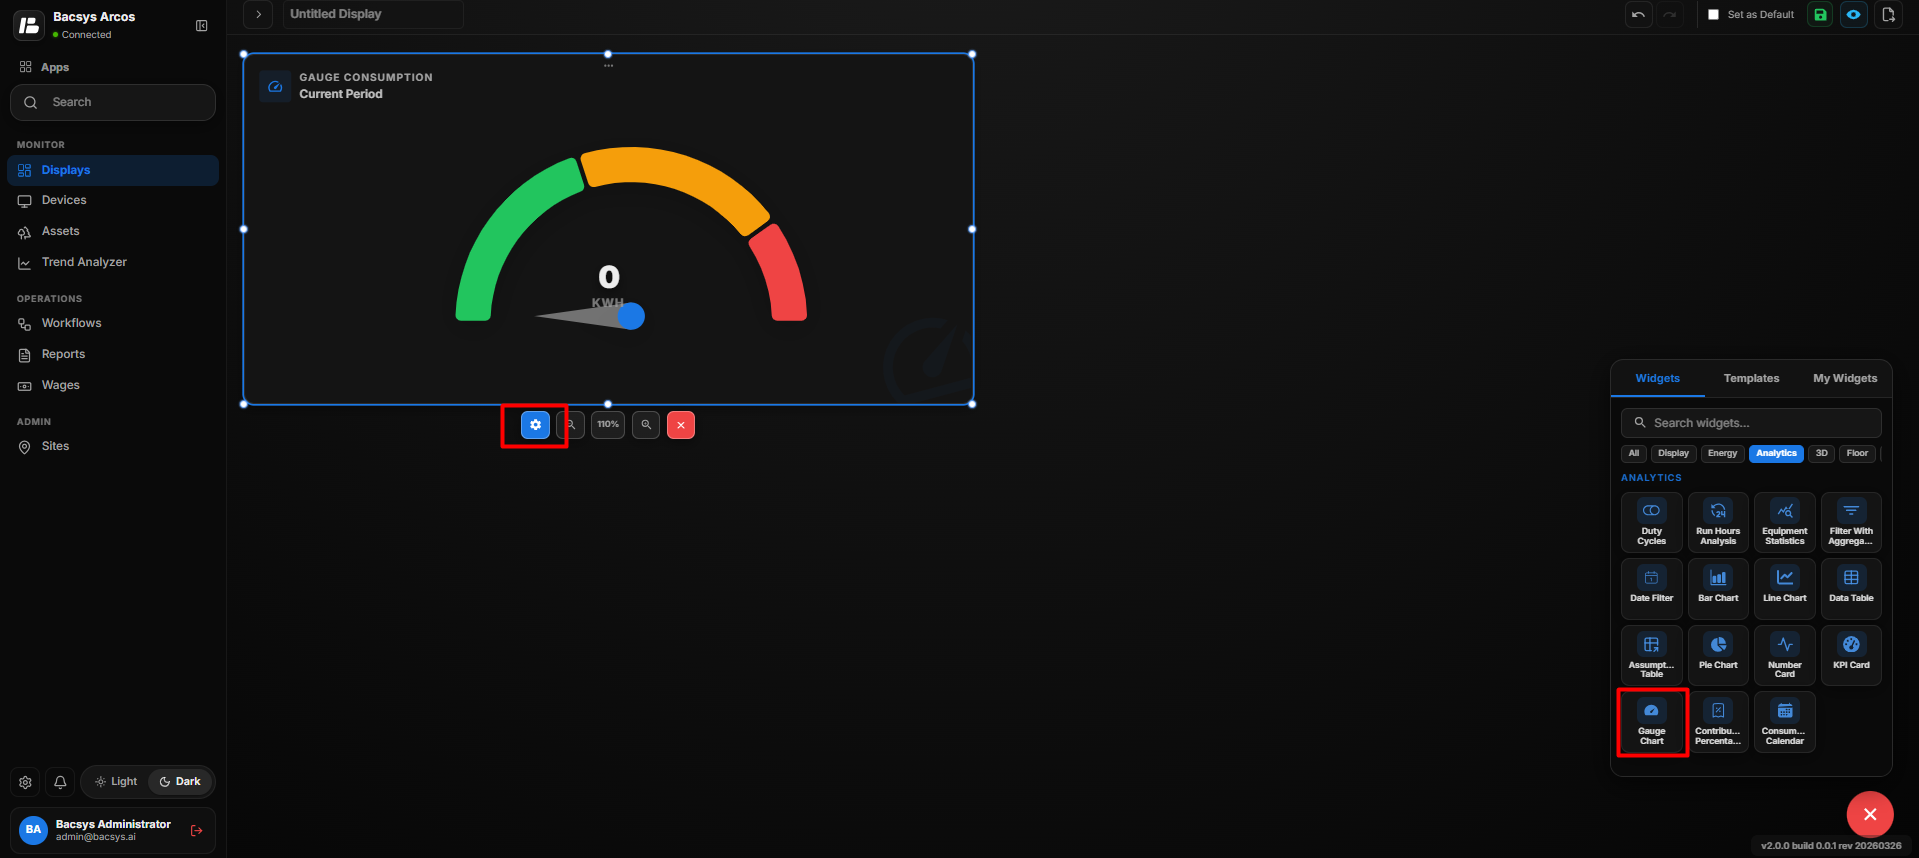 Add Gauge Consumption Chart
Gauge Consumption Chart Settings
| Option | Description |
|---|---|
| Title | Enter the title to be displayed for the Gauge Consumption Chart. |
| Select Point | Select the trend point used for the consumption calculation. Click Browse Hierarchy to select the required point. |
| Compare As | Select the comparison period, such as Day, for calculating the consumption value. |
| Use as Actual | Enable this option to use the selected point value as the actual value for the gauge calculation. |
| Reference | Select the reference date used as the baseline for comparison. |
| Actual | Select the actual date whose consumption value is evaluated. |
| Level 1 (Success) – Threshold Value | Define the threshold value for the Success level. |
| Level 1 Color | Select the color used to represent the Success level. |
| Level 2 (Warning) – Threshold Value | Define the threshold value for the Warning level. |
| Level 2 Color | Select the color used to represent the Warning level. |
| Level 3 (Error) – Threshold Value | Define the threshold value for the Error level. |
| Level 3 Color | Select the color used to represent the Error level. |
| Represent As | Select the required extended calculation or representation method for the selected trend point. |
| Show Background | Use the toggle button to show or hide the widget background. |
| Hide Header | Use the toggle button to show or hide the widget header. |
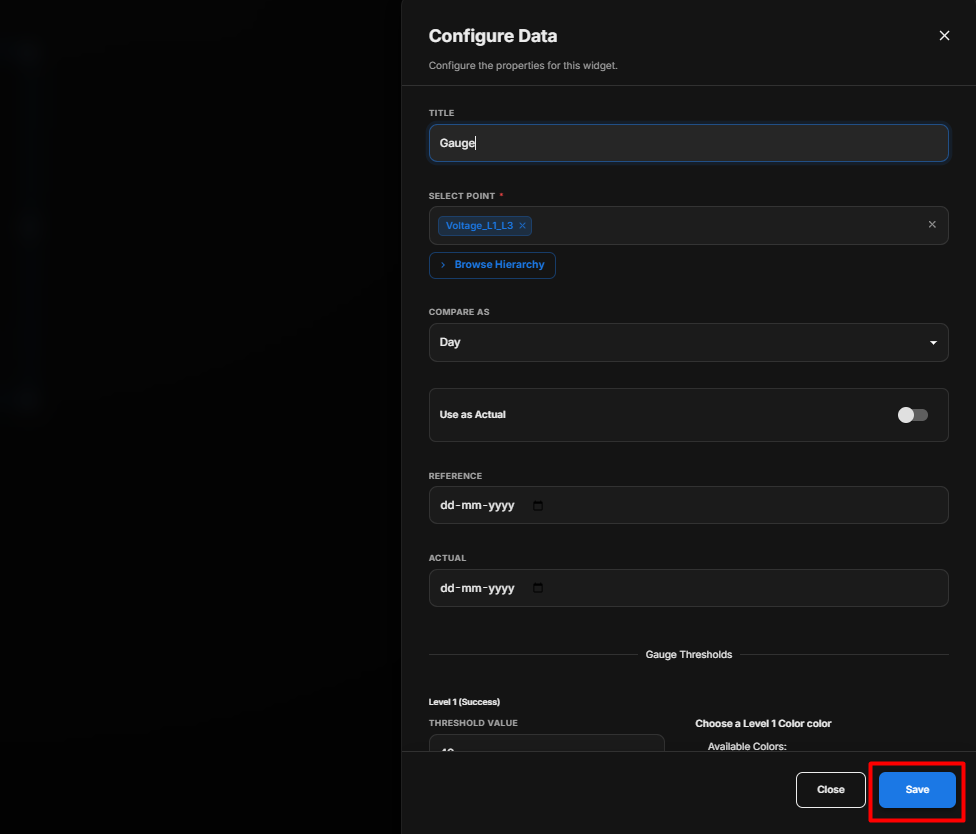 Add Gauge Consumption Chart
Configure the Gauge Consumption Chart
- Enter the required Title.
- Under Select Point, click Browse Hierarchy and select the required trend point.
- Select the required Compare As period.
- Enable Use as Actual if the selected point should be treated as the actual value.
- Select the Reference date.
- Select the Actual date.
- Under Gauge Thresholds, configure the Level 1 (Success) threshold value.
- Select the required Level 1 Color.
- Configure the Level 2 (Warning) threshold value.
- Select the required Level 2 Color.
- Configure the Level 3 (Error) threshold value.
- Select the required Level 3 Color.
- Select the required option under Represent As.
- Configure Show Background according to your requirement.
- Configure Hide Header according to your requirement.
- Review the configured settings.
- Click Save.
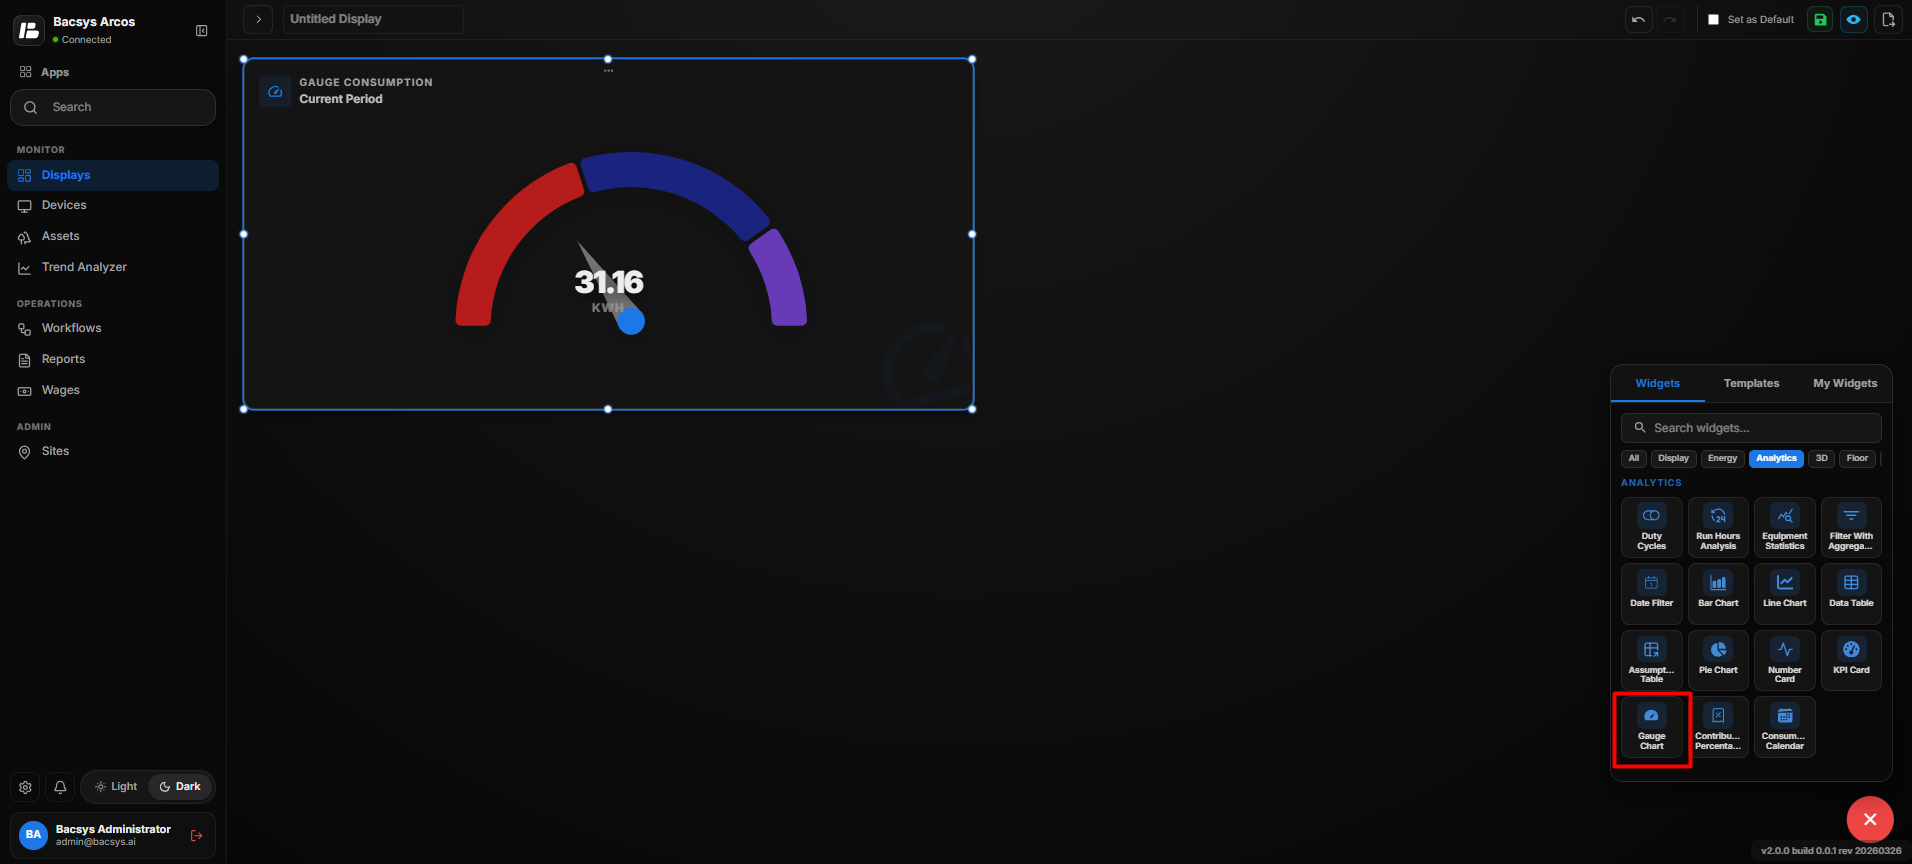 Add Gauge Consumption Chart
After saving, the Gauge Consumption Chart displays the calculated consumption value on a gauge. The configured Success, Warning, and Error thresholds determine the gauge status and corresponding visual indication.
Contribution Percentage
The Contribution Percentage widget displays the percentage contribution of selected trend points, allowing users to compare how much each selected point contributes to the overall value.
Add the Contribution Percentage Widget
- Click the + icon.
- Drag and drop the Contribution Percentage Widget onto the display.
- Select the Contribution Percentage Widget.
- Use Zoom In and Zoom Out to adjust the widget view.
- Click Settings to open the Configure Data panel.
- Configure the required Contribution Percentage settings.
- Click Save.
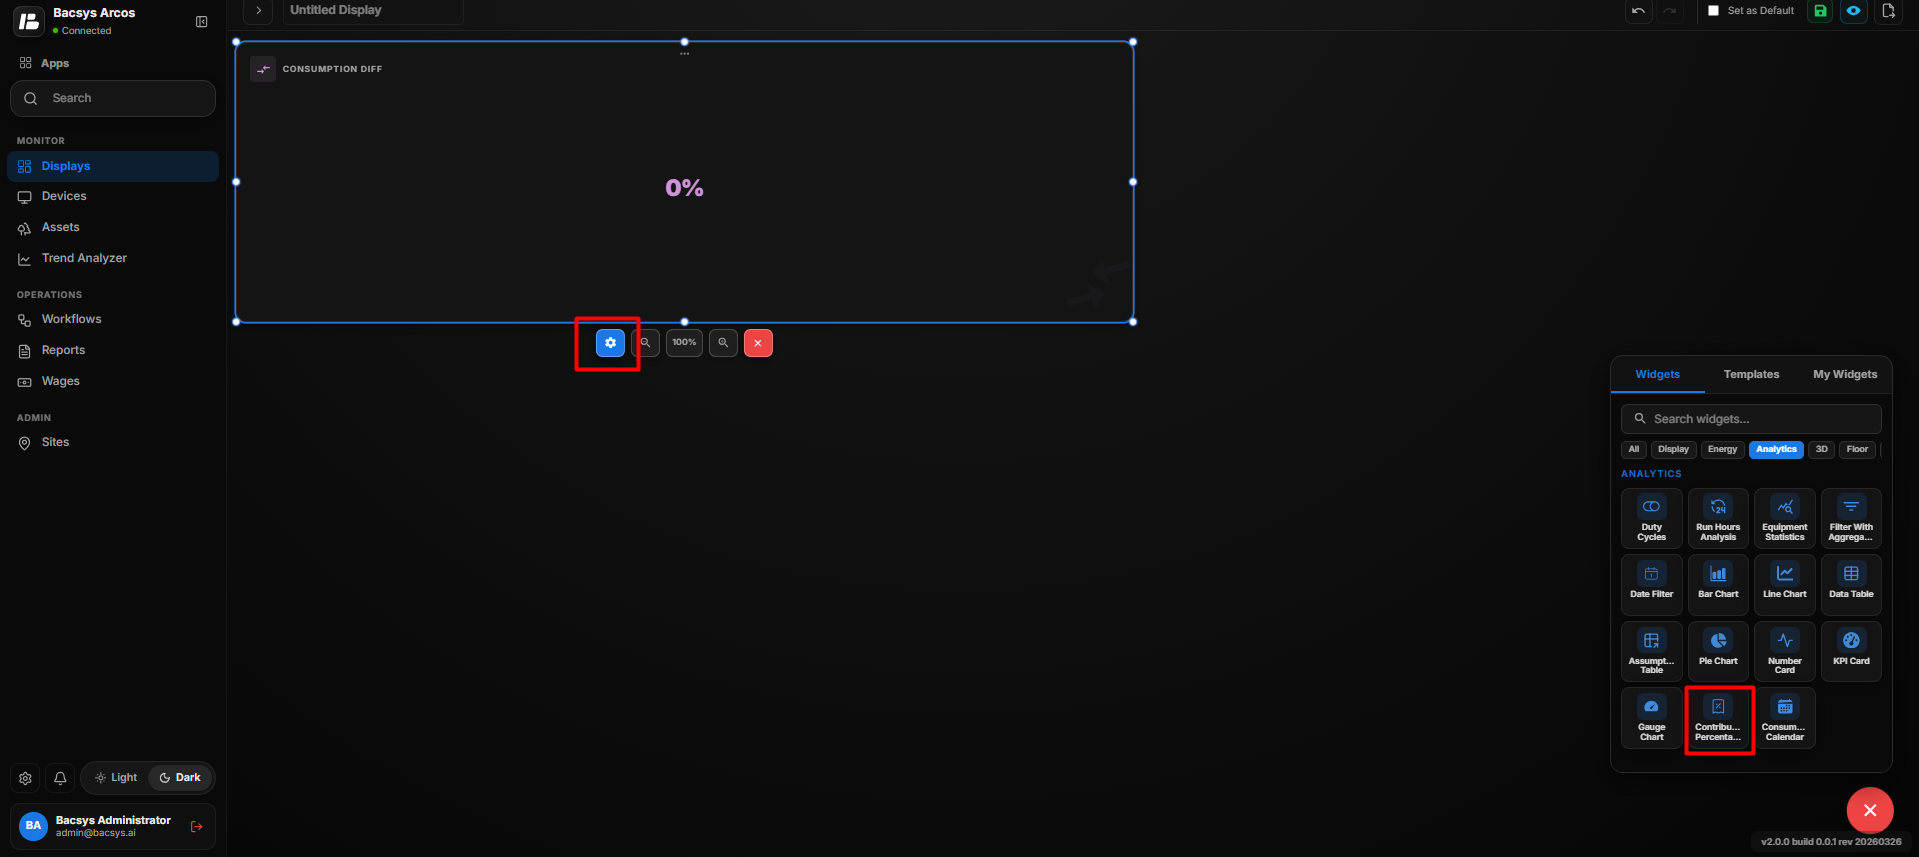 Add Contribution Percentage
Contribution Percentage Settings
| Option | Description |
|---|---|
| Title | Enter the title to be displayed for the Contribution Percentage widget. |
| Select Point | Select up to 2 trend points from the hierarchy for contribution comparison. Click Browse Hierarchy to select the required points. |
| Font Size | Specify the font size used for the displayed contribution values. |
| Font Color | Select the color for the displayed values from the available color palette. Recently used colors are also available. |
| Background Color | Select the background color of the widget from the available color palette. |
| Hide Label | Use the toggle button to show or hide the labels associated with the selected points. |
| Compare As | Select the comparison period, such as Day, for calculating the contribution percentage. |
| Date | Select the date for which the contribution percentage should be calculated. |
| Represent As | Select the required extended calculation or representation method for the selected trend points. |
| Show Background | Use the toggle button to show or hide the widget background. |
| Hide Header | Use the toggle button to show or hide the widget header. |
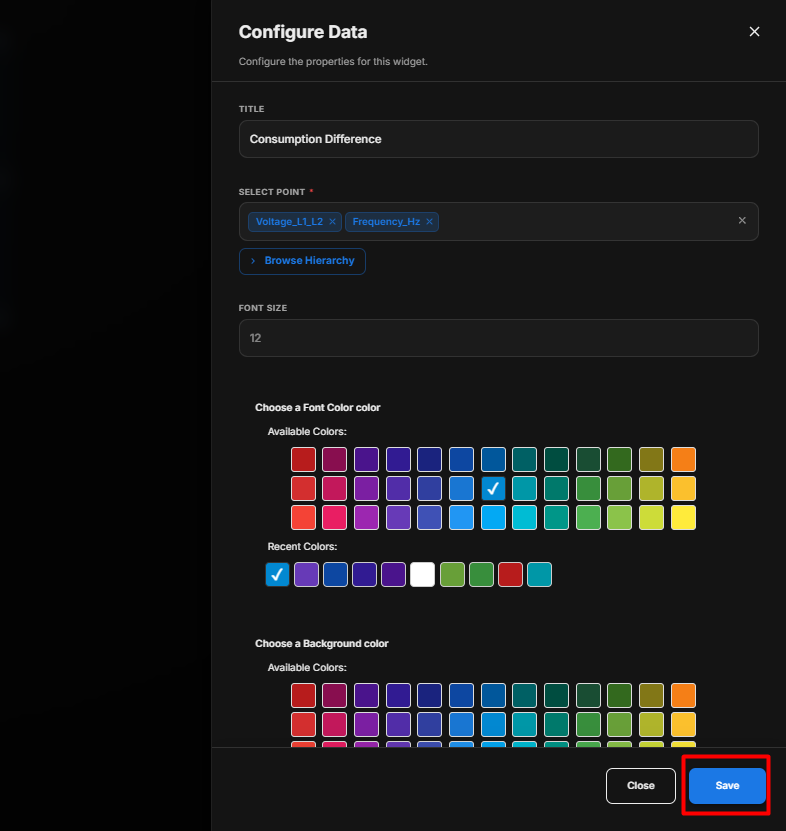 Add Contribution Percentage
Configure the Contribution Percentage
- Enter the required Title.
- Under Select Point, click Browse Hierarchy and select the required trend points.
- Enter the required Font Size.
- Select the required Font Color.
- Select the required Background Color.
- Enable Hide Label if the point labels should not be displayed.
- Select the required Compare As period.
- Select the required Date.
- Select the required option under Represent As.
- Configure Show Background according to your requirement.
- Configure Hide Header according to your requirement.
- Review the configured settings.
- Click Save.
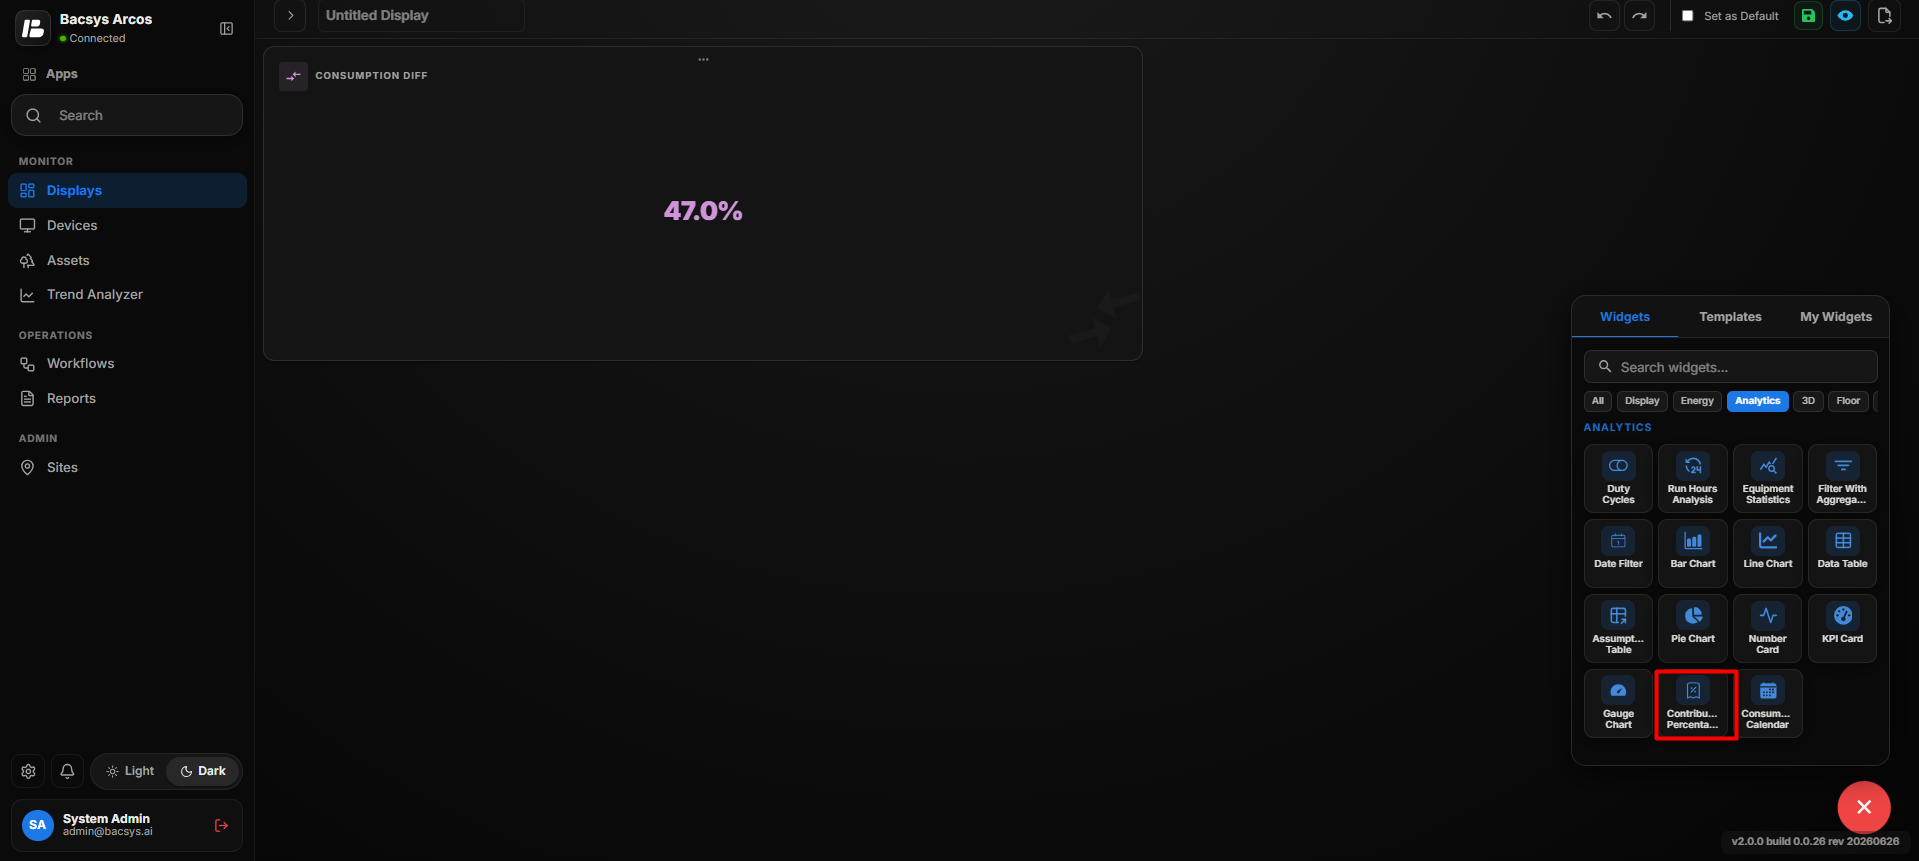 Add Contribution Percentage
After saving, the widget calculates and displays the percentage contribution of the selected trend points based on the configured comparison period, date, and calculation method.
Consumption Calendar
The Consumption Calendar widget displays meter consumption data in a calendar-based view, allowing users to monitor daily consumption patterns and identify variations over time.
Add the Consumption Calendar Widget
- Click the + icon.
- Drag and drop the Consumption Calendar Widget onto the display.
- Select the Consumption Calendar Widget.
- Use Zoom In and Zoom Out to adjust the widget view.
- Click Settings to open the Configure Data panel.
- Configure the required Consumption Calendar settings.
- Click Save.
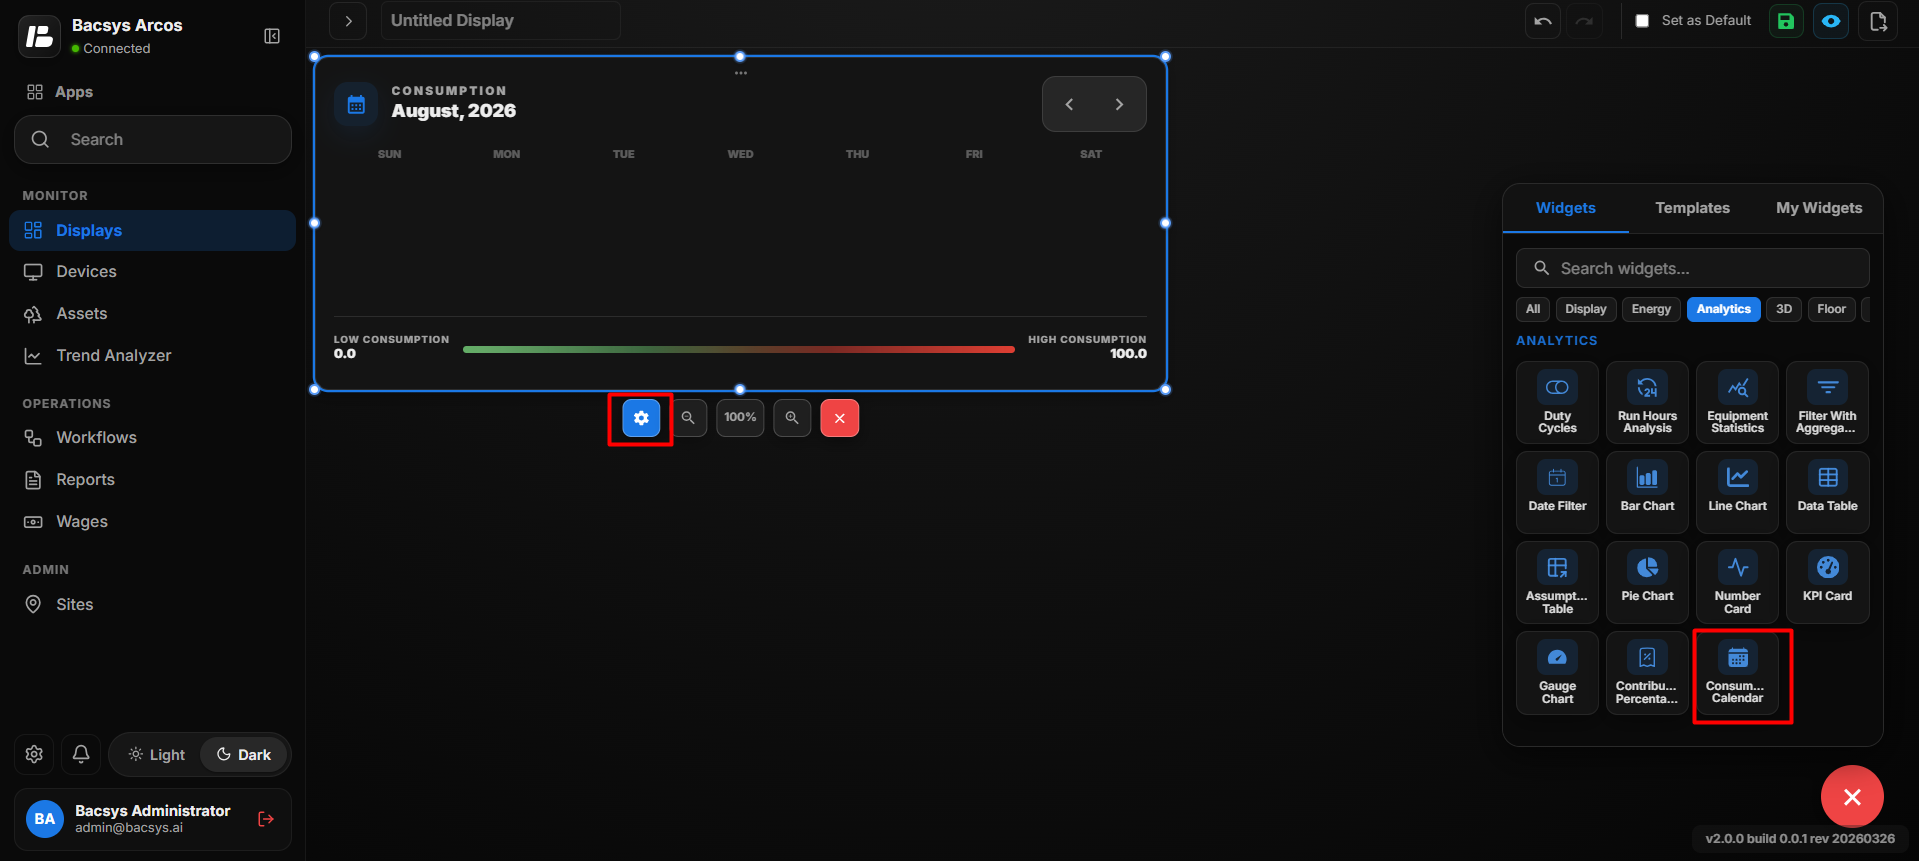 Add Consumption Calendar
Consumption Calendar Settings
| Option | Description |
|---|---|
| Title | Enter the title to be displayed for the Consumption Calendar. |
| Poll Frequency (Seconds) | Specify how frequently the consumption data is refreshed. |
| Range Start Color | Select the starting color for the consumption range from the available color palette. |
| Range End Color | Select the ending color for the consumption range from the available color palette. |
| Default Date | Select the default date used when the Consumption Calendar is loaded. |
| Select Meter Reading | Select the meter reading point used to retrieve consumption data. Click Browse Hierarchy to navigate through Network → Device → Point. |
| Show Background | Use the toggle button to show or hide the widget background. |
| Hide Header | Use the toggle button to show or hide the widget header. |
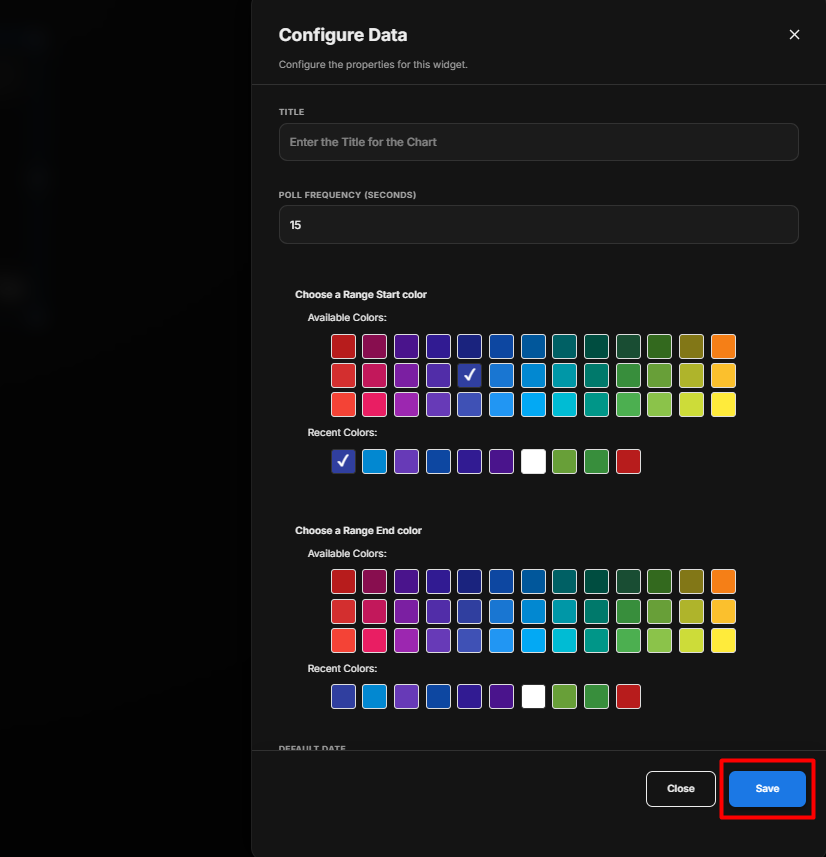 Add Consumption Calendar
Configure the Consumption Calendar
- Enter the required Title.
- Set the required Poll Frequency (Seconds).
- Select the Range Start Color to define the beginning of the consumption color range.
- Select the Range End Color to define the end of the consumption color range.
- Select the required Default Date.
- Under Select Meter Reading, click Browse Hierarchy and select the required meter reading point.
- Configure Show Background according to your requirement.
- Configure Hide Header according to your requirement.
- Review the configured settings.
- Click Save.
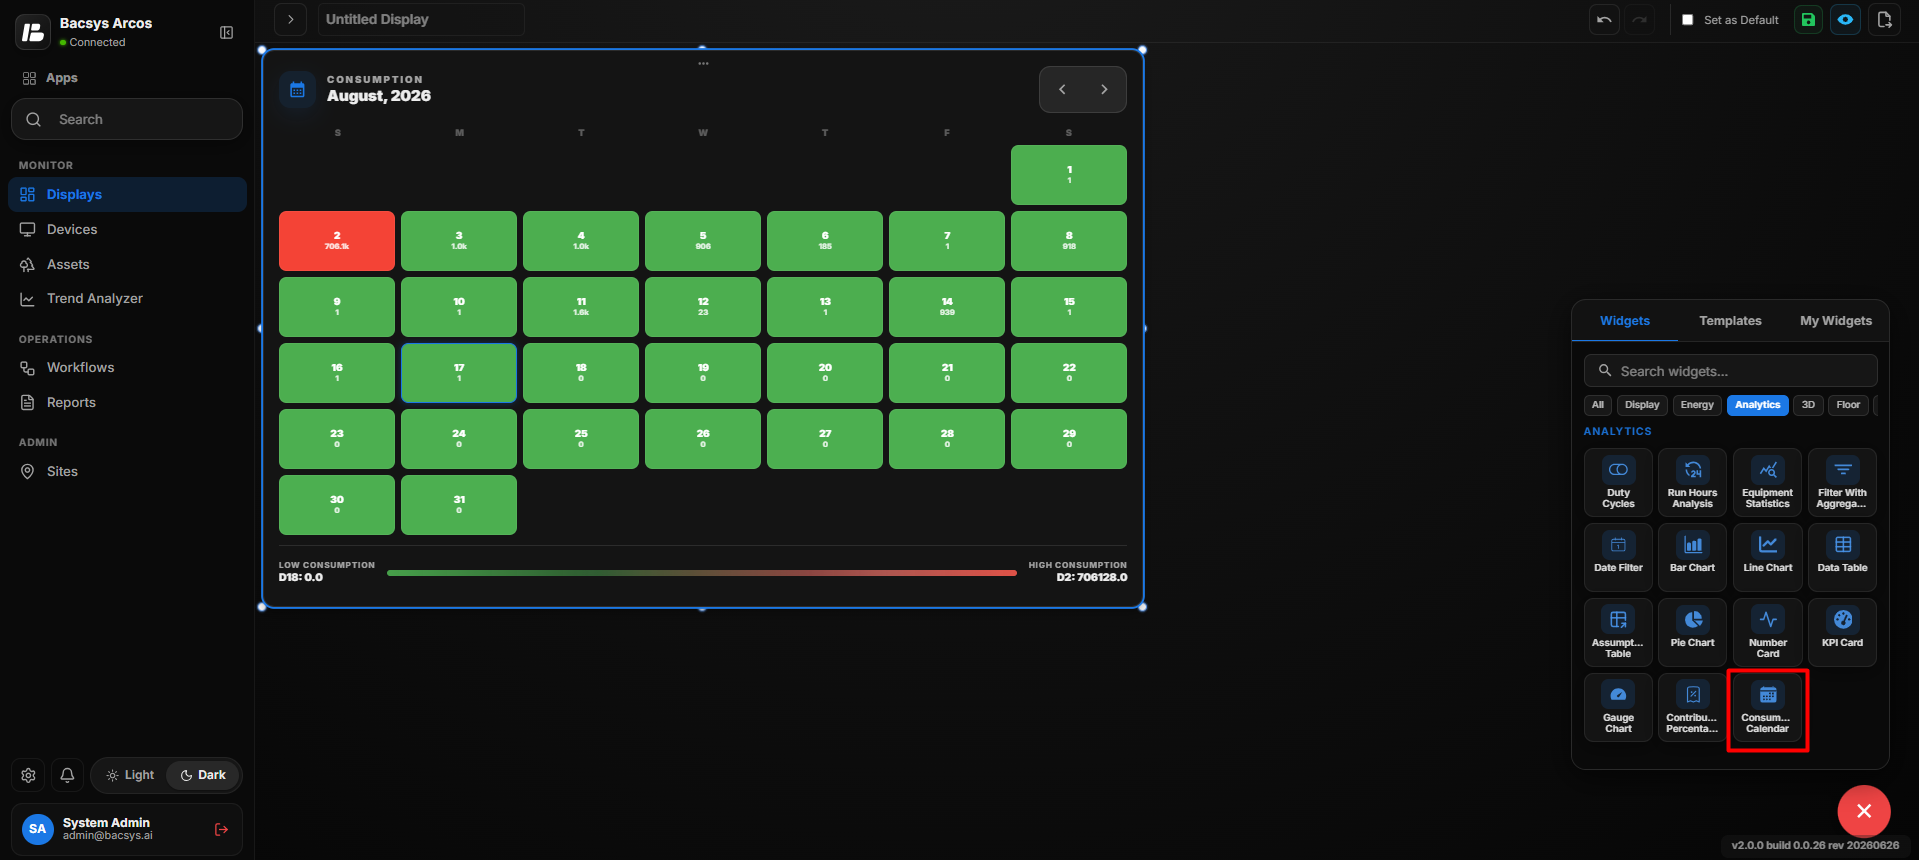 Add Consumption Calendar
After saving, the Consumption Calendar displays the selected meter's consumption data in a calendar format. The consumption values are represented using a color range from the configured Range Start Color to the Range End Color, making it easier to identify lower and higher consumption periods.
3D Visualization
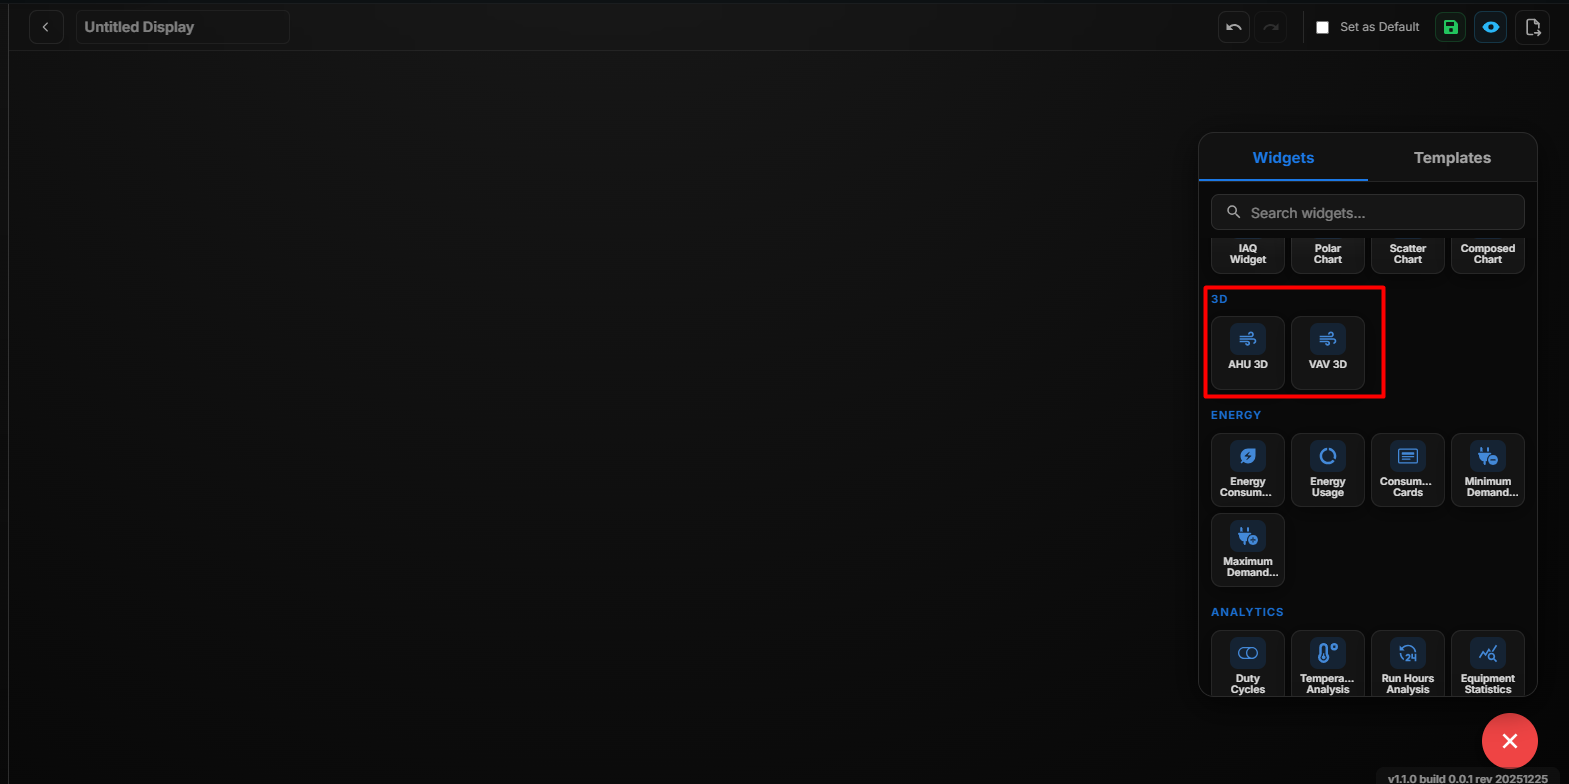 3D Visualization
The 3D Visualization module provides interactive three-dimensional models of building equipment for real-time monitoring and analysis.
| 3D Model | Description |
|---|---|
| AHU 3D | Displays a 3D model of the Air Handling Unit (AHU), allowing users to monitor parameters such as temperature, airflow, fan status, and operational conditions in a visual format. |
| VAV 3D | Displays a 3D model of the Variable Air Volume (VAV) unit, enabling visualization of airflow control, damper position, temperature, and performance metrics. |
AHU 3D
The AHU 3D Widget provides an interactive three-dimensional representation of an Air Handling Unit (AHU). Users can configure different AHU components, map real-time points to the components, and customize the 3D view.
Add and Configure the AHU 3D Widget
- Click the + icon.
- Drag and drop the AHU 3D Widget onto the display.
- Select the AHU 3D Widget.
- Click the Settings icon to open the Digital Twin Configuration panel.
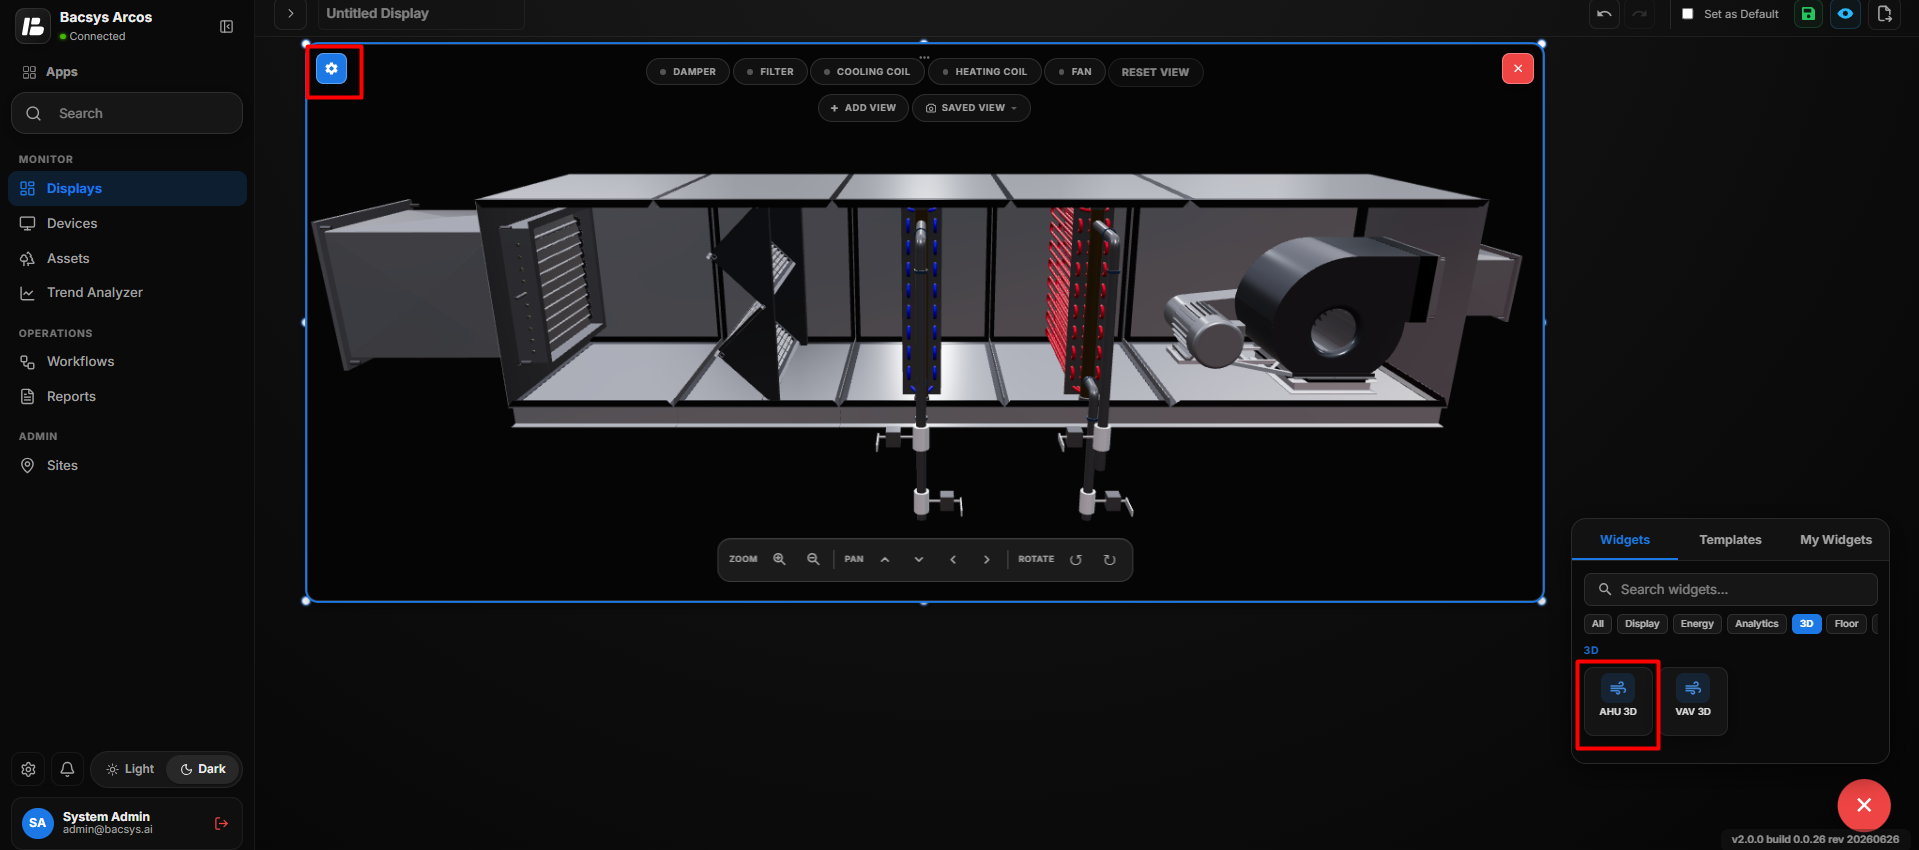 Configure AHU 3D
- Under Select Preset, click Create New Preset.
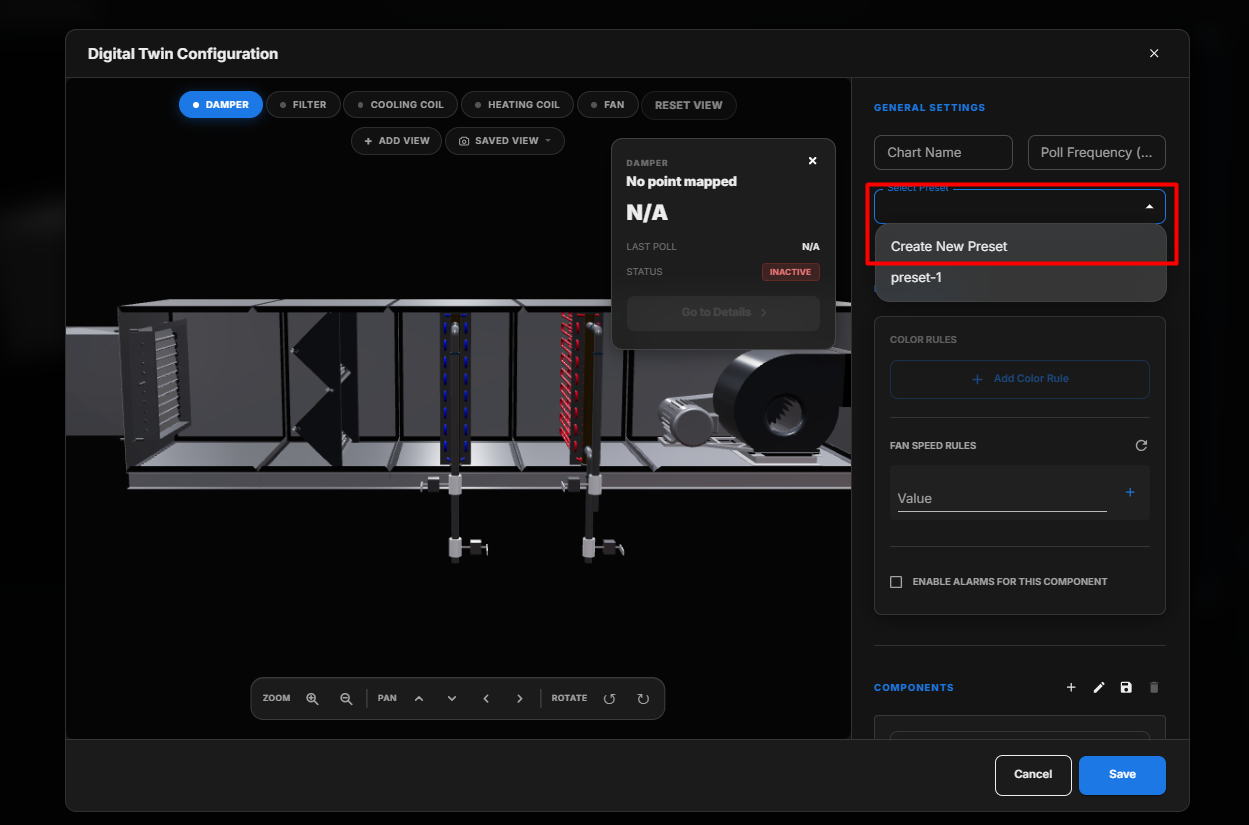 Configure AHU 3D
- Enter a name for the preset.
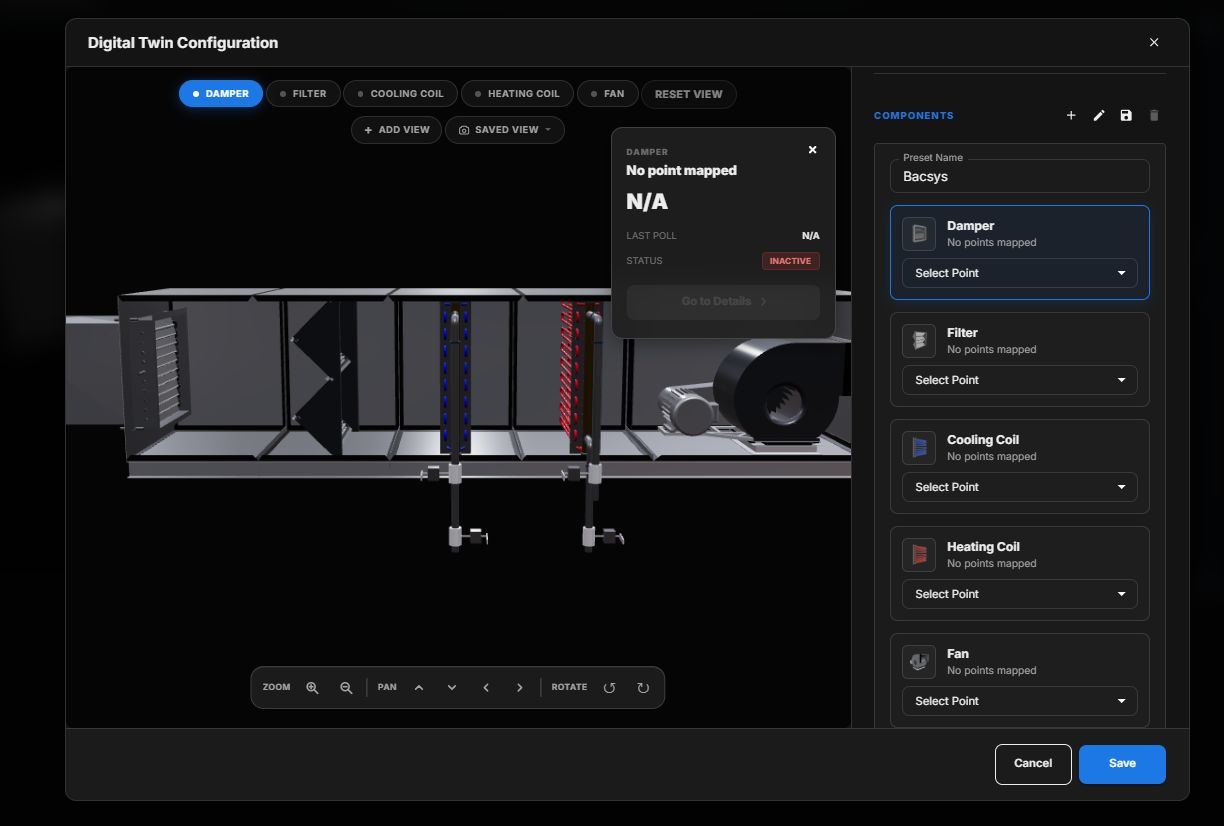 Configure AHU 3D
- Select the required point for each AHU component.
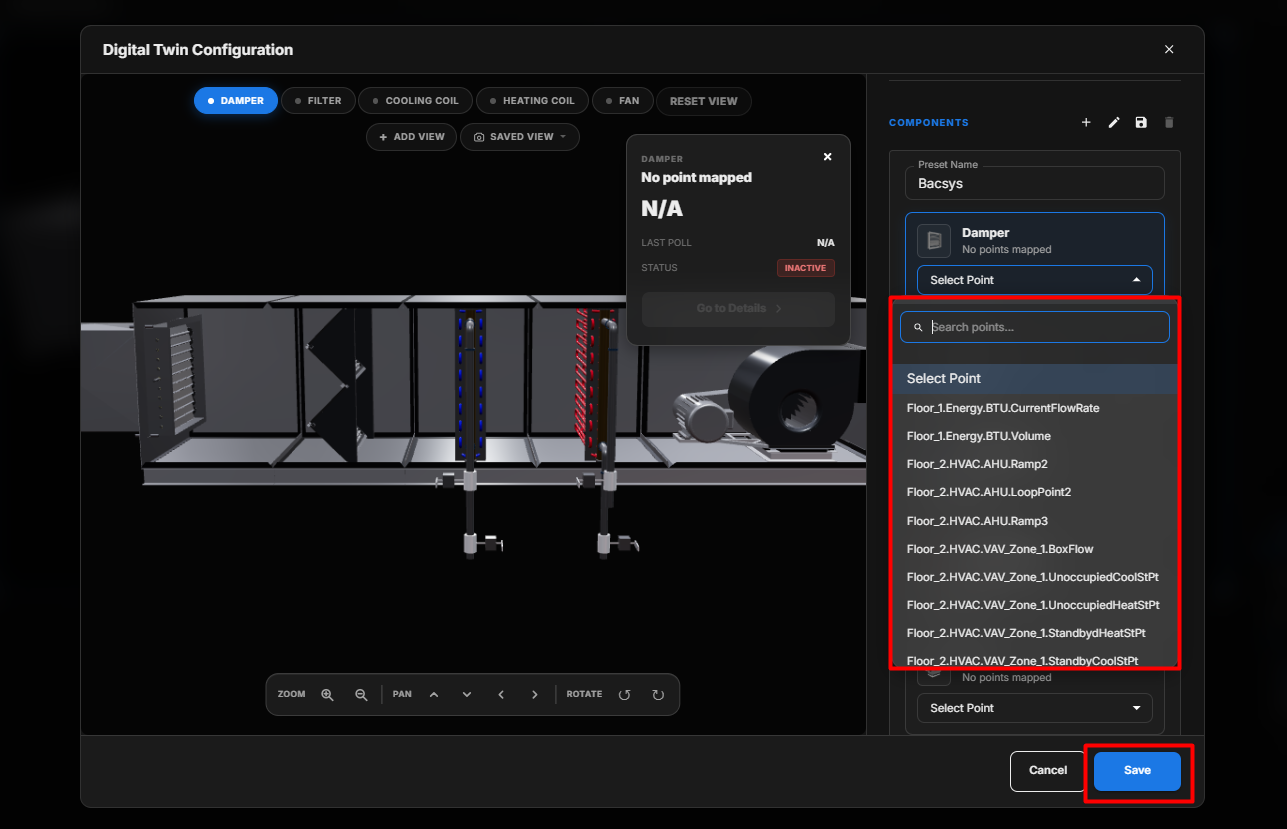 Configure AHU 3D
- Click the + icon to add additional components if required.
 Configure AHU 3D
- Configure the required points for the added components.
- Click Save to save the AHU 3D configuration.
AHU 3D Components
The AHU 3D configuration supports components such as:
- Damper
- Filter
- Cooling Coil
- Heating Coil
- Fan
Each component can be mapped to a corresponding point so that its status or value can be displayed in the 3D model.
Map Points to AHU Components
- Select the required AHU component from the Components panel.
- Click Select Point.
- Select the required point from the available points.
- The selected point is mapped to the component.
- Repeat the process for other AHU components.
- Review the mapped points before saving.
When a point is mapped successfully, the component can display its corresponding live value and status within the AHU 3D view.
Add Components
The + icon allows users to add multiple components to the AHU 3D configuration.
- Click the + icon in the Components section.
- Select the required component.
- Use the quantity controls to add multiple instances where supported.
- Click Done after selecting the required components.
- Configure the points for each component.
 Configure AHU 3D
Edit Components
The Edit option allows users to modify the configured AHU components.
- Click the Edit icon in the Components section.
 Configure AHU 3D
- Select Reorder / Remove.
- Drag components to change their order.
- Click the Delete icon to remove an unwanted component.
 Configure AHU 3D
- Click Done after completing the changes.
Preset Configuration
A Preset stores the configured AHU component and point mappings.
Users can:
- Create a new preset.
- Enter a custom preset name.
- Select an existing preset.
- Configure component point mappings.
- Modify the component configuration.
- Save the preset for future use.
 Configure AHU 3D
AHU 3D View Controls
The AHU 3D view provides controls for interacting with the model:
| Control | Description |
|---|---|
| Zoom In | Enlarges the 3D model for a closer view. |
| Zoom Out | Reduces the 3D model size to view more of the equipment. |
| Pan | Moves the 3D model horizontally or vertically within the canvas. |
| Rotate | Rotates the 3D model to view it from different angles. |
| Reset View | Restores the 3D model to its default view. |
Saved Views
The AHU 3D widget also supports saved views.
- Adjust the AHU 3D model using Zoom, Pan, and Rotate.
- Click Add View.
- Save the current camera/view position.
- Use Saved View to access previously saved views.
- Select a saved view to quickly return to the configured camera position.
 Configure AHU 3D
View Components
The AHU 3D interface provides component buttons such as Damper, Filter, Cooling Coil, Heating Coil, and Fan.
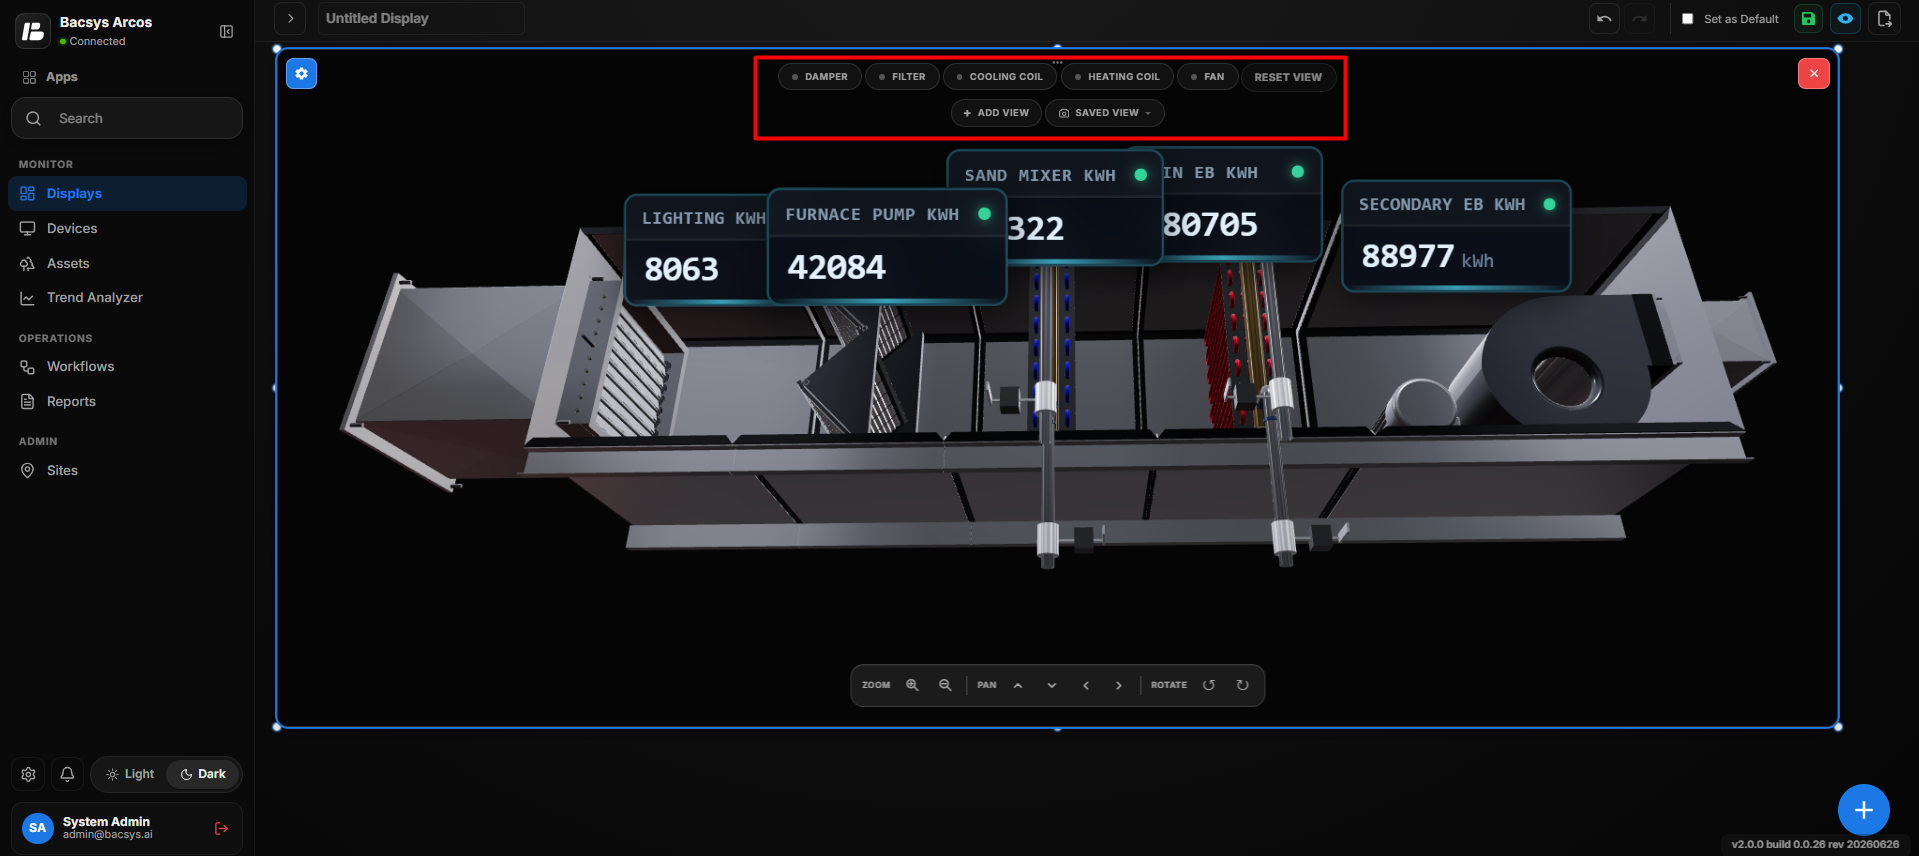 Configure AHU 3D
Clicking a component button allows users to focus on or view the corresponding component in the AHU model.
Configure and Save
After completing the AHU 3D configuration:
- Verify the preset name.
- Verify all component point mappings.
- Verify the required components are present.
- Review the 3D model and saved views.
- Click Save.
- The configured AHU 3D model is displayed on the display.
VAV 3D Widget
The VAV (Variable Air Volume) 3D Widget provides an interactive three-dimensional representation of a VAV system. Users can configure VAV components, map real-time points to the components, and customize the 3D view.
Add and Configure the VAV 3D Widget
- Click the + icon.
- Drag and drop the VAV 3D Widget onto the display.
- Select the VAV 3D Widget.
- Click the Settings icon to open the VAV Configuration panel.
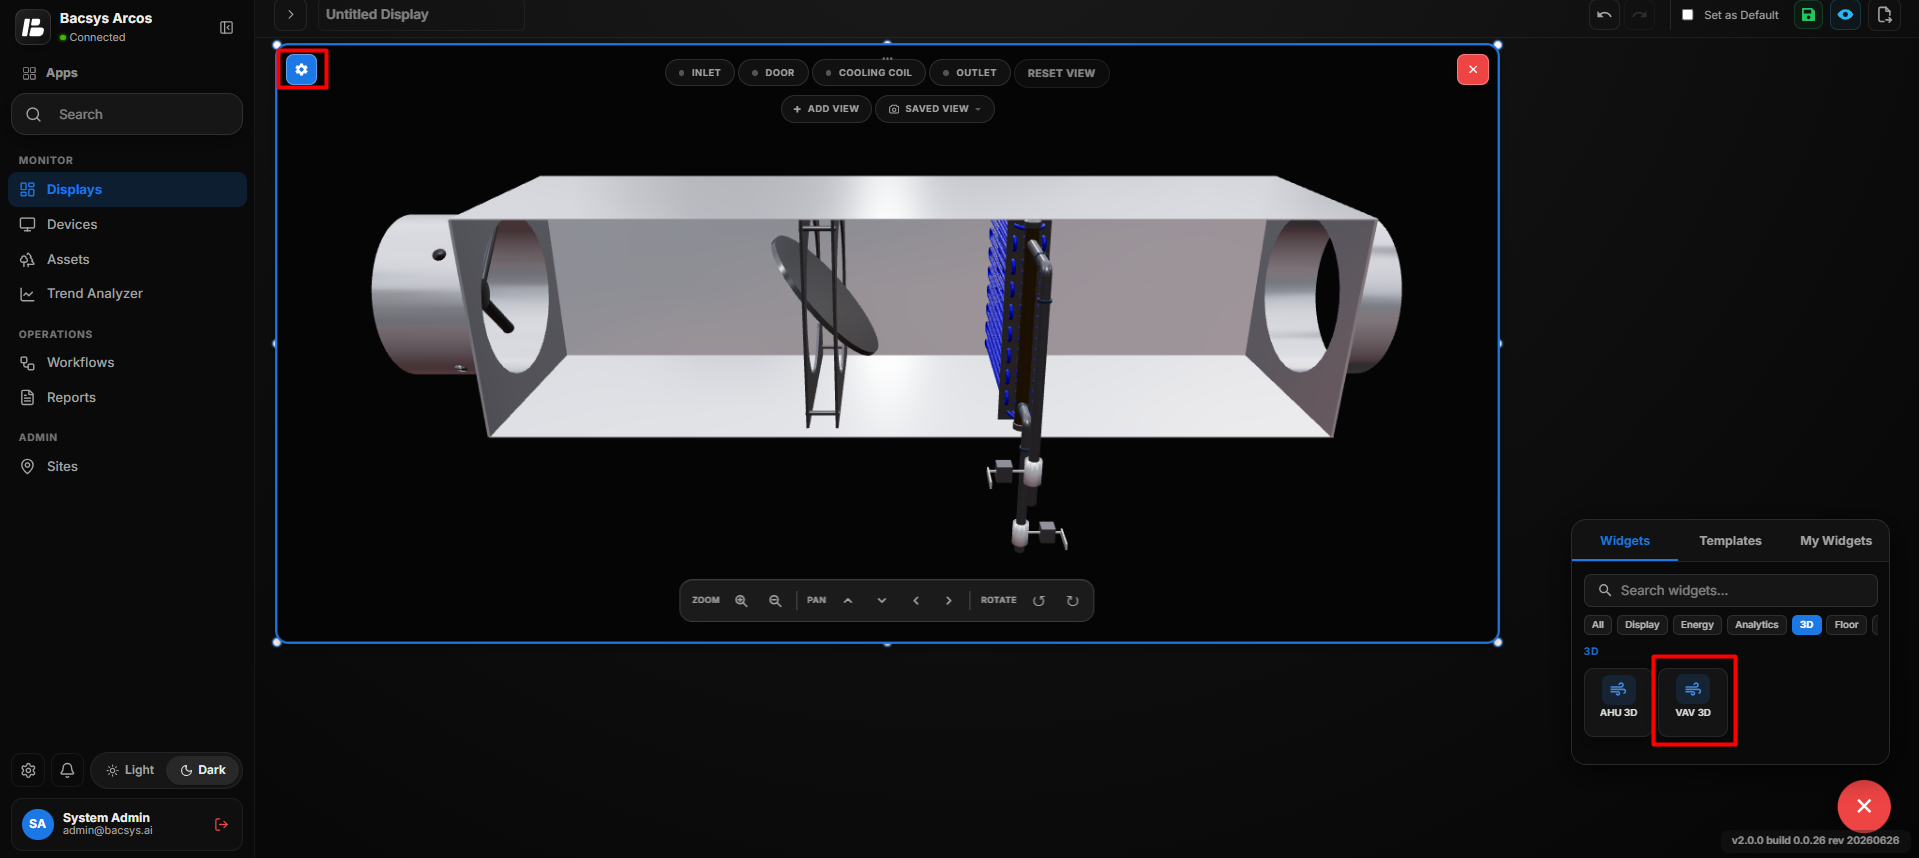
- Click Create New Preset.
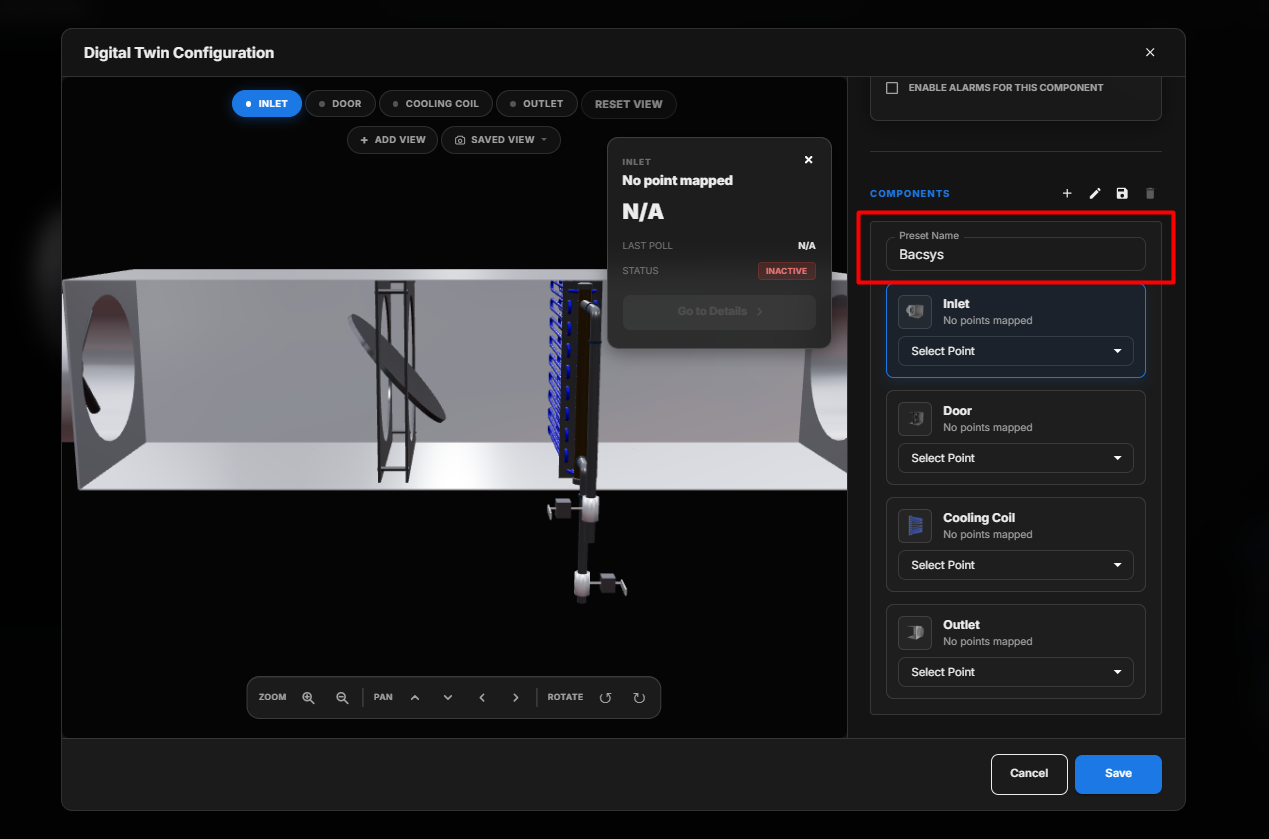
- Enter a name for the preset.
- Select the required points for the VAV components.
- Configure the required component mappings.
- Click Save.
VAV Components
The VAV 3D Widget supports the following components:
- Inlet
- Door
- Cooling Coil
- Outlet
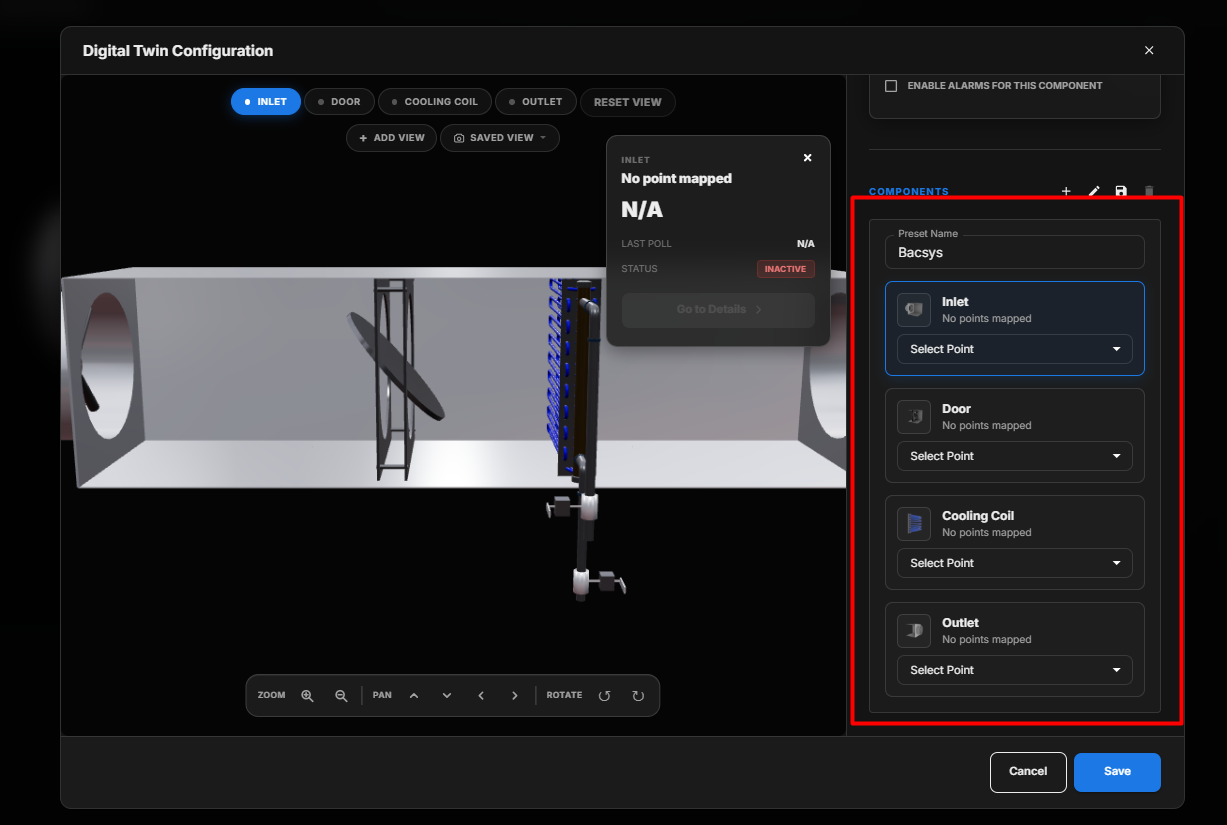
Each component can be mapped to a corresponding point to display its live value or status.
Map Points to VAV Components
- Select the required component.
- Click Select Point.
- Select the required point from the available points.
- The selected point is mapped to the component.
- Repeat the process for the remaining components.
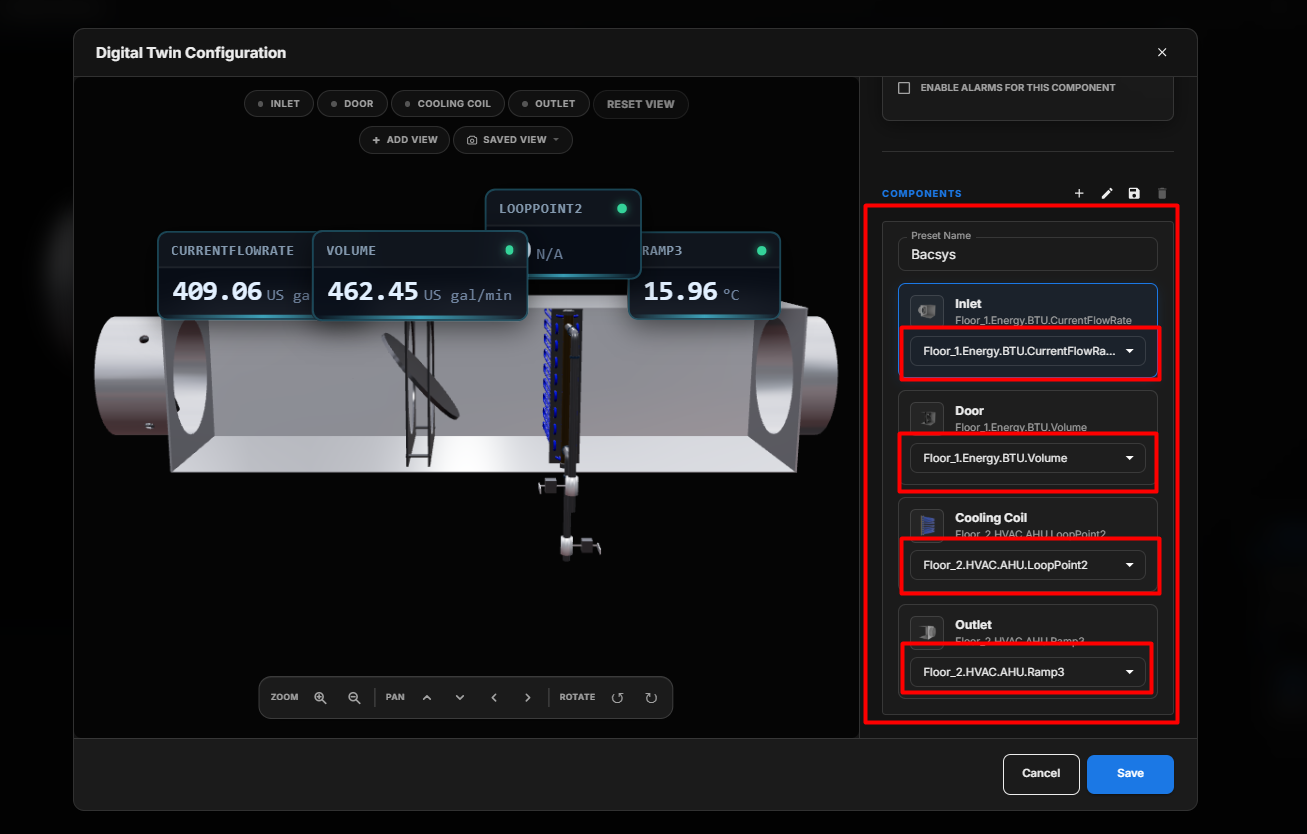
For example, points can be mapped to the Inlet, Door, Cooling Coil, and Outlet components.
Add Components
The + icon in the Components section allows users to add additional components.
- Click the + icon.
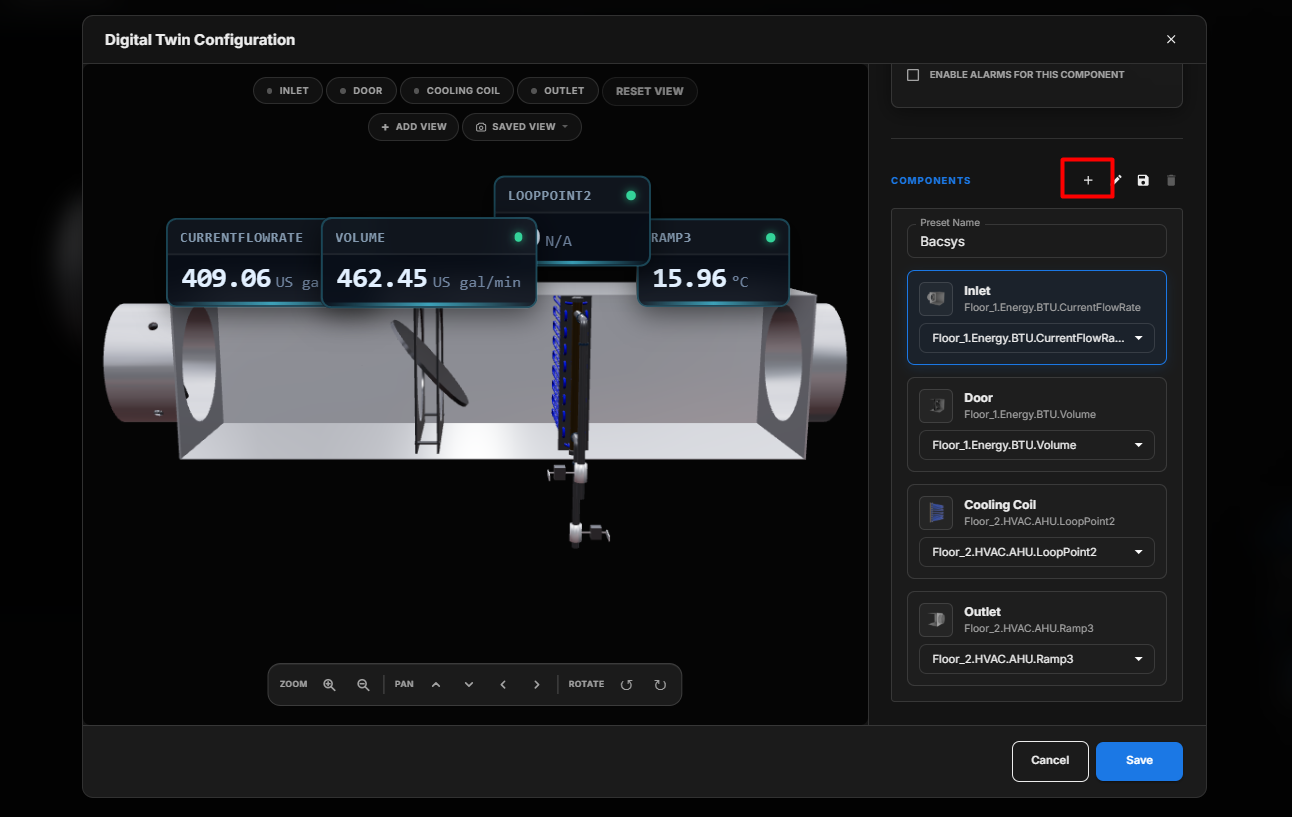
- Select the required component.
- Add the component to the configuration.
- Configure its corresponding point.
- Repeat the process to add multiple components where required.
- Click Done after completing the selection.
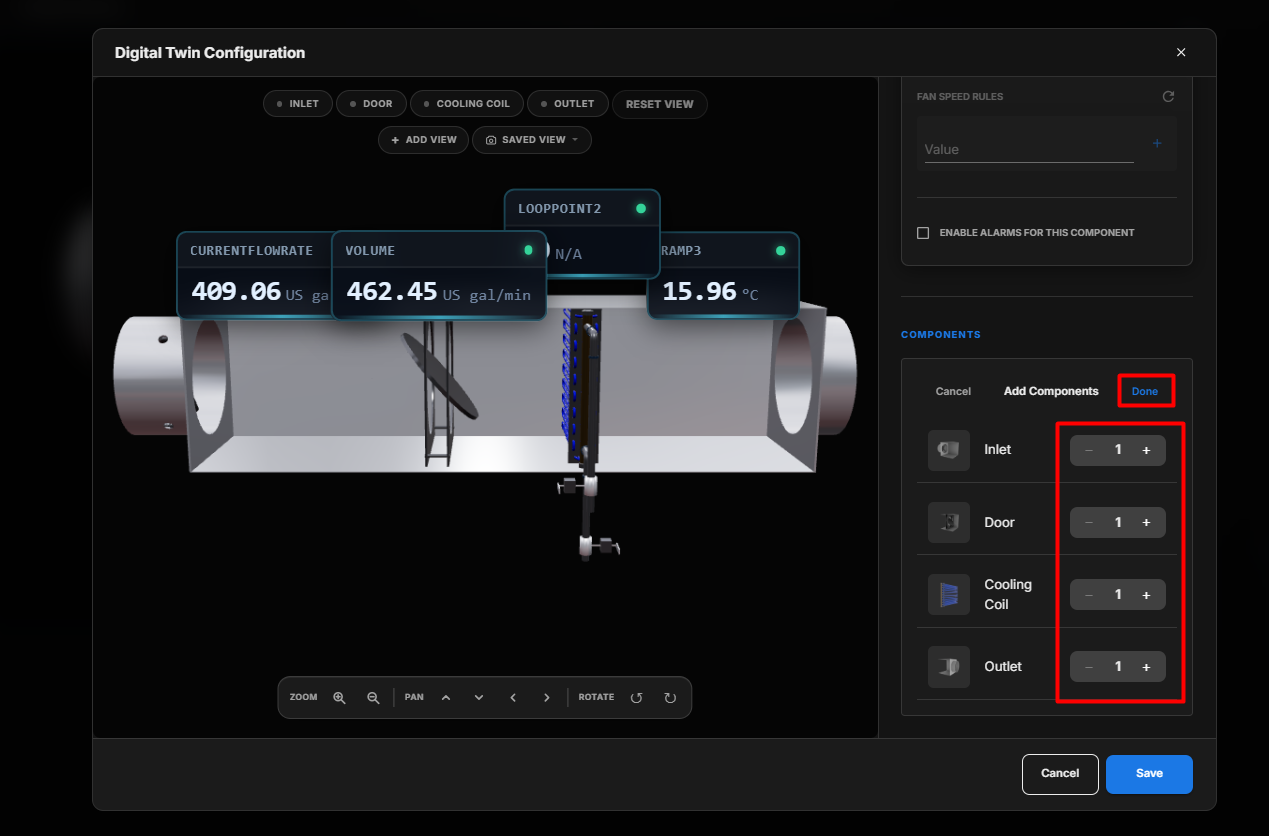
Edit Components
The Edit option allows users to modify the VAV component configuration.
- Click the Edit icon.
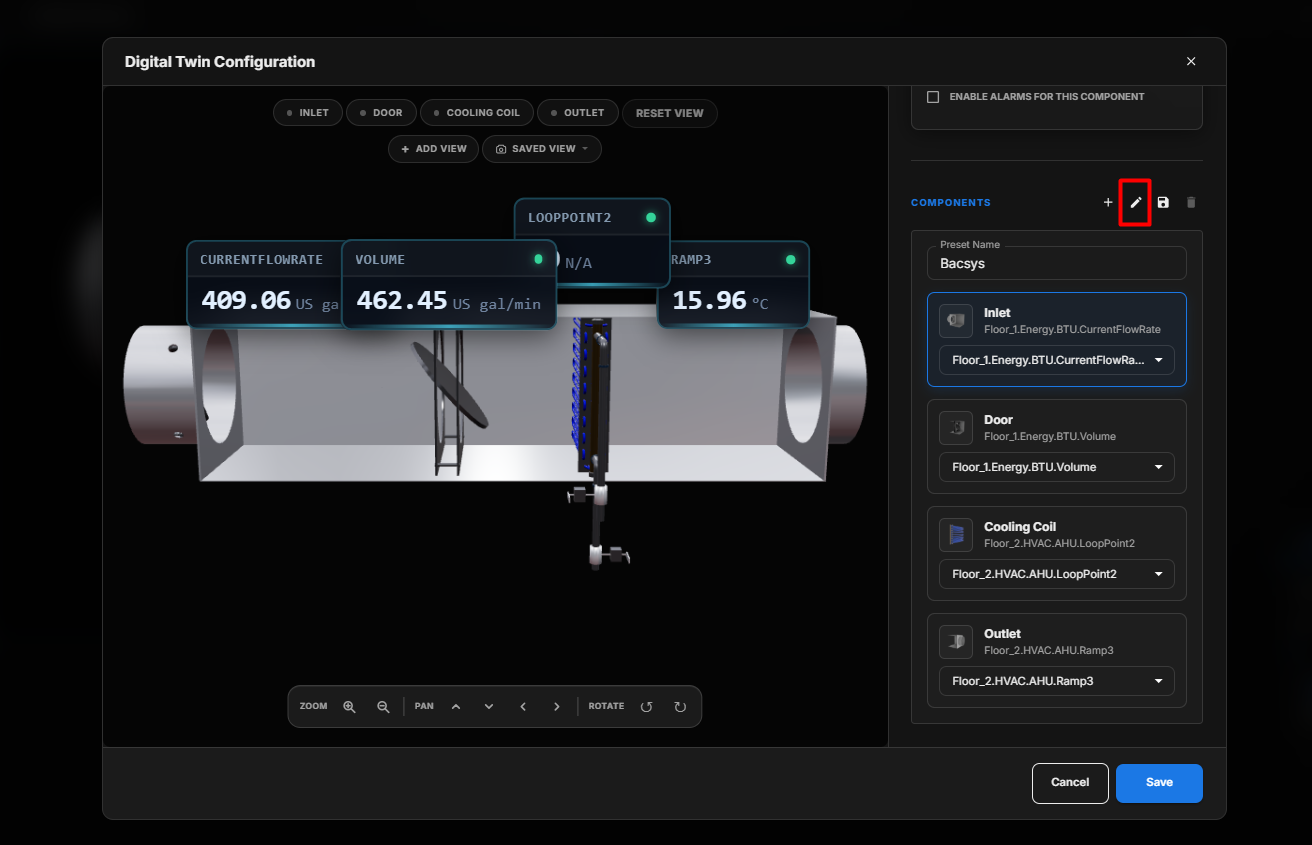
- Use Reorder / Remove to manage the components.
- Drag and drop components to change their order.
- Click the Delete icon to remove a component.
- Click Done after completing the changes.
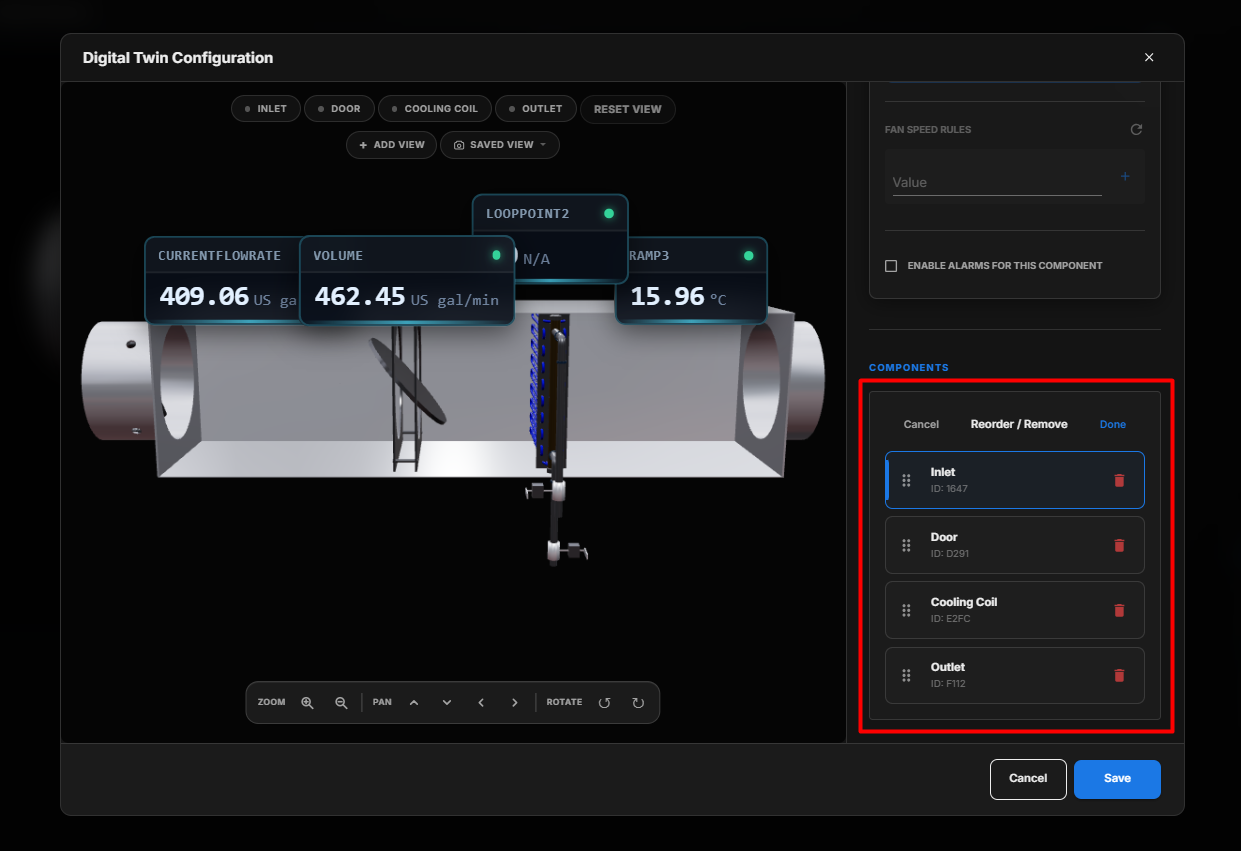
Preset Configuration
A Preset stores the VAV component configuration and point mappings.
Users can:
- Create a new preset.
- Enter a custom preset name.
- Select an existing preset.
- Map points to VAV components.
- Add multiple components.
- Reorder or remove components.
- Save the configuration for future use.
VAV 3D View Controls
The VAV 3D Widget provides controls for interacting with the 3D model:
| Control | Description |
|---|---|
| Zoom In | Enlarges the VAV 3D model for a closer view. |
| Zoom Out | Reduces the model size to view more of the system. |
| Pan | Moves the 3D model within the canvas. |
| Rotate | Rotates the 3D model to view it from different angles. |
| Reset View | Restores the VAV model to its default view. |
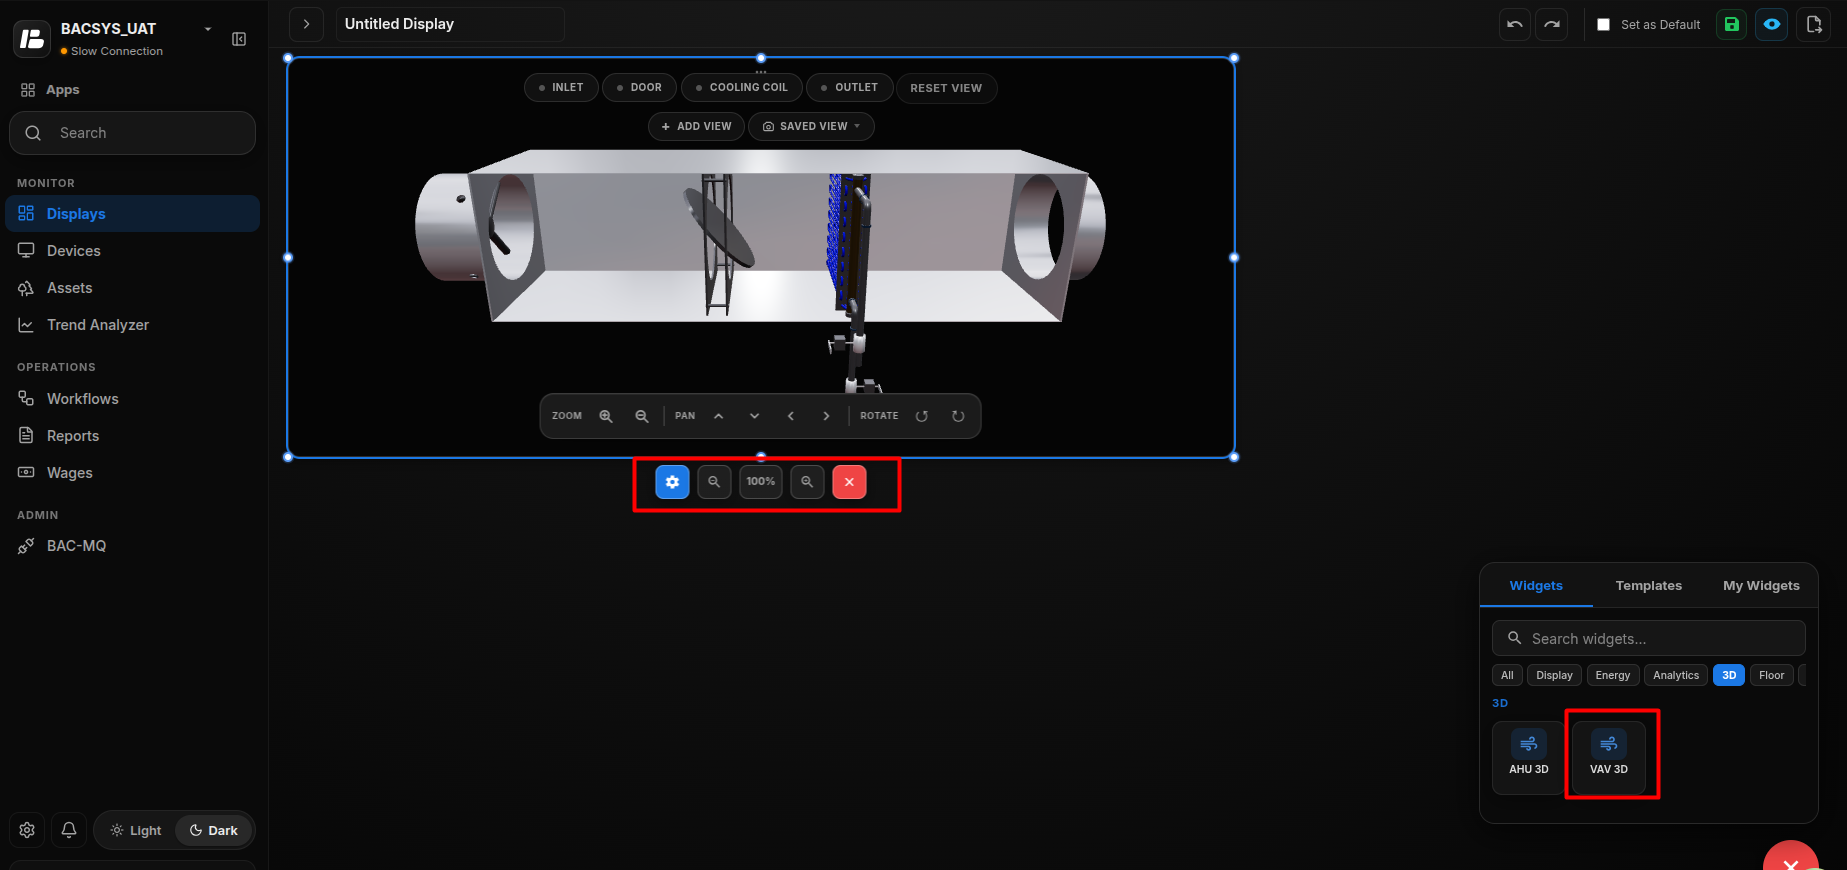
Component View
The VAV 3D interface provides component buttons such as Inlet, Door, Cooling Coil, and Outlet.
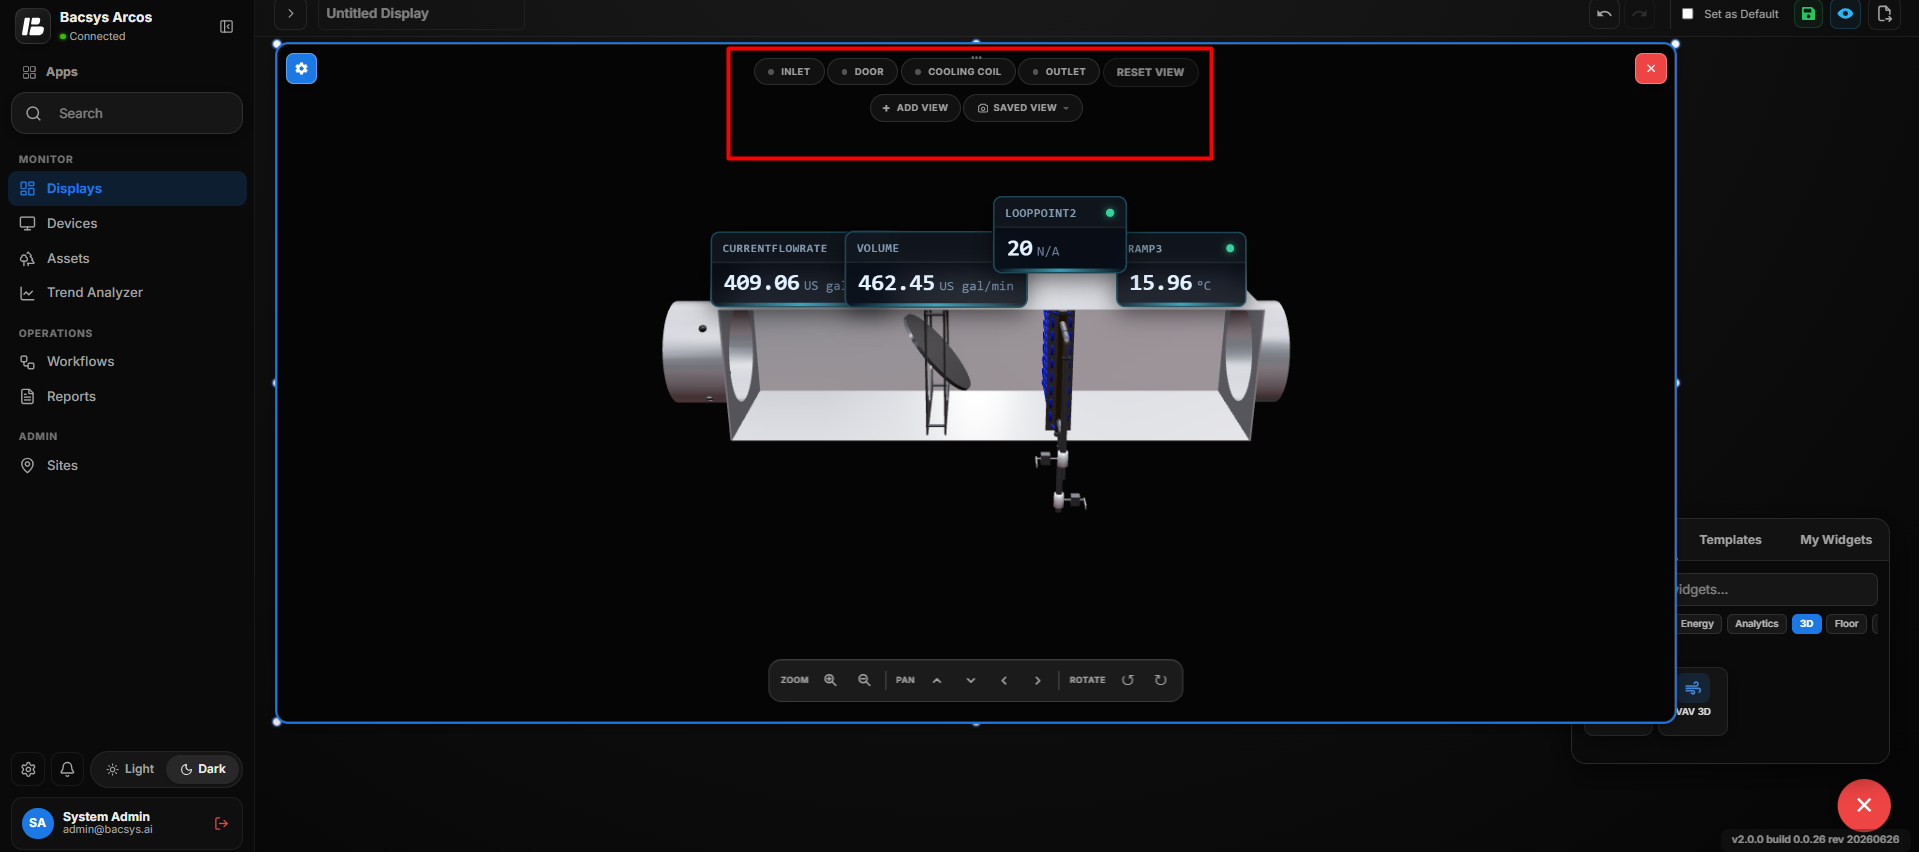
Clicking a component allows users to focus on or view the corresponding component within the VAV model.
Saved Views
The VAV 3D Widget supports saved views for quickly returning to a configured camera position.
- Adjust the VAV model using Zoom, Pan, and Rotate.
- Click Add View.
- Save the current view.
- Click Saved View to access previously saved views.
- Select a saved view to restore the saved camera position.
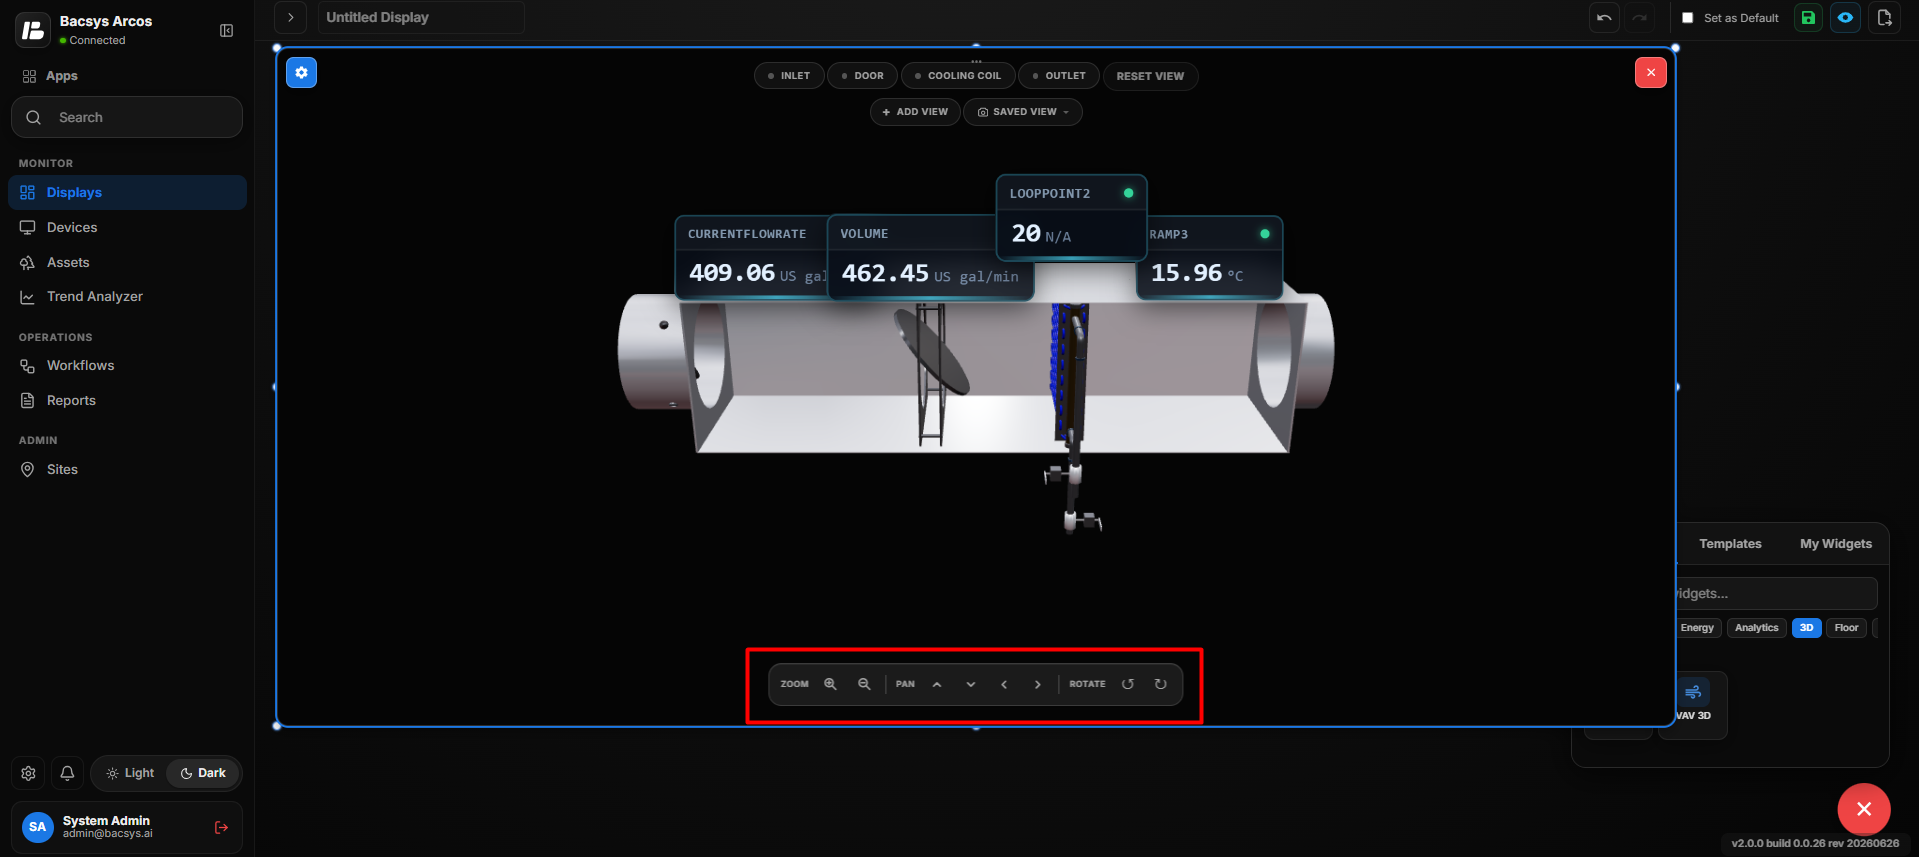
Configure and Save
After completing the VAV configuration:
- Verify the preset name.
- Verify all component point mappings.
- Verify the required components are configured.
- Review the VAV 3D model.
- Review the saved views if configured.
- Click Save.
- The configured VAV 3D model is displayed on the display.
Floor Layout Widgets
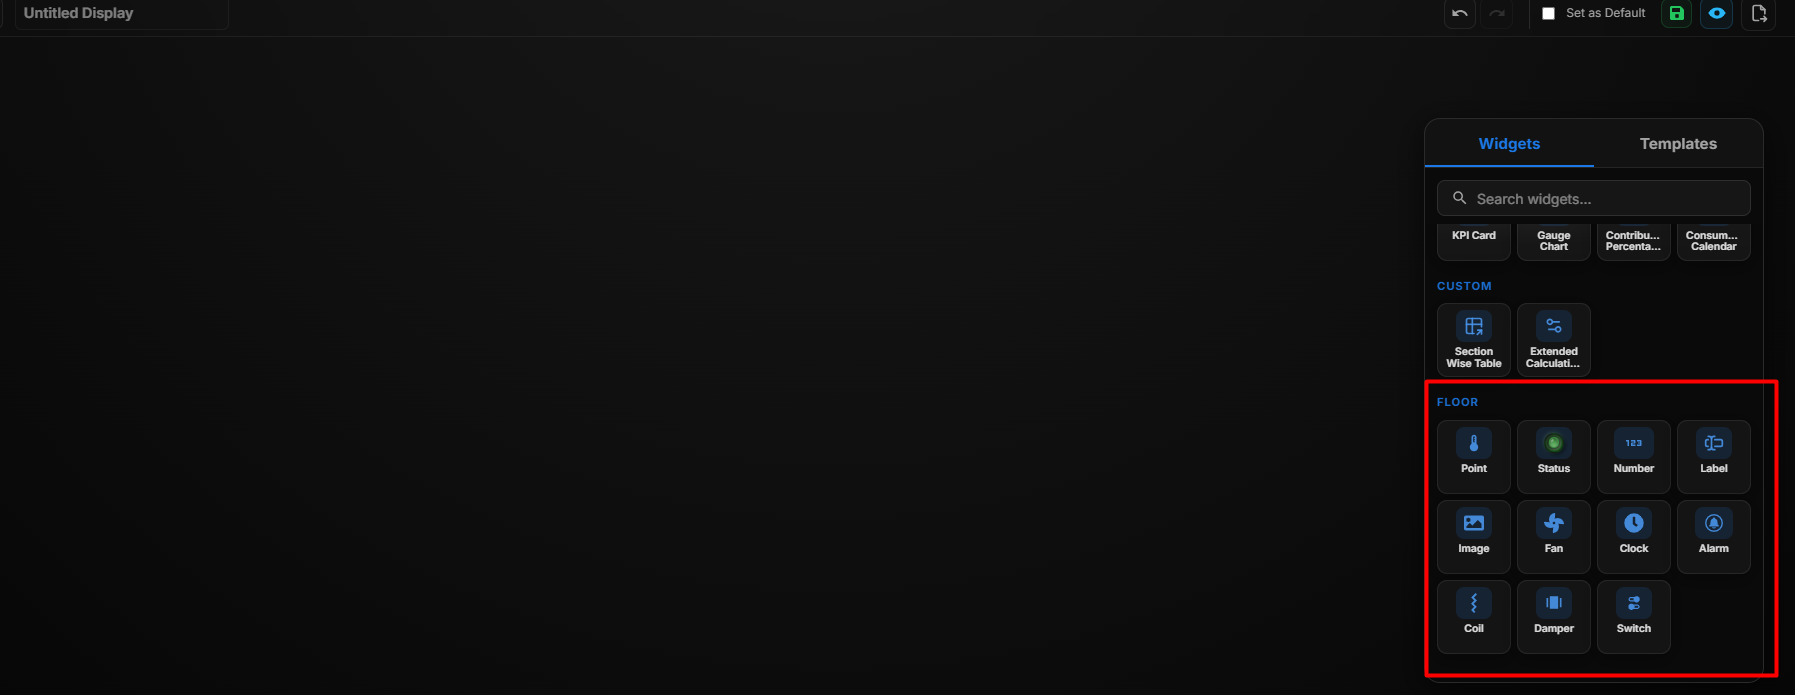 Floor Layout Widgets
The Floor View module provides interactive elements to monitor and control equipment directly from the floor layout.
| Widget | Description |
|---|---|
| Point | Displays real-time data values from a selected data point on the floor layout. |
| Status | Shows the operational status of equipment (e.g., ON/OFF, Active/Inactive, Normal/Fault). |
| Number | Displays a numeric value associated with a selected data point. |
| Label | Adds static text labels for identifying rooms, equipment, or sections. |
| Image | Embeds an image within the floor layout for visual reference. |
| Fan | Represents a fan component with visual indication of its operational status. |
| Clock | Displays the current time within the floor layout. |
| Alarm | Indicates alarm conditions visually on the floor plan. |
| Call | Provides an interactive element for call or notification triggering. |
| Damper | Displays damper position and operational status within HVAC systems. |
| Switch | Allows ON/OFF control of connected equipment directly from the floor view. |
After performing all the desired customizations, click the Update button to apply and reflect the changes in the widget.
Add and Configure the Floor Point Widget
The Floor Point Widget allows users to display real-time values from a selected data point directly on a floor layout.
Add the Floor Image
- Open the Floor layout.
- From the Display widget list, drag and drop the Image Widget onto the floor layout.
- Configure the image to represent the required floor or area.
- Position and resize the image according to the floor layout.
- Save the image configuration.
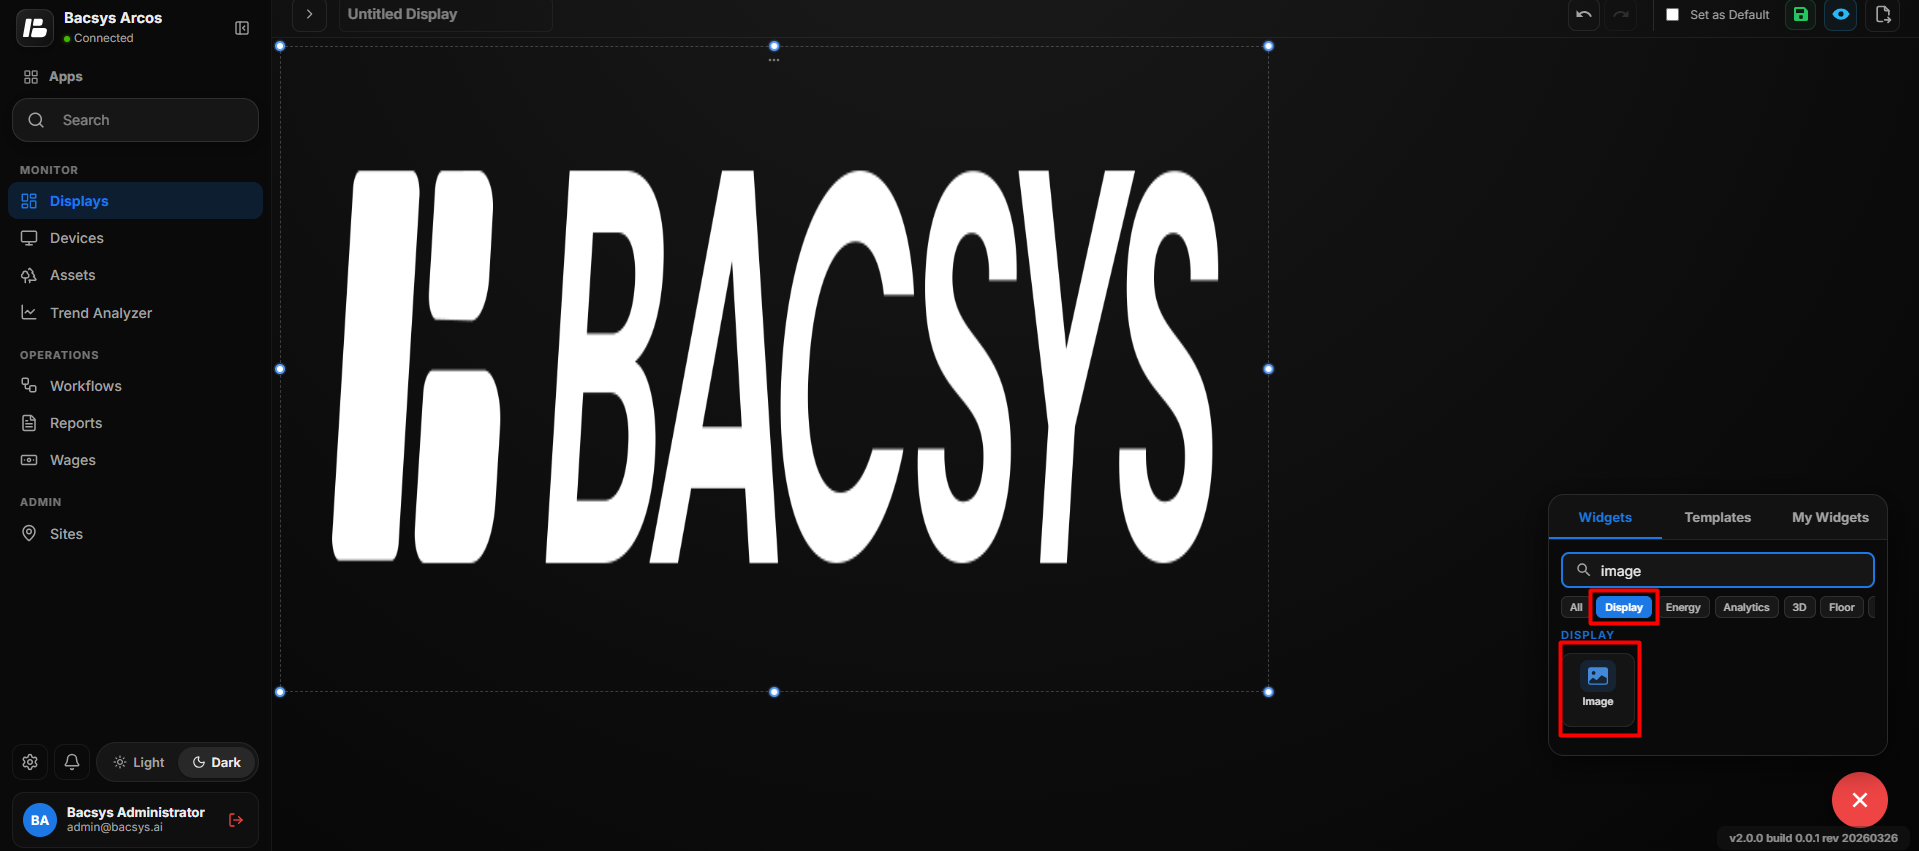 Add the Floor Image
Add the Point Widget
- Drag and drop the Point Widget onto the floor image.
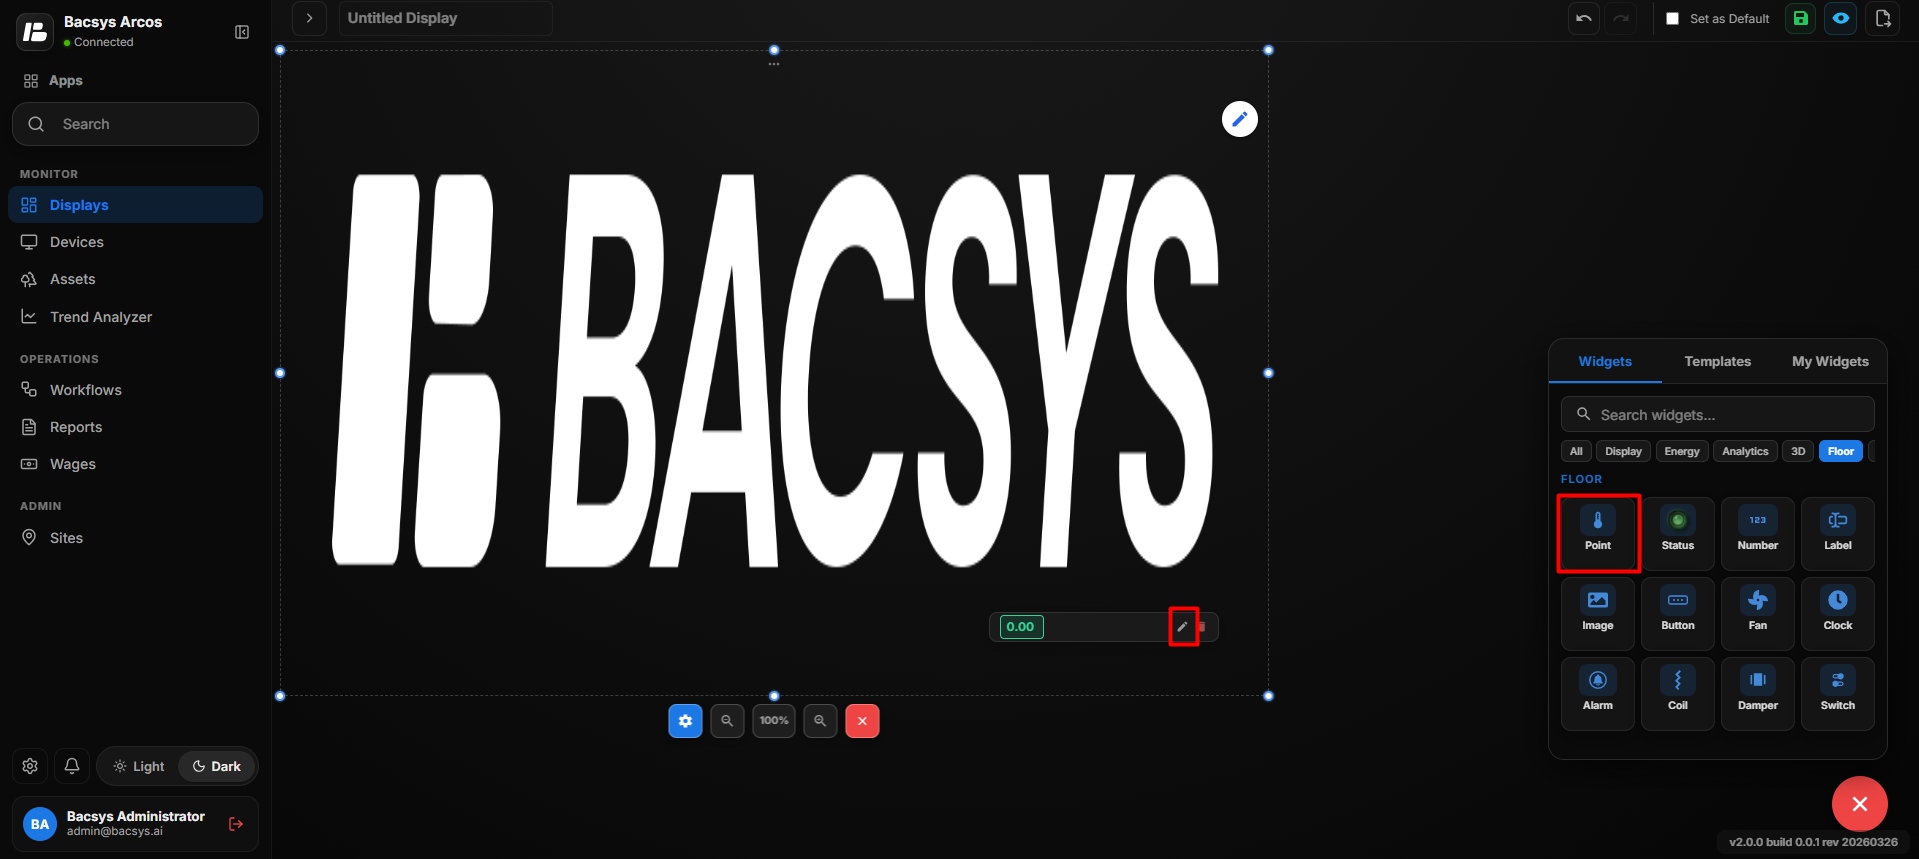 Add the Point Widget
- Position the Point Widget at the required location on the floor layout.
- Select the Point Widget to display its widget toolbar.
- Click Edit to open the Point Config panel.
- Configure the required Point Widget properties.
- Click Save Changes to save the configuration.
Point Configuration
The Point Config panel allows users to configure the appearance, connected point, and display properties of the Point Widget.
General Properties
| Setting | Description |
|---|---|
| Display Label | Defines the label displayed for the point on the floor layout. |
| Widget Scale | Controls the size of the Point Widget on the floor layout. |
| Connected Point | Selects the data point to be displayed by the widget. |
| Browse Hierarchy | Allows users to browse the Network → Device → Point hierarchy and select the required point. |
| Font Size | Sets the font size of the displayed point value. |
| Bold | Displays the point value in bold text when enabled. |
| Italic | Displays the point value in italic text when enabled. |
| Show Name | Displays the name of the connected point. |
| Transparent BG | Makes the widget background transparent when enabled. |
| Text Color | Sets the color of the displayed point text. |
| Widget Color | Sets the color of the Point Widget. |
| Recent Colors | Provides quick access to previously selected colors. |
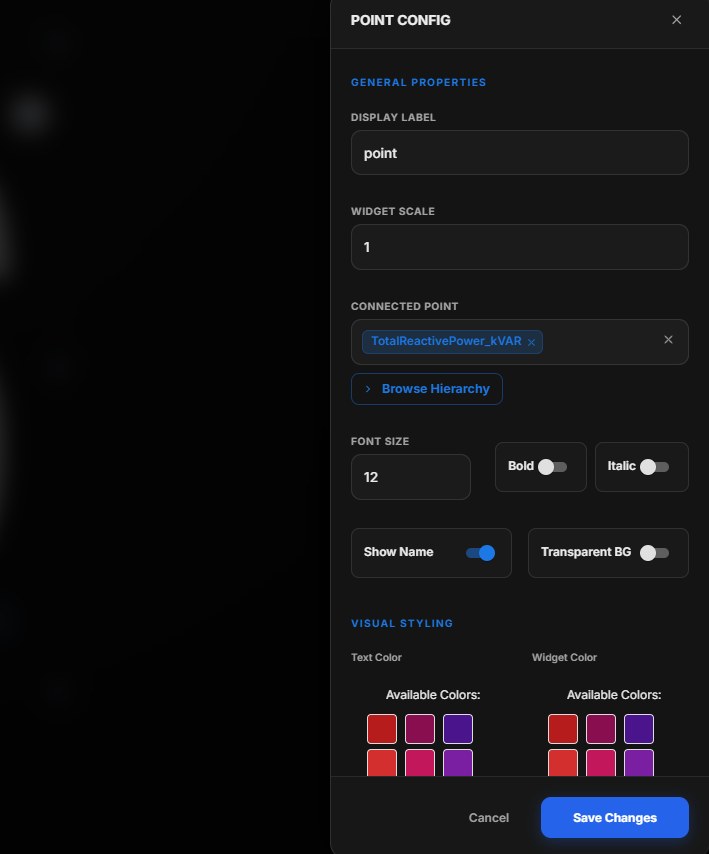 General Properties
Configure the Connected Point
- Click Browse Hierarchy under Connected Point.
- Navigate through Network → Device → Point.
- Select the required data point.
- Verify that the selected point appears in the Connected Point field.
- Configure the Display Label, Widget Scale, Font Size, and other required properties.
- Configure Bold, Italic, Show Name, and Transparent BG as required.
- Select the required Text Color and Widget Color.
- Click Save Changes.
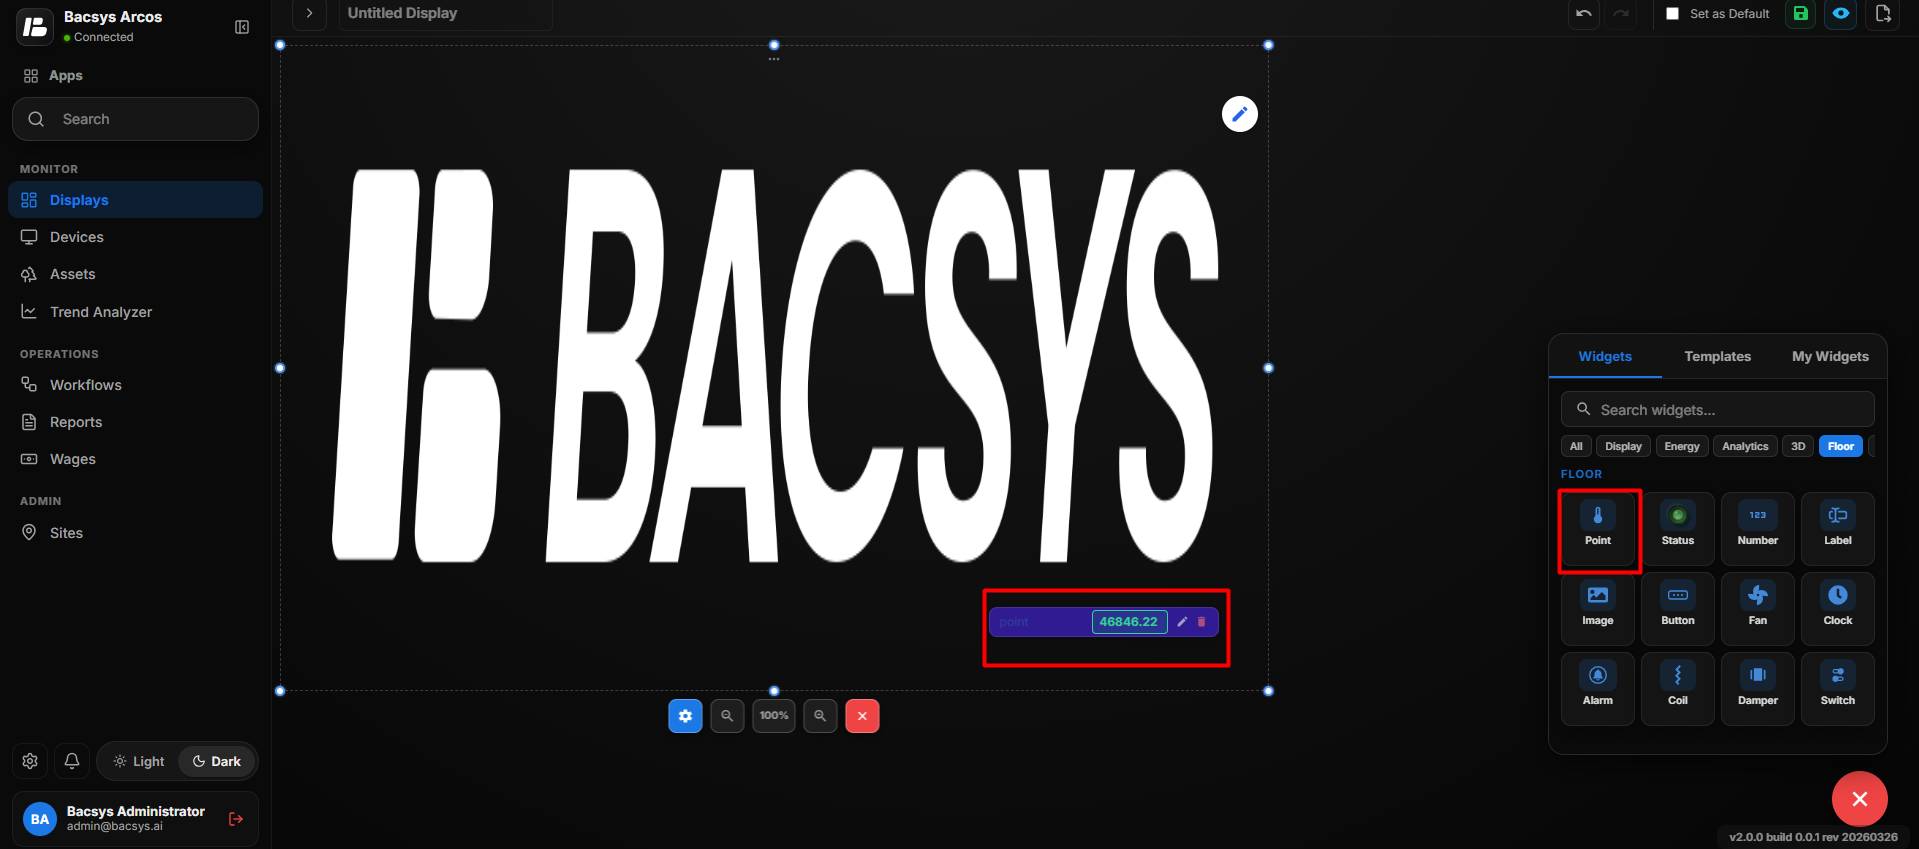 Configure the Connected Point
Update the Floor Point
After saving the configuration:
- The selected data point is connected to the Point Widget.
- The Point Widget displays the configured point value on the floor layout.
- The configured label and styling are applied to the widget.
- The Point Widget remains positioned at the selected location on the floor image.
The same process can be repeated to add and configure multiple Point Widgets at different locations on the floor layout.
Add and Configure the Status Widget
The Status Widget allows users to display the operational status of equipment or systems on the floor layout.
- Drag and drop the Status Widget onto the floor layout.
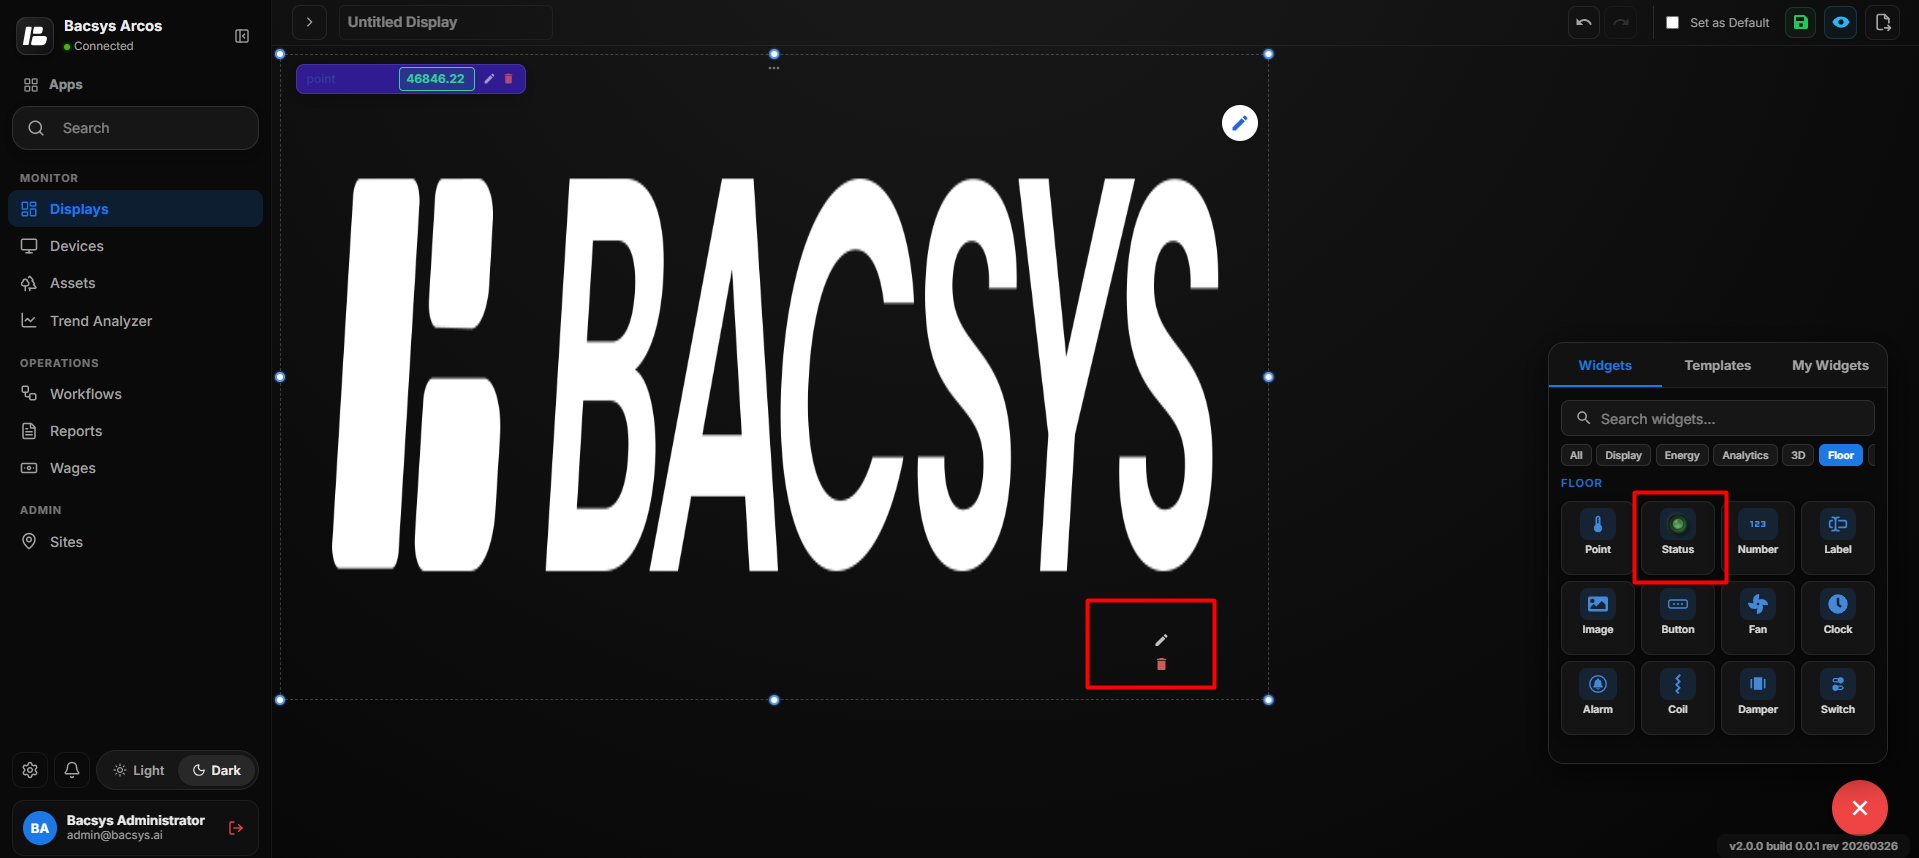 Add the Status Widget
- Select the Status Widget and click Edit to open the configuration panel.
- Under Layout Type, select the required status layout:
- Single Status
- RYB Phase
- Select Single Status to configure a single equipment status.
- Under Value Type, select the required value type:
- Multistate Input
- Binary ON/OFF
- Select Multistate Input when the status point contains multiple predefined states.
| Setting | Description |
|---|---|
| Layout Type | Defines the status display layout. Available options include Single Status and RYB Phase. |
| Value Type | Defines the type of status value. Available options include Multistate Input and Binary ON/OFF. |
| Primary Point | Selects the main data point used to determine the equipment status. |
| Browse Hierarchy | Allows users to browse the Network → Device → Point hierarchy and select the required point. |
| Multistate Values | Defines the values or states associated with a multistate input. |
| Connected Display | Selects a display that can be opened when the status widget is used for navigation. |
| Display Label | Defines the label displayed for the status widget on the floor layout. |
| Widget Scale | Controls the size of the Status Widget on the floor layout. |
| Show Name | Displays the name of the connected point when enabled. |
| Transparent BG | Makes the widget background transparent when enabled. |
| Text Color | Sets the color of the status text. |
| Widget Color | Sets the color of the Status Widget. |
| Recent Colors | Provides quick access to previously selected colors. |
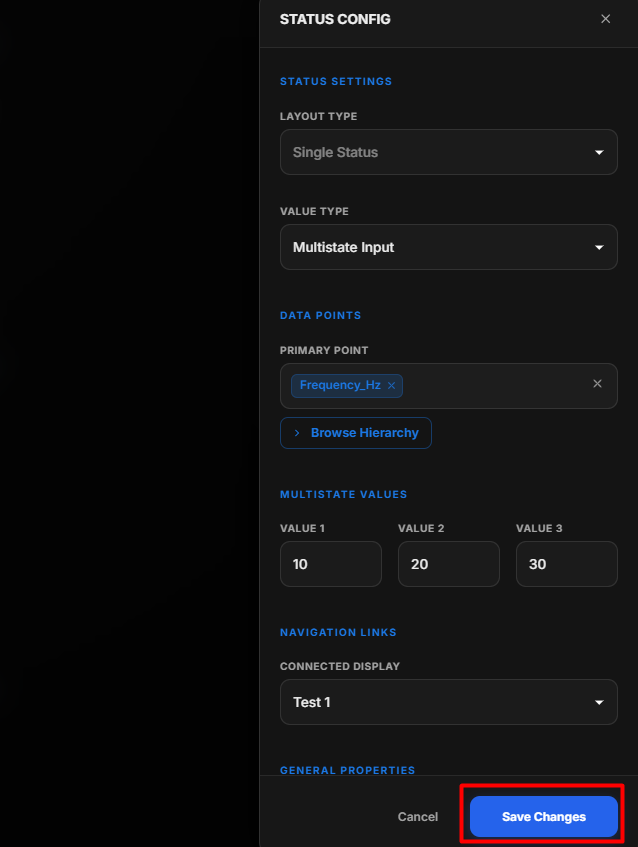 Status Widget Configuration
- Click Save Changes to save the Status Widget configuration.
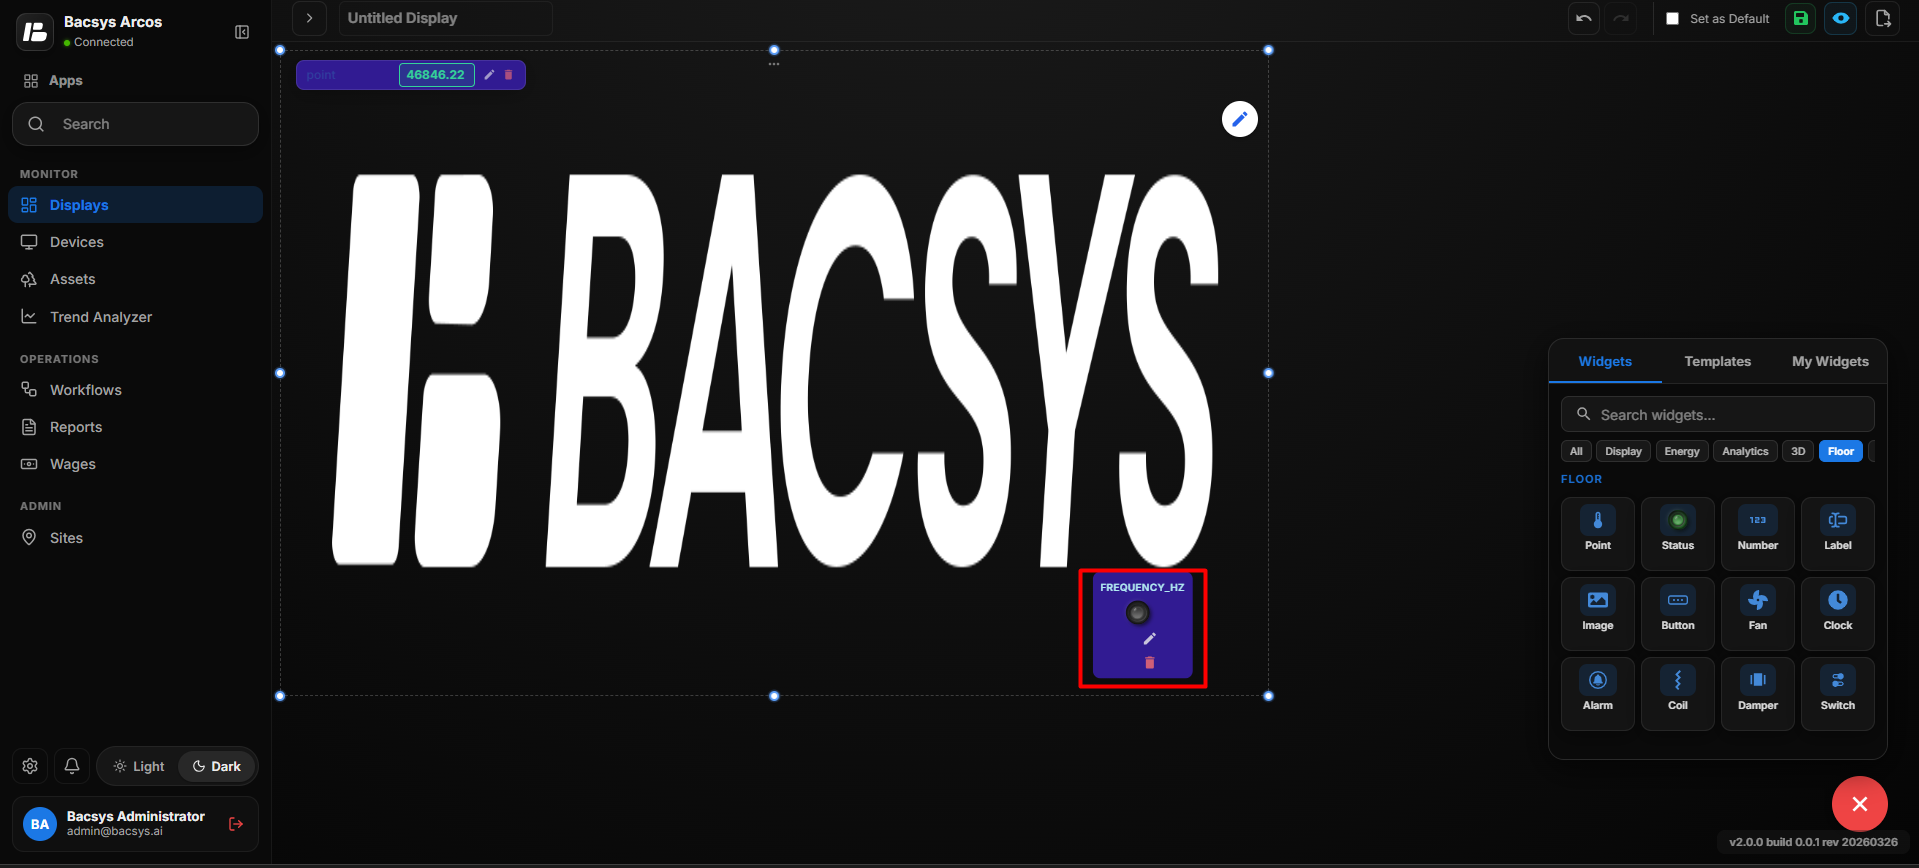 Display the Status Widget
9. The configured status is displayed on the floor layout.
Configure Binary (ON/OFF) Status
- Select the Status Widget configured with Single Status.
- Click Edit to open the Status Config panel.
- Under Value Type, select Binary (ON/OFF).
- Configure the required ON/OFF Point.
- Select the required Trip Point, if applicable.
- Configure the Connected Display for navigation, if required.
| Setting | Description |
|---|---|
| Layout Type | Defines the status display layout. |
| Value Type | Selects Binary (ON/OFF) to display the equipment status as ON or OFF. |
| ON/OFF Point | Selects the data point used to determine whether the equipment is ON or OFF. |
| Browse Hierarchy | Allows users to browse the Network → Device → Point hierarchy and select the required ON/OFF point. |
| Trip Point | Selects the data point used to indicate a trip or fault condition. |
| Browse Hierarchy | Allows users to browse the Network → Device → Point hierarchy and select the required Trip Point. |
| Connected Display | Selects the display to open when navigation is configured for the Status Widget. |
| Display Label | Defines the label displayed for the status widget on the floor layout. |
| Widget Scale | Controls the size of the Status Widget on the floor layout. |
| Show Name | Displays the name of the connected point when enabled. |
| Transparent BG | Makes the widget background transparent when enabled. |
| Text Color | Sets the color of the status text. |
| Widget Color | Sets the color of the Status Widget. |
| Recent Colors | Provides quick access to previously selected colors. |
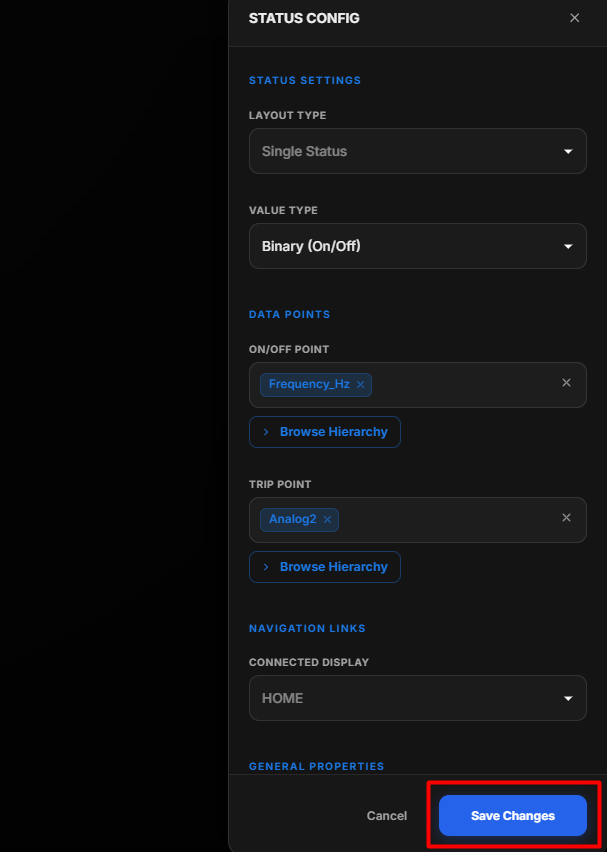 Binary (ON/OFF) Status
- Click Save Changes.
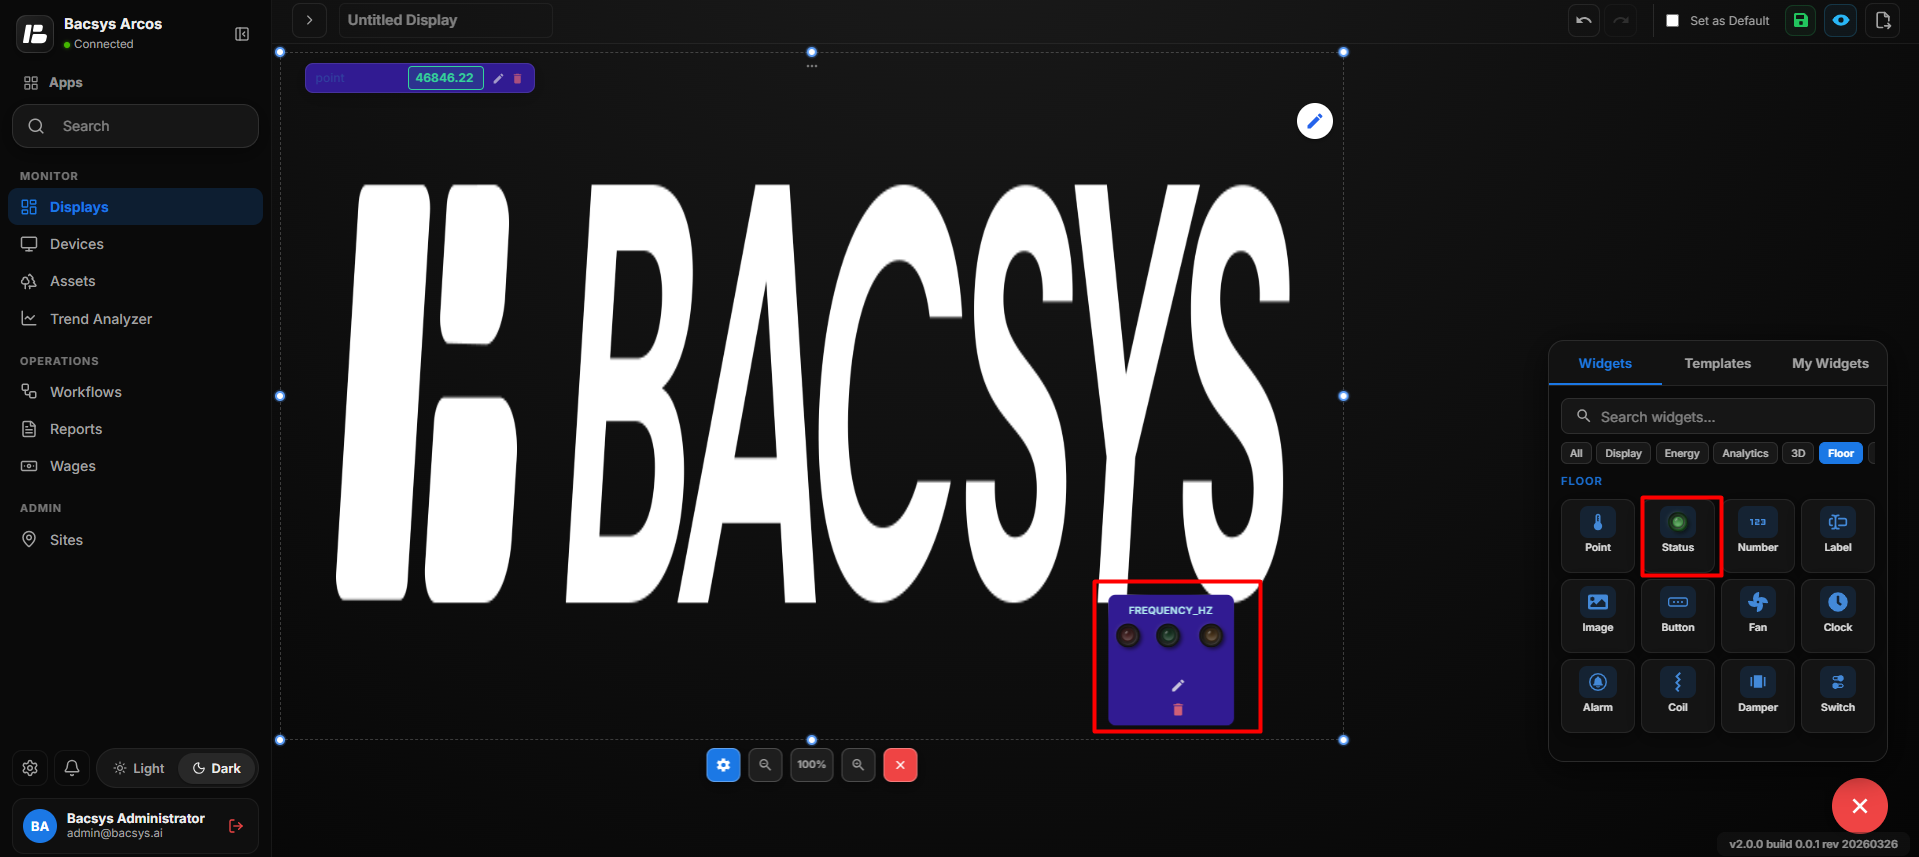 Display the Binary (ON/OFF) Status
- The Status Widget is updated to display the configured ON/OFF status on the floor layout.
Configure RYB Phase Status
- Select RYB Phase under Layout Type.
- Configure the required points for:
- Point 1 (R) – Red phase
- Point 2 (Y) – Yellow phase
- Point 3 (B) – Blue phase
- Use Browse Hierarchy to select the required point for each phase.
- Configure the corresponding Display (R), Display (Y), and Display (B) navigation links if required.
- Configure the Display Label, Widget Scale, Show Name, and Transparent BG settings.
| Setting | Description |
|---|---|
| Layout Type | Selects RYB Phase to display the status for three electrical phases: Red, Yellow, and Blue. |
| Point 1 (R) | Selects the data point associated with the Red (R) phase. |
| Browse Hierarchy | Allows users to browse the Network → Device → Point hierarchy and select the required Red phase point. |
| Point 2 (Y) | Selects the data point associated with the Yellow (Y) phase. |
| Browse Hierarchy | Allows users to browse the Network → Device → Point hierarchy and select the required Yellow phase point. |
| Point 3 (B) | Selects the data point associated with the Blue (B) phase. |
| Browse Hierarchy | Allows users to browse the Network → Device → Point hierarchy and select the required Blue phase point. |
| Display (R) | Selects the display to open when navigating from the Red phase. |
| Display (Y) | Selects the display to open when navigating from the Yellow phase. |
| Display (B) | Selects the display to open when navigating from the Blue phase. |
| Display Label | Defines the label displayed for the RYB Phase Status Widget on the floor layout. |
| Widget Scale | Controls the size of the RYB Phase Status Widget on the floor layout. |
| Show Name | Displays the name of the connected point when enabled. |
| Transparent BG | Makes the widget background transparent when enabled. |
| Text Color | Sets the color of the status text. |
| Widget Color | Sets the color of the Status Widget. |
| Recent Colors | Provides quick access to previously selected colors. |
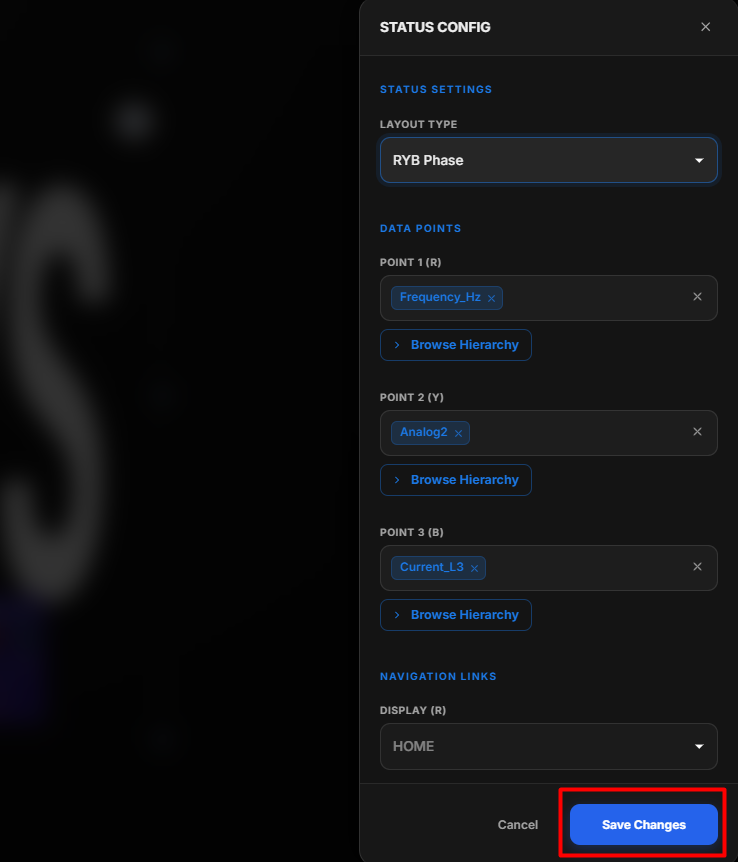 Status Widget Configuration
- Click Save Changes to save the RYB Phase configuration.
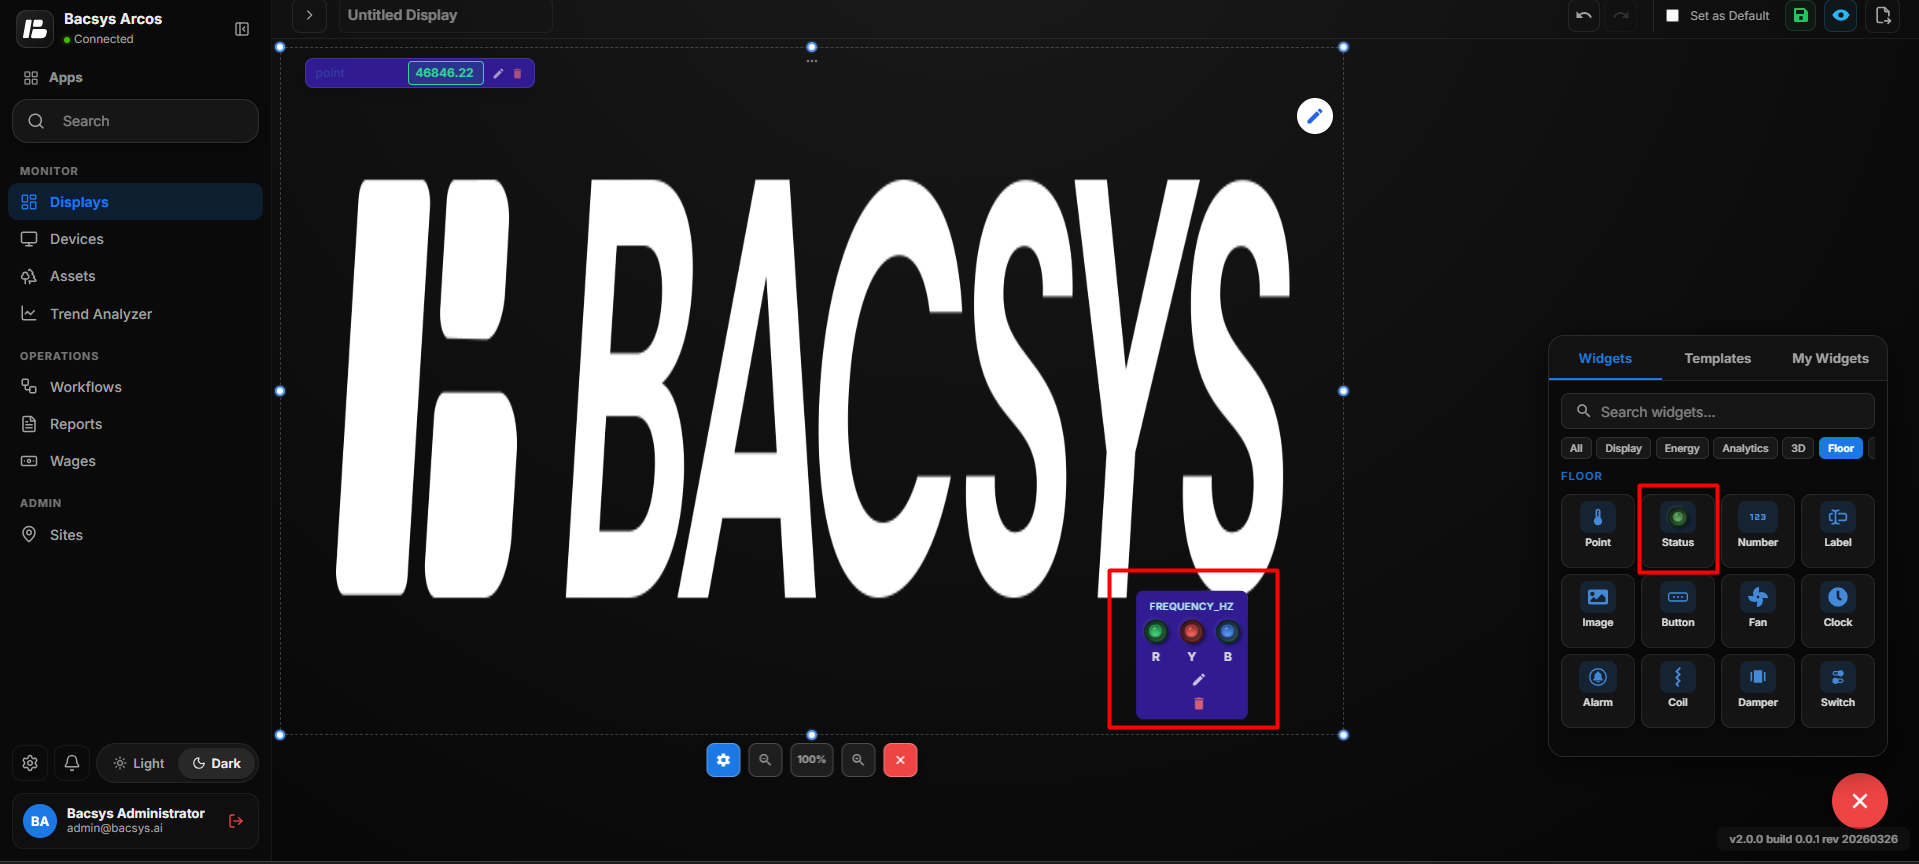 Save Changes
- The Status Widget is updated to display the configured R, Y, and B phase status on the floor layout.
Add and Configure the Number Widget
- Drag and drop the Number Widget onto the floor layout.
- Position the Number Widget at the required location.
- Select the Number Widget and click Edit to open the Number Config panel.
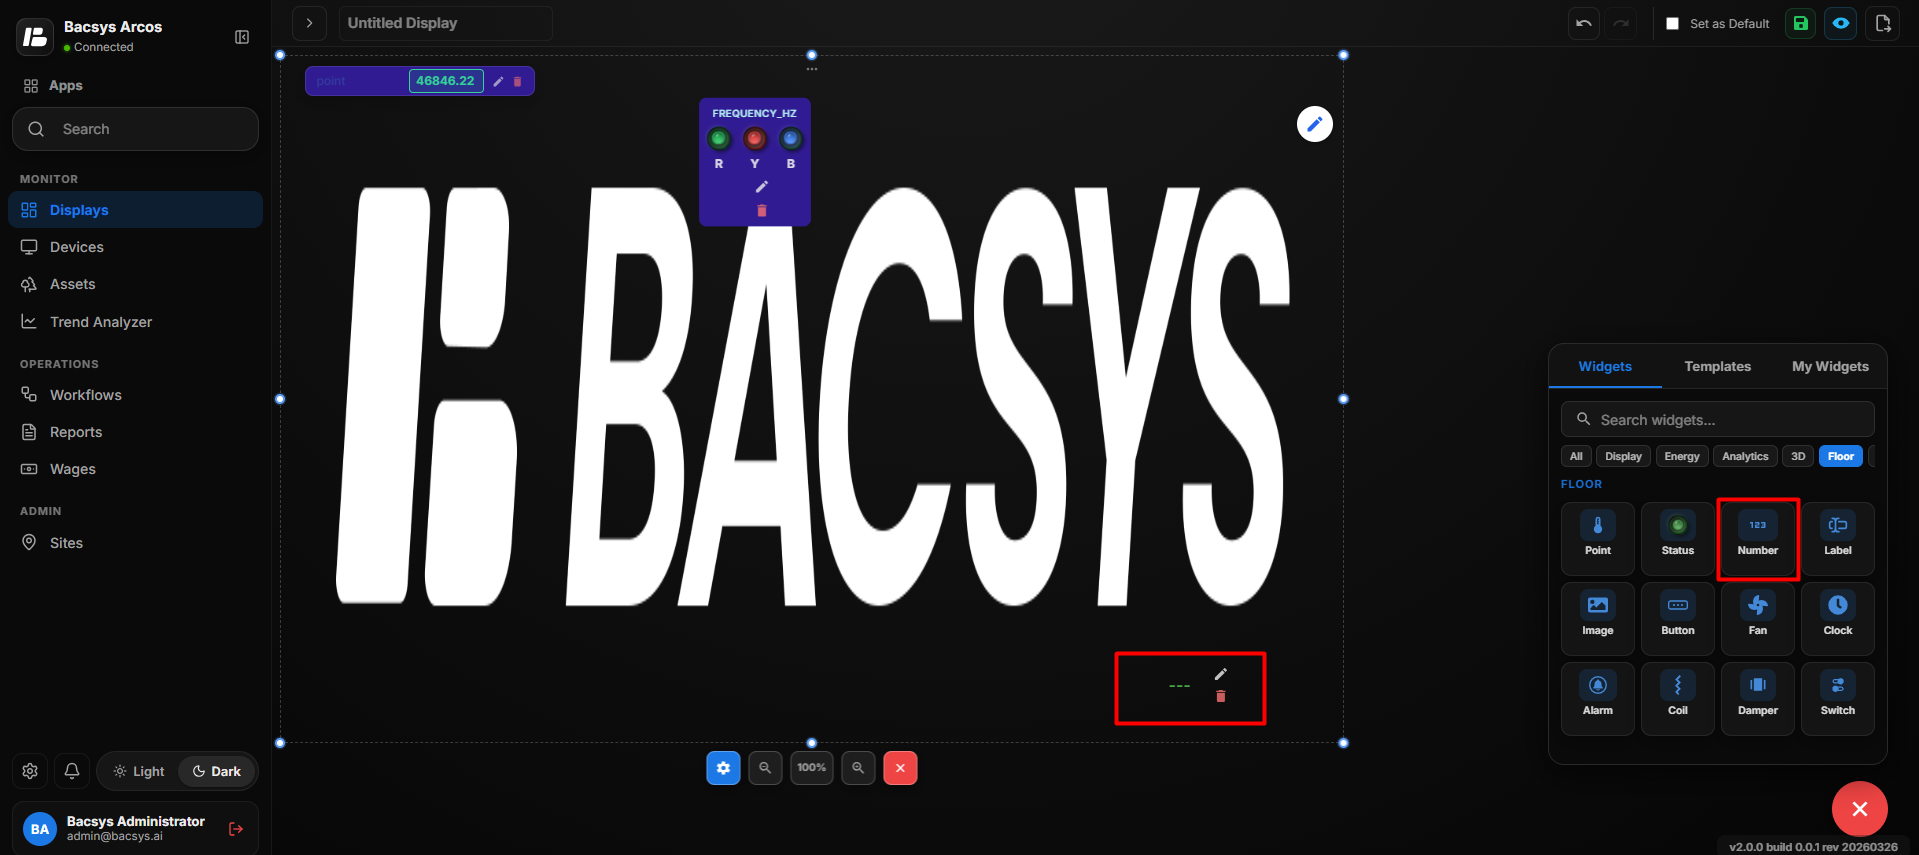 Number Widget
- Configure the required Number Widget properties.
- Select the required Connected Point using Browse Hierarchy.
| Setting | Description |
|---|---|
| Display Label | Defines the label displayed for the Number Widget on the floor layout. |
| Widget Scale | Controls the size of the Number Widget on the floor layout. |
| Connected Point | Selects the data point whose numeric value is displayed by the widget. |
| Browse Hierarchy | Allows users to browse the Network → Device → Point hierarchy and select the required point. |
| Font Size | Sets the font size of the displayed number value. |
| Bold | Displays the number value in bold text when enabled. |
| Italic | Displays the number value in italic text when enabled. |
| Show Name | Displays the name of the connected point when enabled. |
| Transparent BG | Makes the widget background transparent when enabled. |
| Text Color | Sets the color of the displayed number text. |
| Widget Color | Sets the color of the Number Widget. |
| Recent Colors | Provides quick access to previously selected colors. |
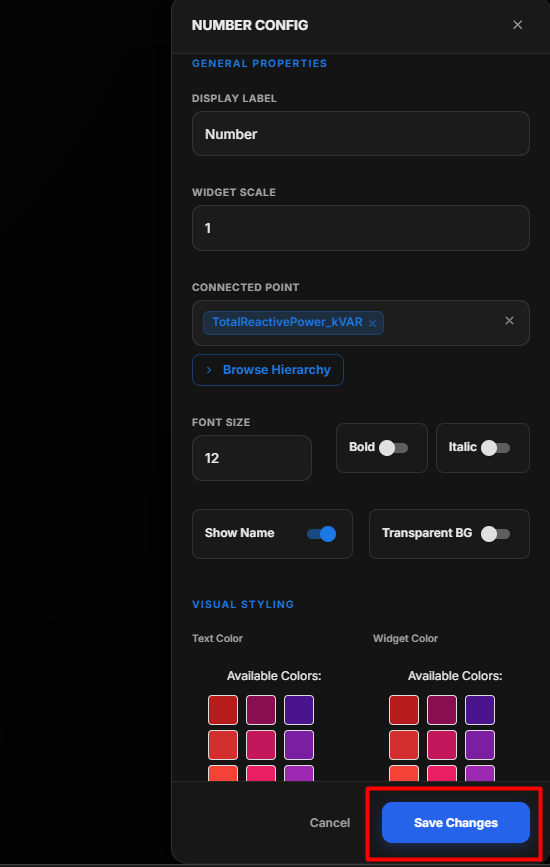 Number Widget Configuration
- Click Save Changes.
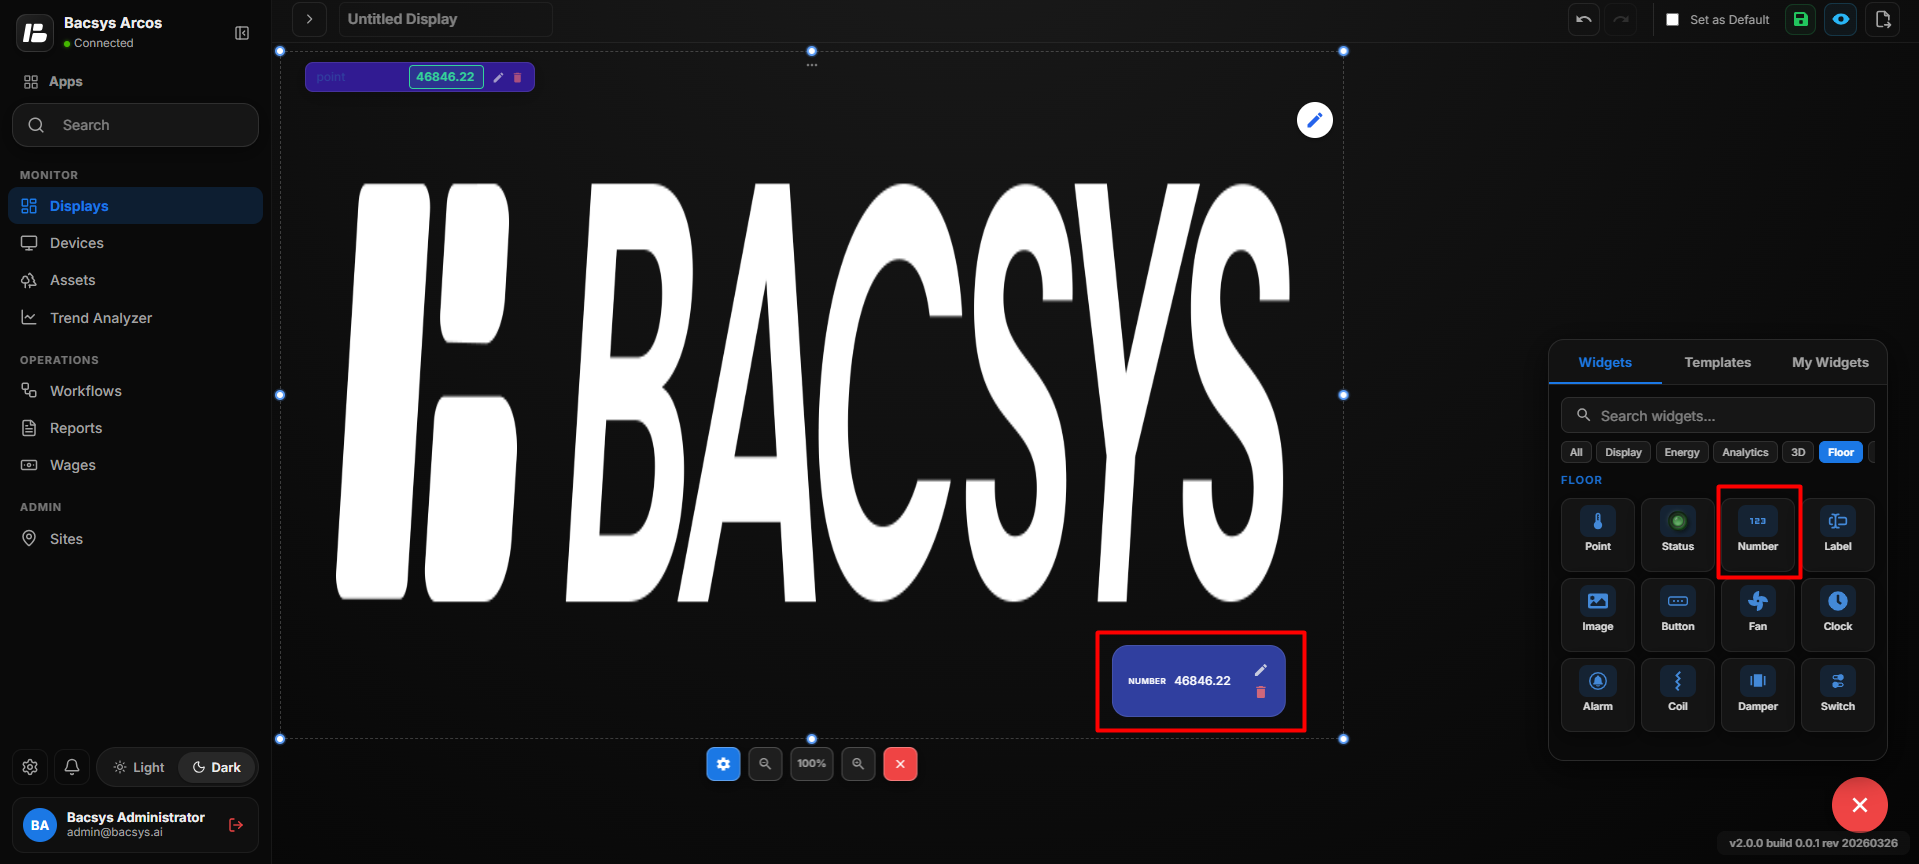 Save Changes
- The configured number value is displayed on the floor layout.
Configure the Number Widget
- Select the Number Widget on the floor layout.
- Click Edit to open the Number Config panel.
- Enter a name in the Display Label field.
- Set the Widget Scale to adjust the size of the widget.
- Under Connected Point, click Browse Hierarchy.
- Navigate through Network → Device → Point and select the required data point.
- Set the Font Size for the displayed value.
- Enable Bold or Italic if required.
- Enable Show Name to display the connected point name.
- Enable Transparent BG if a transparent widget background is required.
- Under Visual Styling, select the required Text Color.
- Select the required Widget Color.
- Review the Number Widget configuration.
- Click Save Changes.
- The Number Widget is updated on the floor layout with the selected point value and configured styling.
Add and Configure the Label Widget
- Drag and drop the Label Widget onto the floor layout.
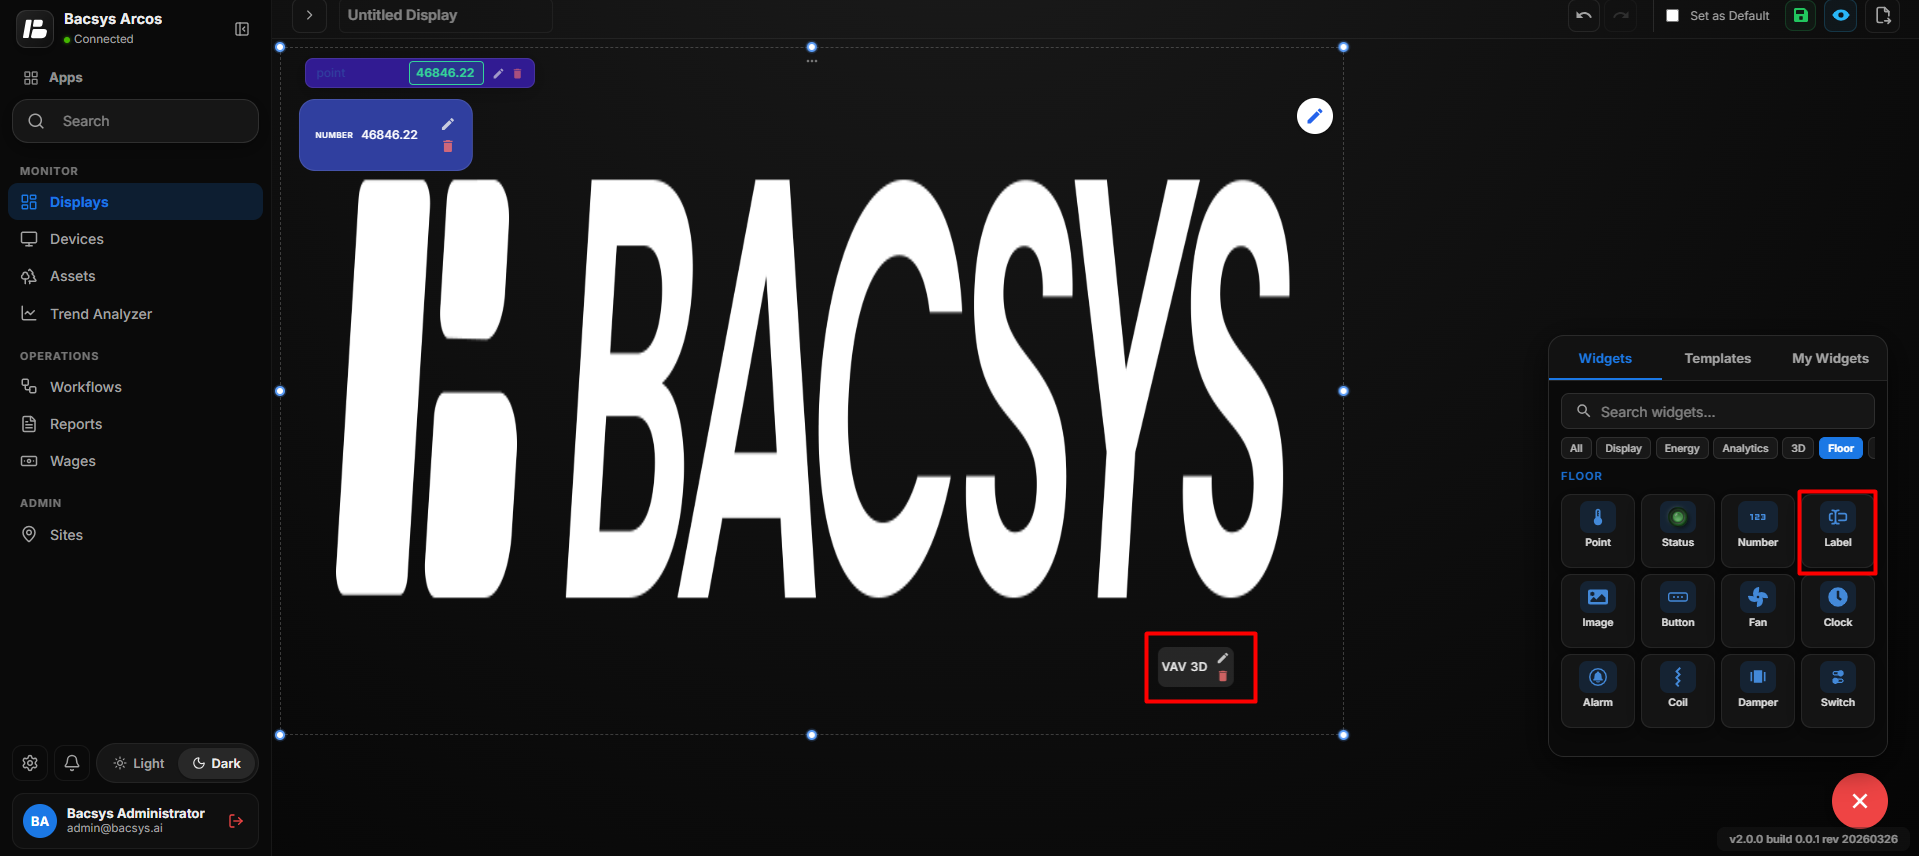 Label Widget
- Position the Label Widget at the required location.
- Select the Label Widget and click Edit to open the Label Config panel.
- Enter the required text in the Display Label field.
- Set the Widget Scale to adjust the size of the label.
| Setting | Description |
|---|---|
| Display Label | Defines the label displayed for the Label Widget on the floor layout. |
| Widget Scale | Controls the size of the Label Widget on the floor layout. |
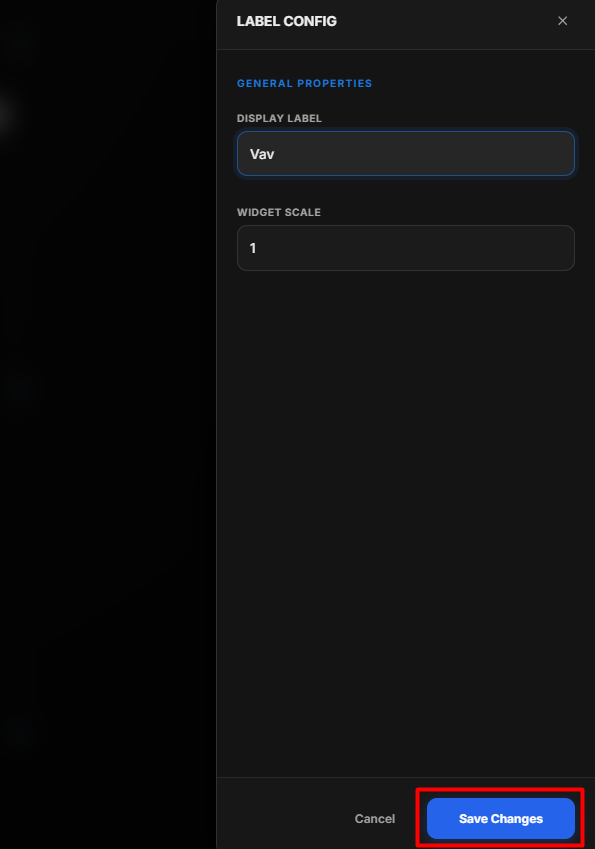 Label Widget Configuration
- Review the label configuration.
- Click Save Changes.
- The configured label is displayed on the floor layout.
Label Widget Configuration
Add the Image Widget
- Drag and drop the Image Widget onto the floor layout.
- Position the Image Widget at the required location.
- Select the Image Widget and click Edit to open the Image Config panel.
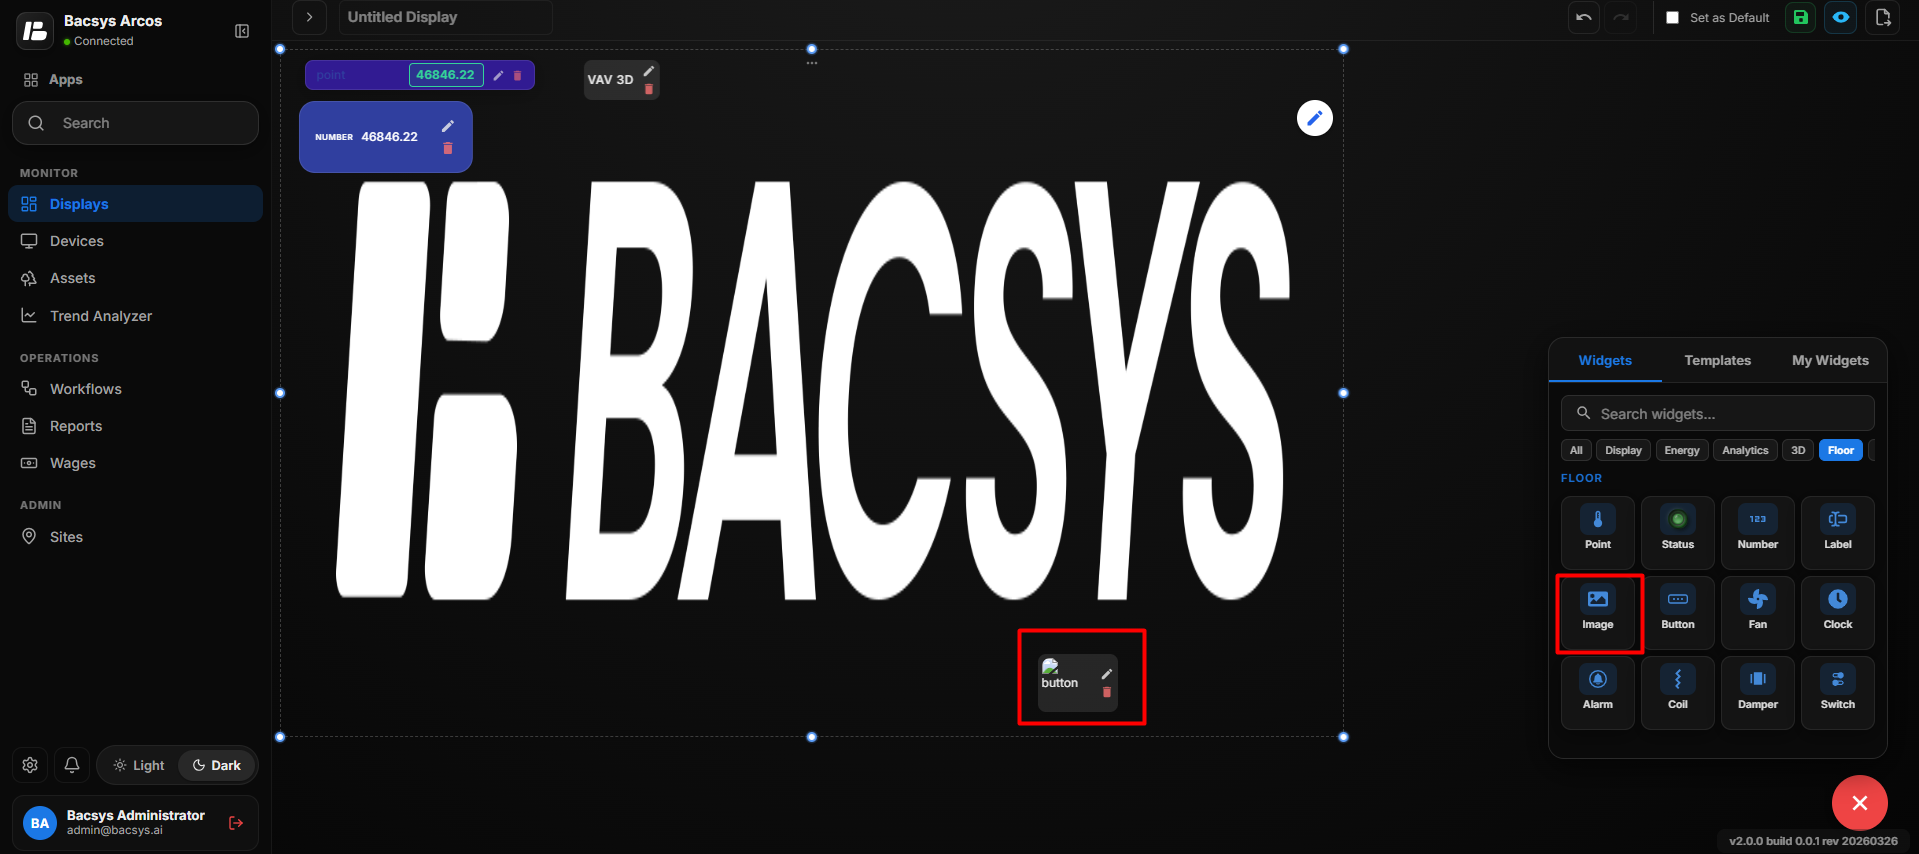 Image Widget
 Configuration
| Setting | Description |
|---|---|
| Widget Scale | Controls the size of the Image Widget on the floor layout. |
| Show Name | Displays the name of the image when enabled. |
| Transparent BG | Makes the widget background transparent when enabled. |
| Display Navigation | Allows the image to navigate to a selected display when clicked. |
| Custom URL | Specifies an external URL for navigation. |
| Open in New Tab | Opens the configured Custom URL in a new browser tab when enabled. |
| Image URL | Specifies the URL of the image to be displayed. |
| Choose File | Allows users to select and upload an image file. |
| Width (px) | Sets the width of the image in pixels. |
| Height (px) | Sets the height of the image in pixels. |
| Text Color | Sets the text color associated with the Image Widget. |
| Tint Color | Applies a tint color to the image. |
| Save Changes | Saves the configured Image Widget settings. |
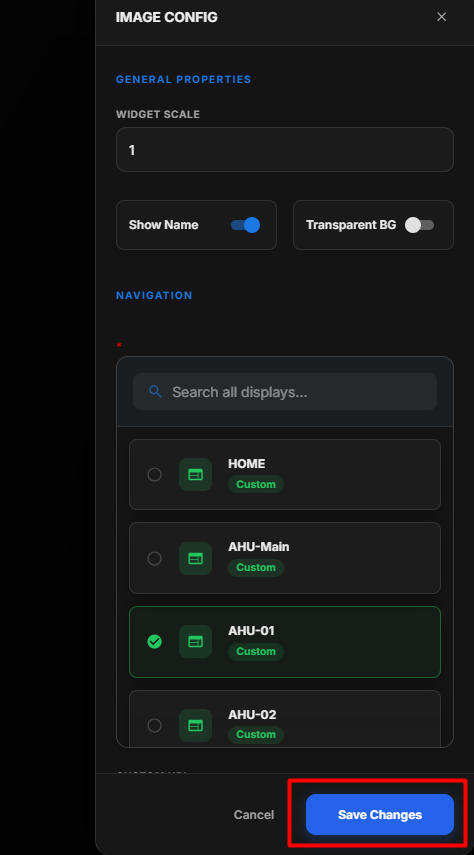 Image Widget
- Configure the required Image Widget settings.
- Click Save Changes.
- The configured image is displayed on the floor layout.
Configure the Image Widget
- In the Image Config panel, configure the Widget Scale to adjust the image size.
- Under Source, enter the Image URL or click Choose File to select an image.
- Under Navigation, select a display if the image should navigate to another display when clicked.
- Enter a Custom URL if the image should open an external webpage.
- Enable Open in New Tab if the custom URL should open in a new browser tab.
- Under Appearance, set the required Width and Height of the image.
- Select the required Text Color and Tint Color.
- Enable Show Name if the image name should be displayed.
- Enable Transparent BG if a transparent background is required.
- Review the configured Image Widget settings.
- Click Save Changes.
- The configured image is updated and displayed on the floor layout.
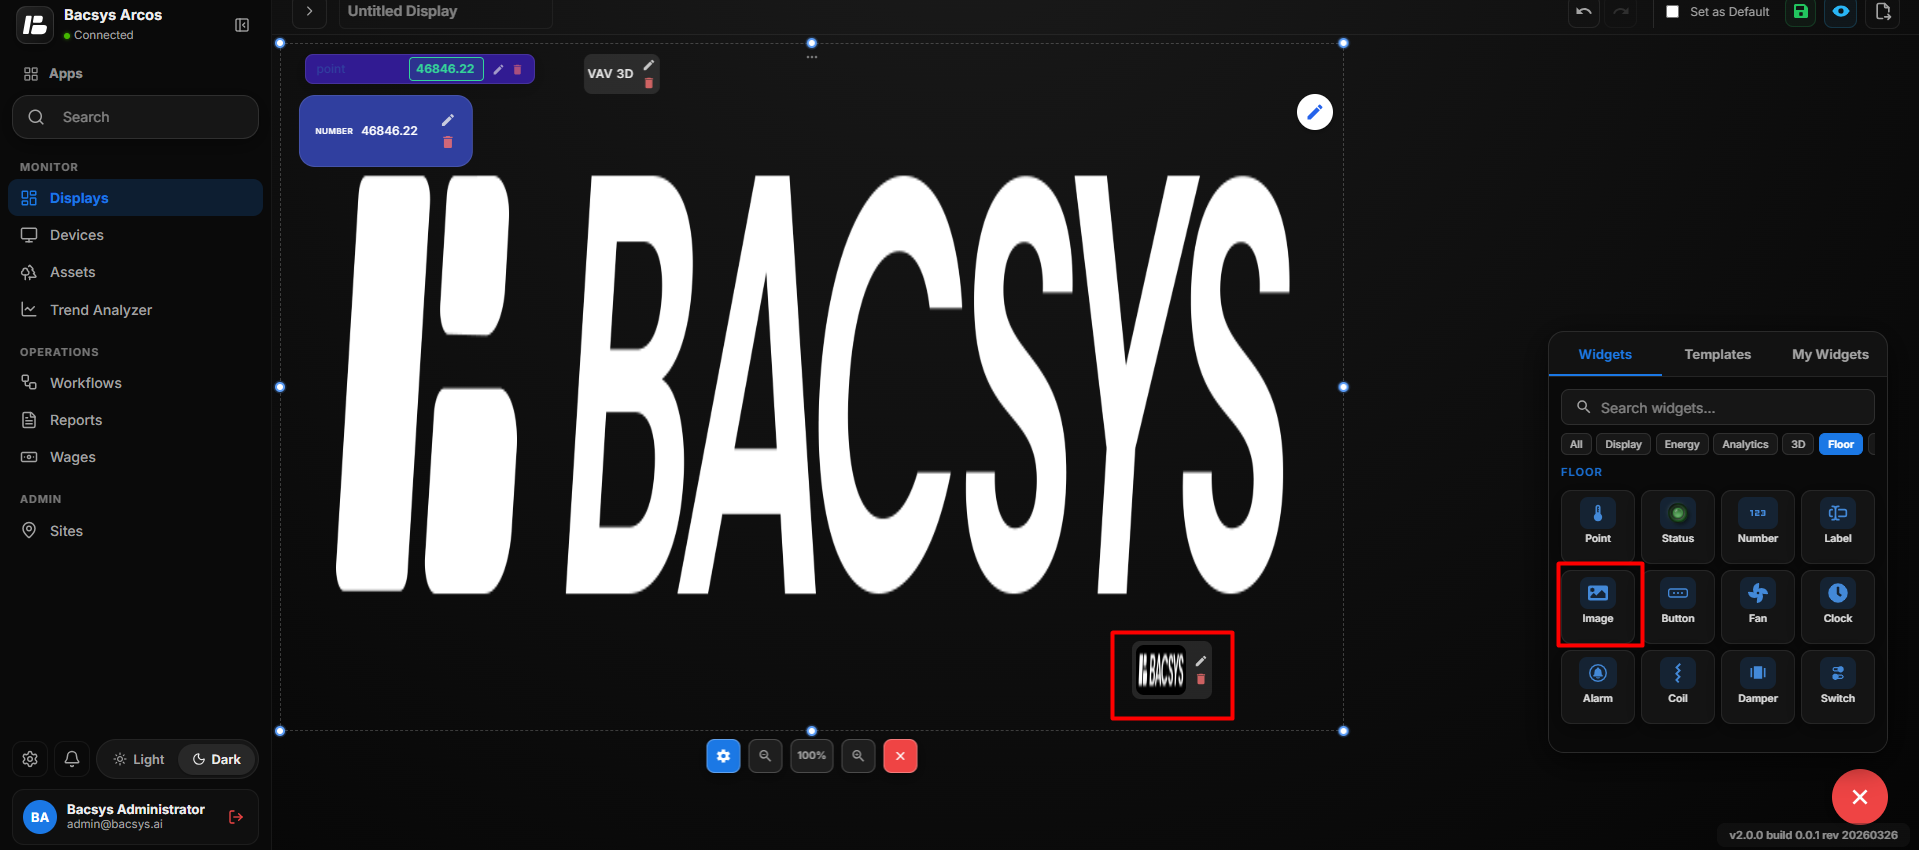 Image Widget Configuration
Add and Configure the Button Widget
- Drag and drop the Button Widget onto the floor layout.
- Position the Button Widget at the required location.
- Select the Button Widget and click Edit to open the Button Config panel.
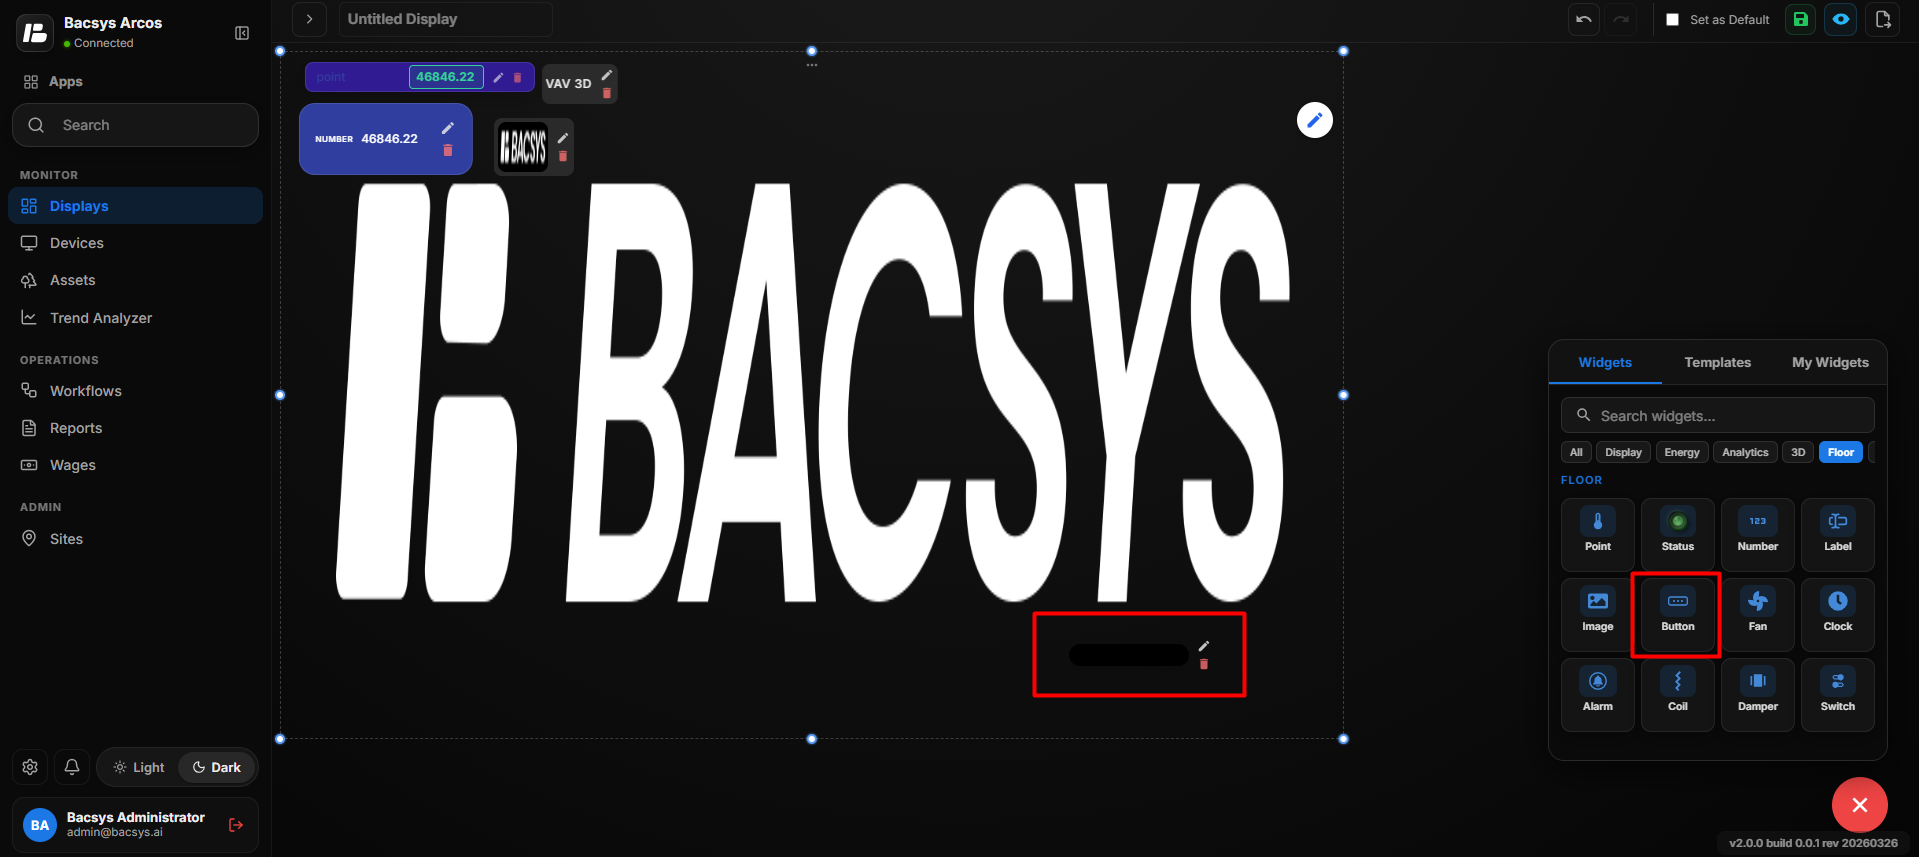 Button Widget
 Configuration
| Setting | Description |
|---|---|
| Widget Scale | Controls the size of the Button Widget on the floor layout. |
| Show Name | Displays the button name when enabled. |
| Transparent BG | Makes the widget background transparent when enabled. |
| Display Navigation | Allows the button to navigate to a selected display when clicked. |
| Custom URL | Specifies an external URL for the button navigation. |
| Open in New Tab | Opens the configured Custom URL in a new browser tab when enabled. |
| Button Label | Defines the text displayed on the button. |
| Width (px) | Sets the button width in pixels. |
| Height (px) | Sets the button height in pixels. |
| Font Size | Sets the font size of the button label. |
| Bold | Displays the button label in bold text when enabled. |
| Italic | Displays the button label in italic text when enabled. |
| Text Color | Sets the color of the button label. |
| Button Color | Sets the background color of the button. |
| Recent Colors | Provides quick access to previously selected colors. |
| Save Changes | Saves the configured Button Widget settings. |
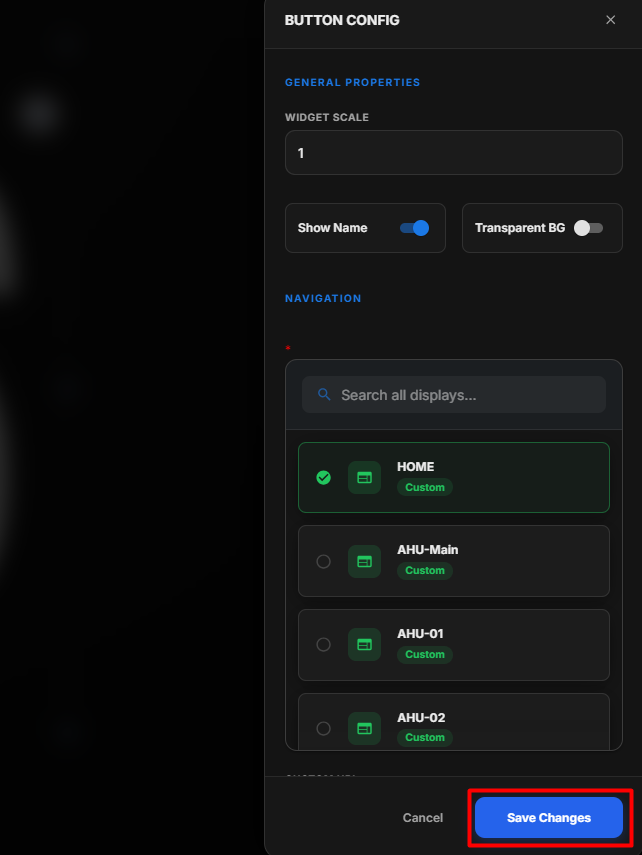 Button Widget
Configure the Button Widget
- Set the Widget Scale according to the required button size.
- Enable Show Name if the button name should be displayed.
- Enable Transparent BG if a transparent background is required.
- Under Navigation, select the required display.
- Enter a Custom URL if the button should navigate to an external webpage.
- Enable Open in New Tab if the external URL should open in a new browser tab.
- Enter the required text in Button Label.
- Set the required Width and Height.
- Configure the Font Size.
- Enable Bold or Italic if required.
- Select the required Text Color.
- Select the required Button Color.
- Review the button configuration.
- Click Save Changes.
- The configured Button Widget is updated on the floor layout.
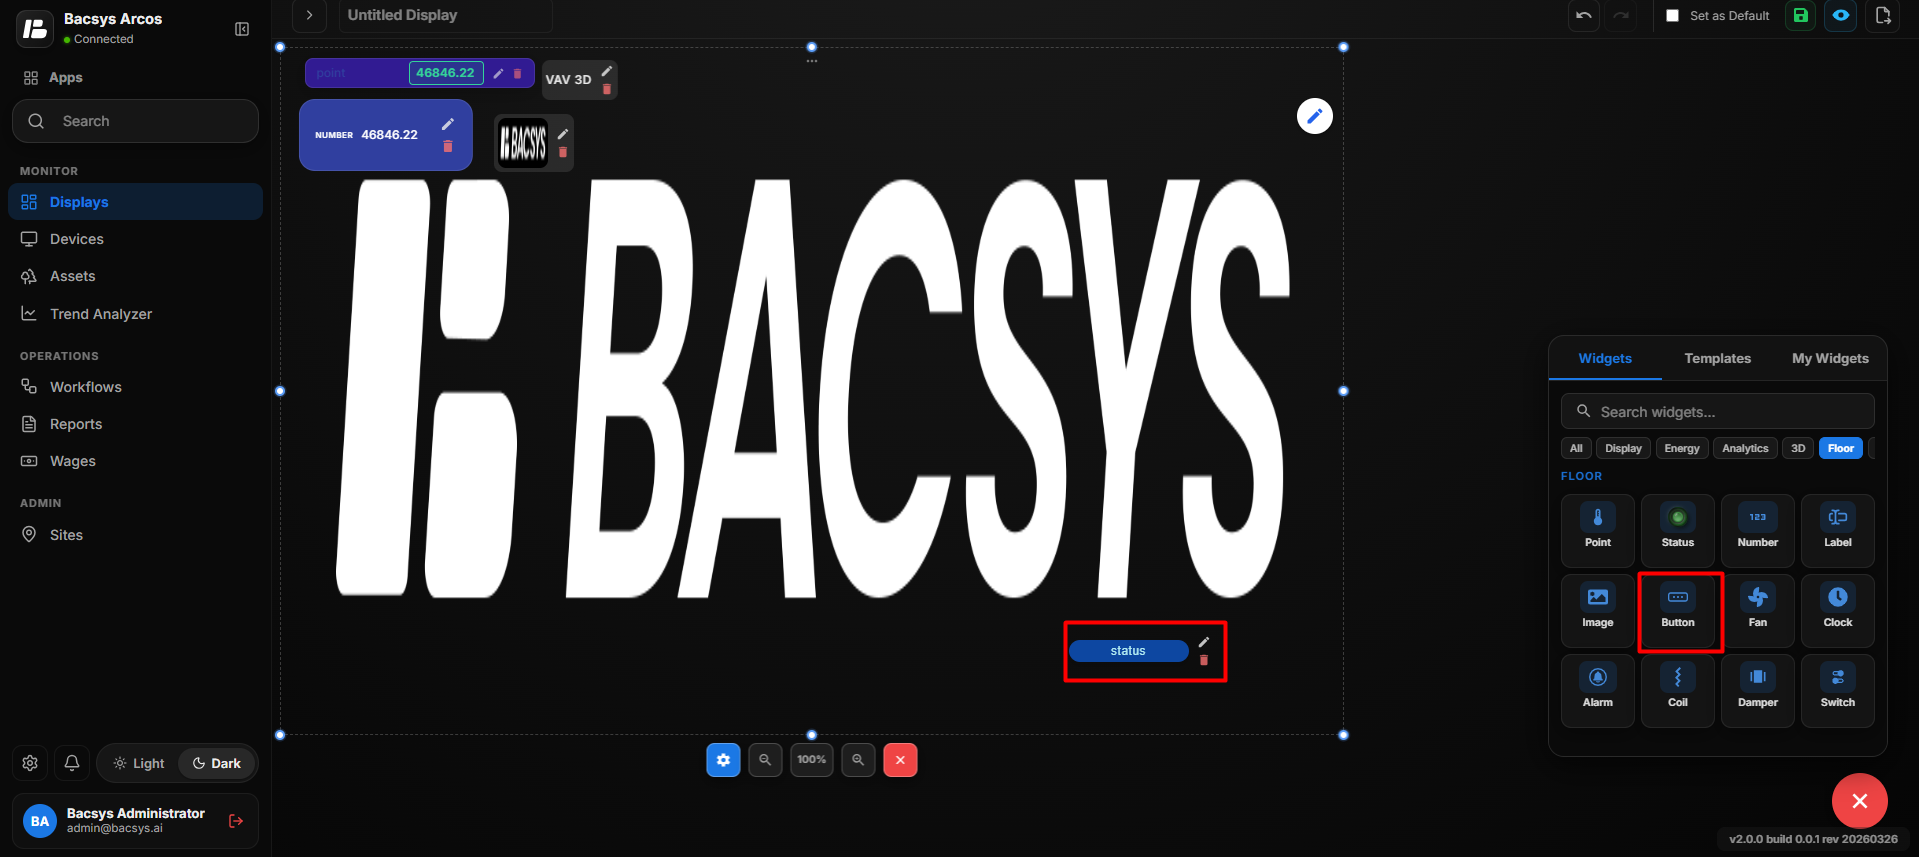 Button Widget
Add and Configure the Fan Widget
- Drag and drop the Fan Widget onto the floor layout or 3D image.
- Position the Fan Widget at the required location.
- Select the Fan Widget and click Edit to open the Fan Config panel.
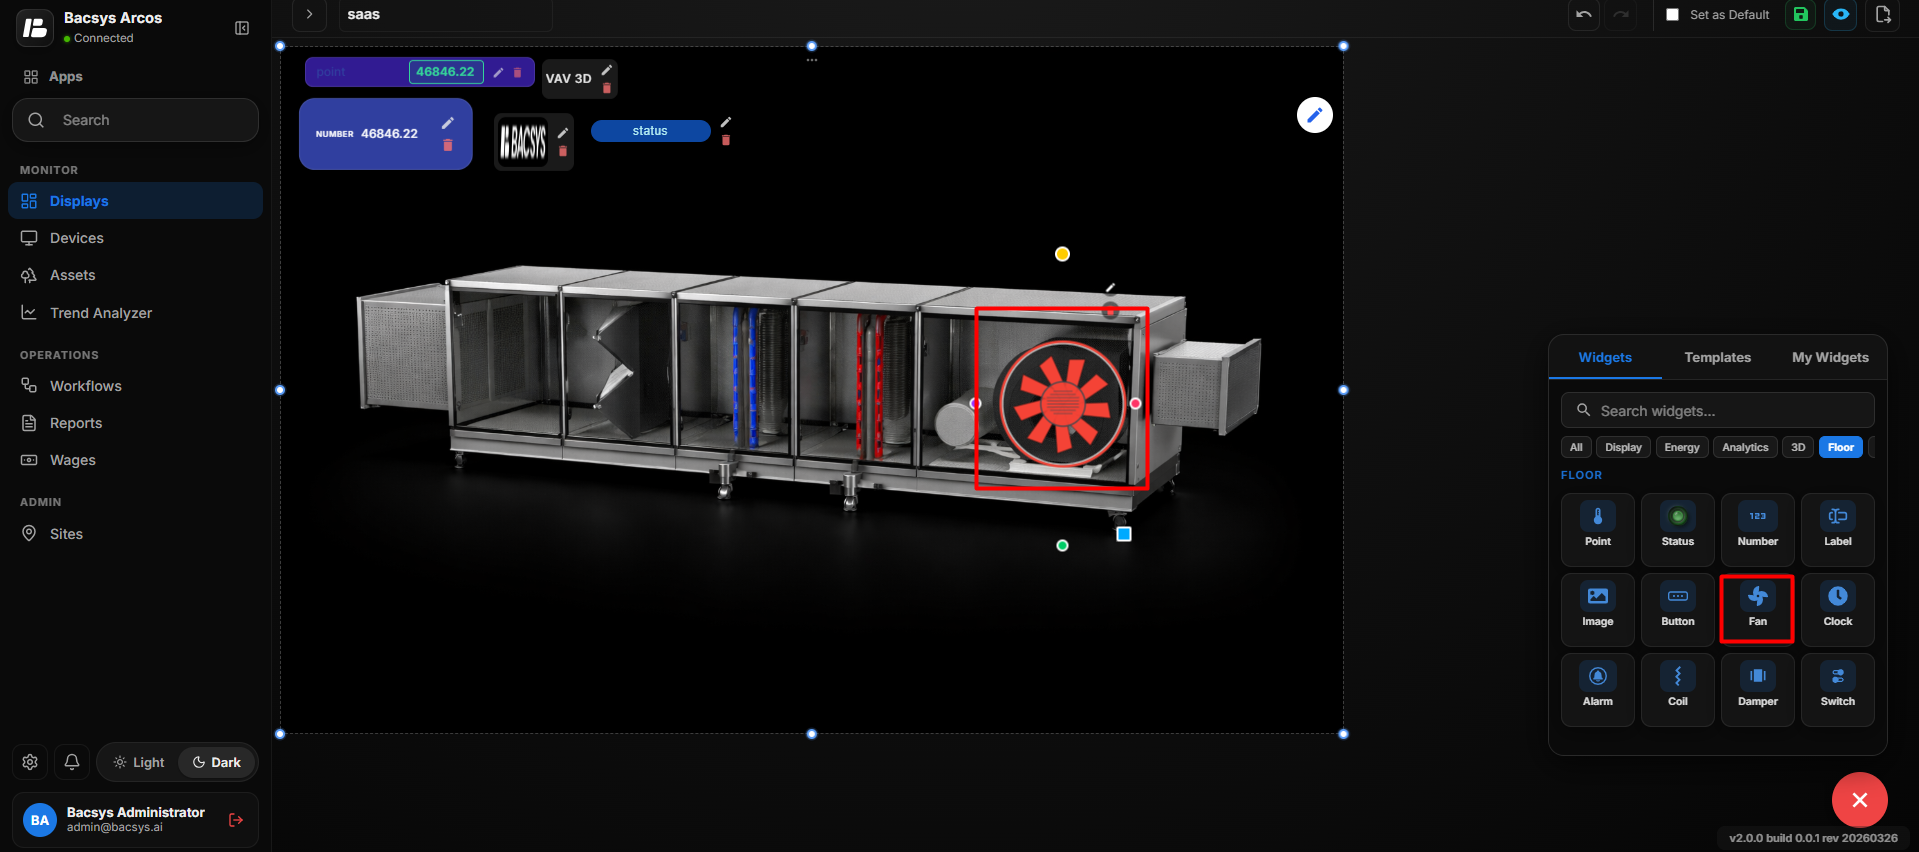 Fan Widget
 Configuration
| Setting | Description |
|---|---|
| Display Label | Defines the label displayed for the Fan Widget. |
| Widget Scale | Controls the size of the Fan Widget. |
| Connected Point | Selects the data point associated with the fan. |
| Browse Hierarchy | Allows users to browse the Network → Device → Point hierarchy and select the required point. |
| Font Size | Sets the font size of the displayed fan label or value. |
| Bold | Displays the label or value in bold text when enabled. |
| Italic | Displays the label or value in italic text when enabled. |
| Show Name | Displays the name of the connected point when enabled. |
| Transparent BG | Makes the widget background transparent when enabled. |
| Text Color | Sets the color of the displayed fan text. |
| Widget Color | Sets the color of the Fan Widget. |
| Write Enabled | Enables writing or controlling the connected point from the Fan Widget. |
| Min Limit | Defines the minimum value allowed when writing a value. |
| Max Limit | Defines the maximum value allowed when writing a value. |
| Recent Colors | Provides quick access to previously selected colors. |
| Save Changes | Saves the configured Fan Widget settings. |
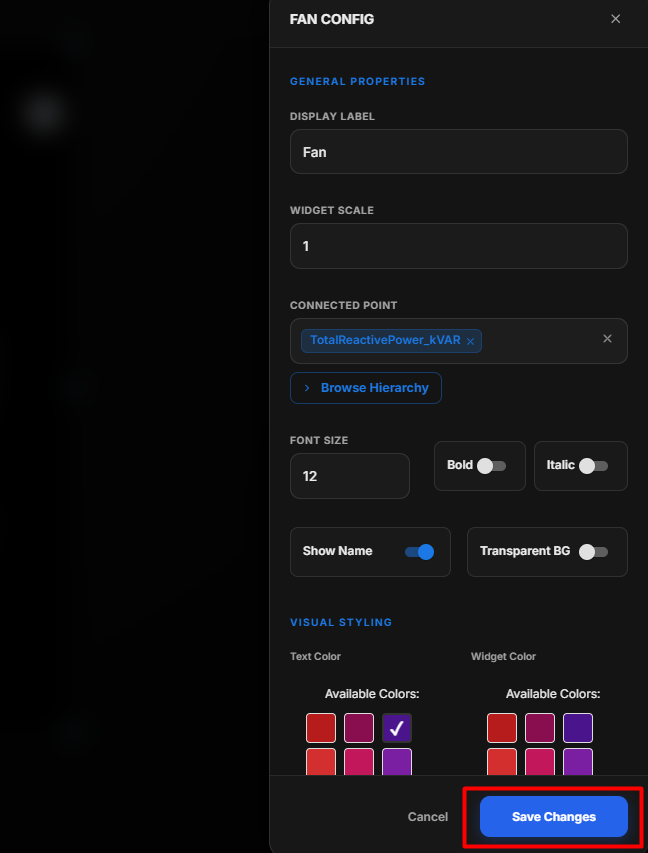 Fan Widget
Configure the Fan Widget
- Enter the required Display Label.
- Set the Widget Scale according to the required size.
- Under Connected Point, click Browse Hierarchy and select the required point.
- Configure the Font Size, Bold, and Italic options as required.
- Enable Show Name if the connected point name should be displayed.
- Enable Transparent BG if a transparent background is required.
- Select the required Text Color and Widget Color.
- If control is required, enable Write Enabled.
- Enter the required Min Limit and Max Limit for the writable value.
- Review the Fan Widget configuration.
- Click Save Changes.
- The configured Fan Widget is updated on the floor layout or 3D image.
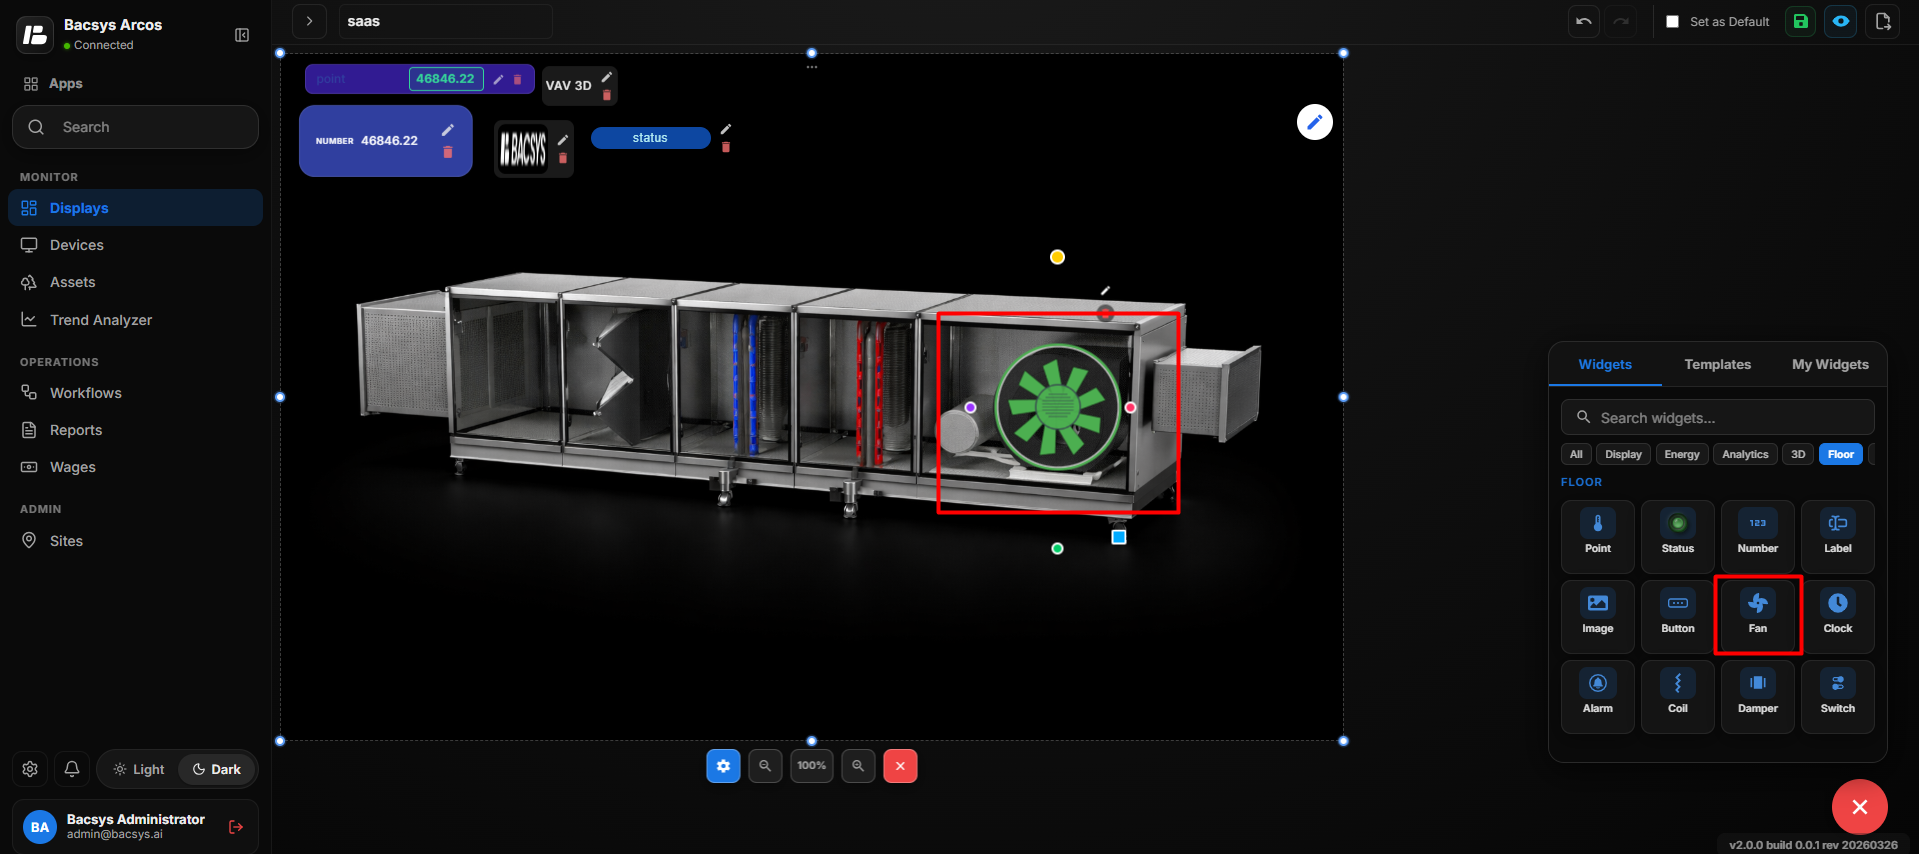 Fan Widget
Note: The Fan Widget is mainly used with 3D images/3D visualization to represent fan components and display or control their associated data points.
Add and Configure the Clock Widget
- Drag and drop the Clock Widget onto the floor layout.
- Position the Clock Widget at the required location.
- Select the Clock Widget and click Edit to open the Clock Config panel.
- Configure the required clock settings.
- Set the clock to display the system date and time.
- Configure the required display format, if available.
- Click Save Changes.
- The Clock Widget displays the current system time on the floor layout.
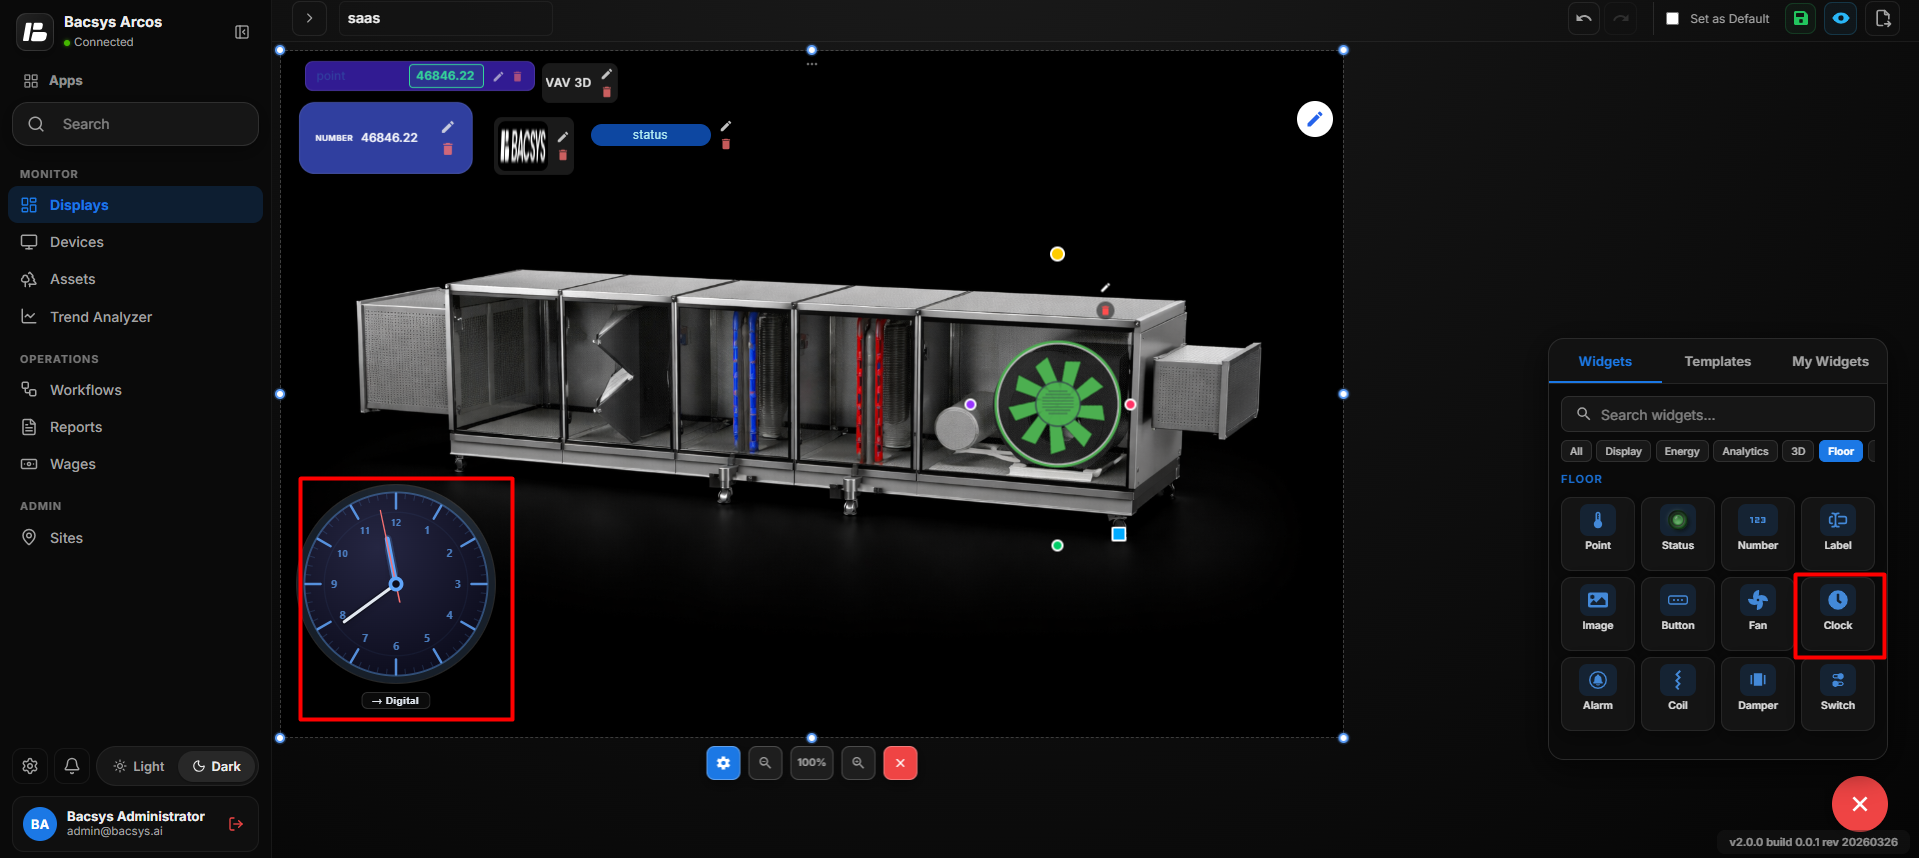 Clock Widget
Add and Configure the Alarm Widget
- Drag and drop the Alarm Widget onto the floor layout.
- Position the Alarm Widget at the required location.
- Select the Alarm Widget and click Edit to open the Alarm Config panel.
- Configure the required alarm properties.
- Select the required Connected Point using Browse Hierarchy.
- Configure the required display and visual styling options.
- Click Save Changes.
- The configured Alarm Widget is displayed on the floor layout.
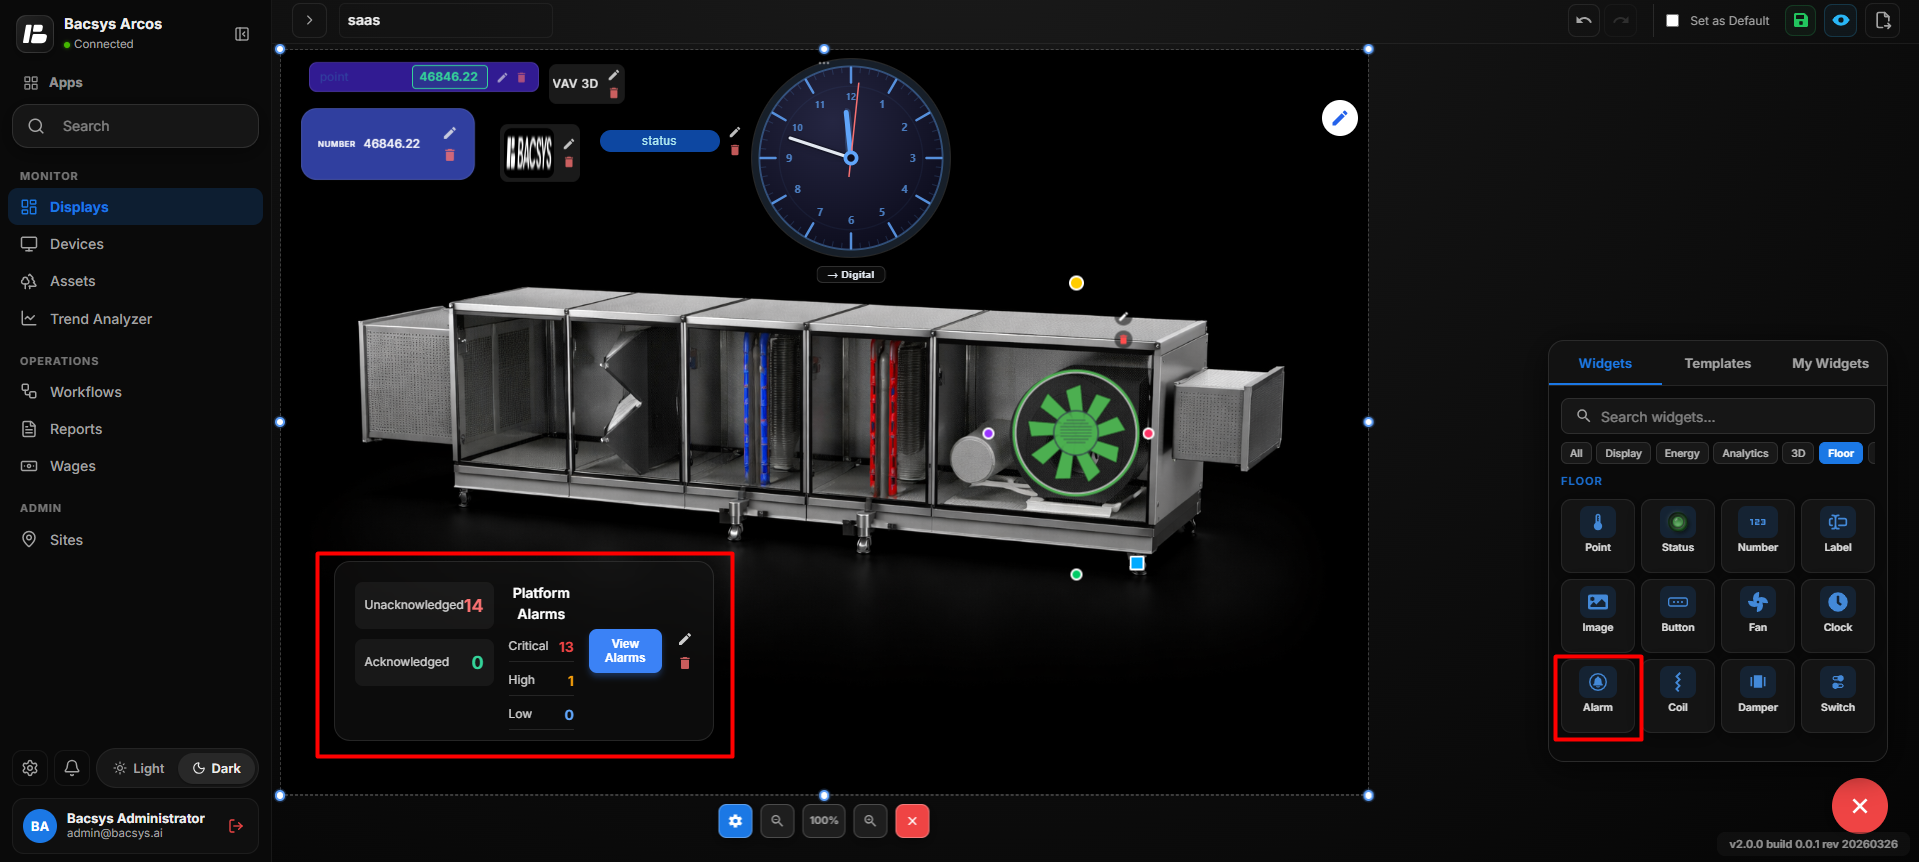 Alarm Widget
 Configuration
| Setting | Description |
|---|---|
| Display Label | Defines the label displayed for the Alarm Widget. |
| Widget Scale | Controls the size of the Alarm Widget. |
| Connected Point | Selects the data point associated with the alarm. |
| Browse Hierarchy | Allows users to browse the Network → Device → Point hierarchy and select the required point. |
| Font Size | Sets the font size of the displayed alarm information. |
| Bold | Displays the alarm label or value in bold text when enabled. |
| Italic | Displays the alarm label or value in italic text when enabled. |
| Show Name | Displays the name of the connected point when enabled. |
| Transparent BG | Makes the widget background transparent when enabled. |
| Text Color | Sets the color of the alarm text. |
| Widget Color | Sets the color of the Alarm Widget. |
| Recent Colors | Provides quick access to previously selected colors. |
| Save Changes | Saves the configured Alarm Widget settings. |
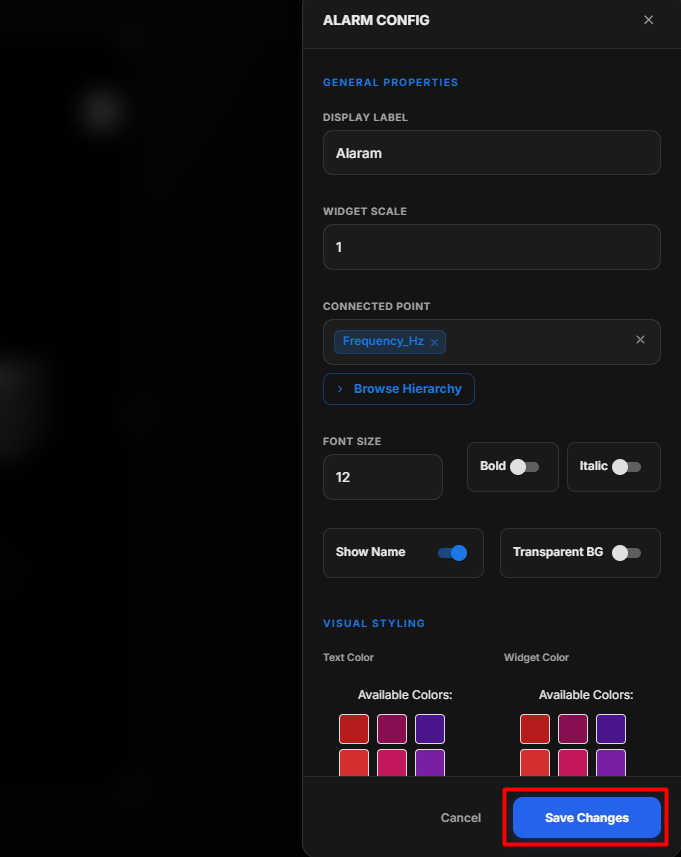 Alarm Widget
Configure the Alarm Widget
- Select the Alarm Widget on the floor layout.
- Click Edit to open the Alarm Config panel.
- Enter the required Display Label.
- Set the Widget Scale according to the required size.
- Under Connected Point, click Browse Hierarchy.
- Navigate through Network → Device → Point and select the required alarm point.
- Set the required Font Size.
- Enable Bold or Italic if required.
- Enable Show Name to display the connected point name.
- Enable Transparent BG if a transparent background is required.
- Select the required Text Color and Widget Color.
- Review the Alarm Widget configuration.
- Click Save Changes.
- The configured alarm is updated and displayed on the floor layout.
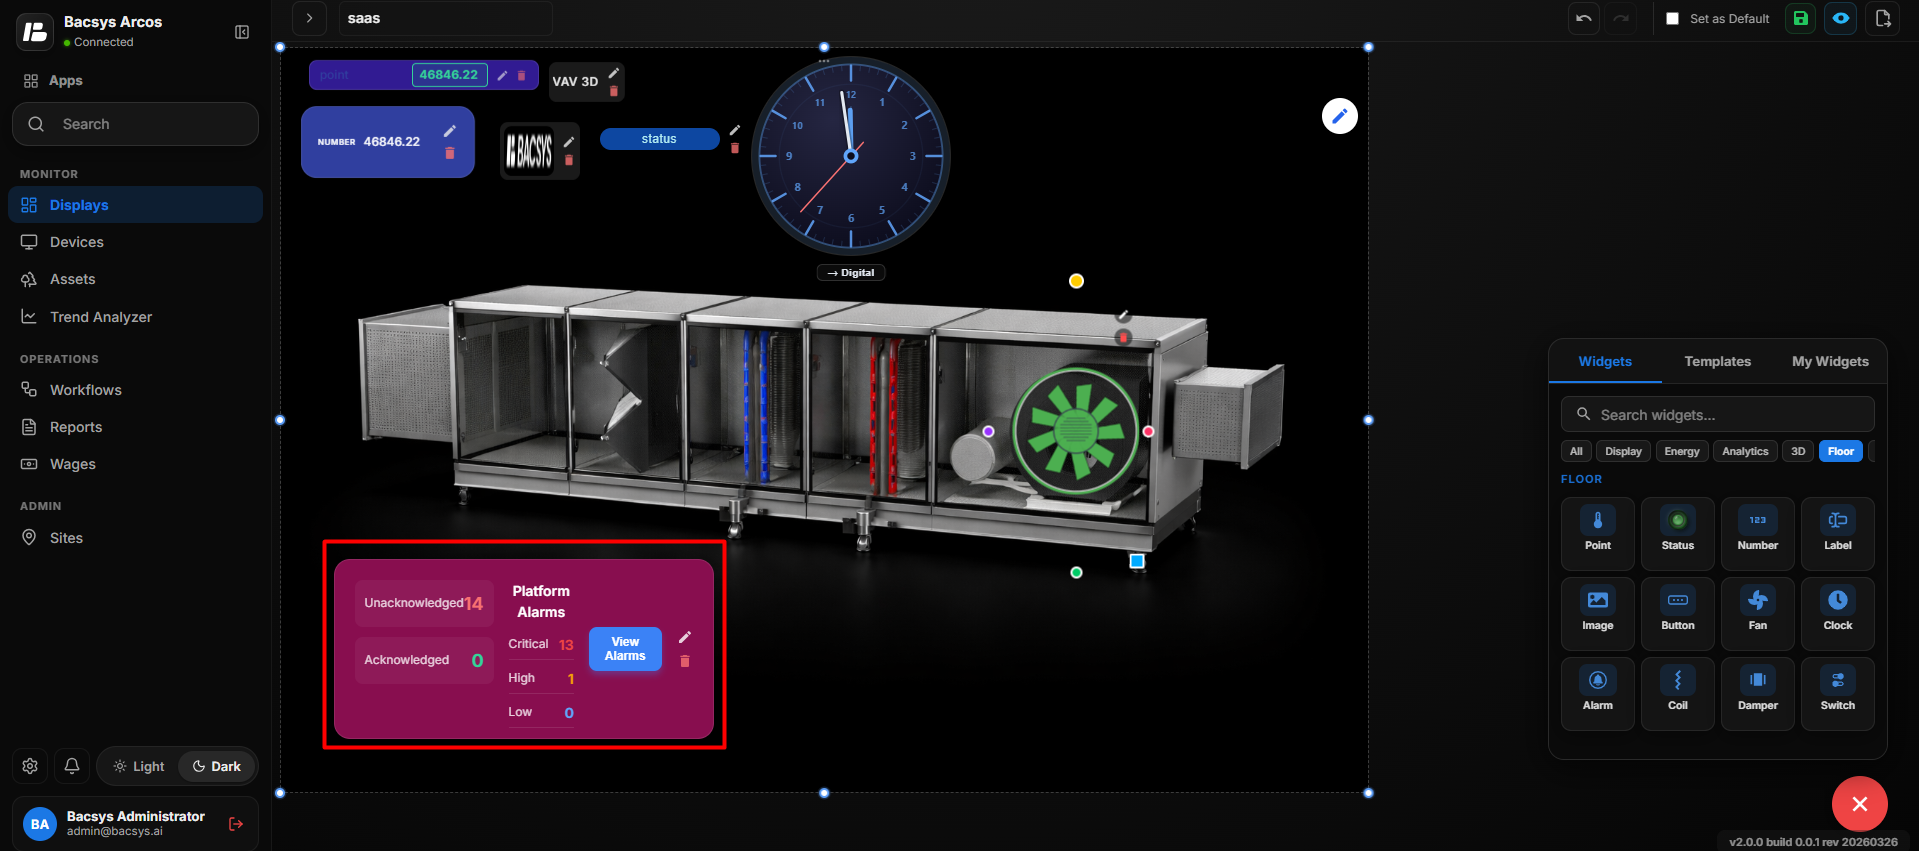 Alarm Widget
Add and Configure the Coil Widget
- Drag and drop the Coil Widget onto the floor layout or 3D image.
- Position the Coil Widget at the required location.
- Select the Coil Widget and click Edit to open the Coil Config panel.
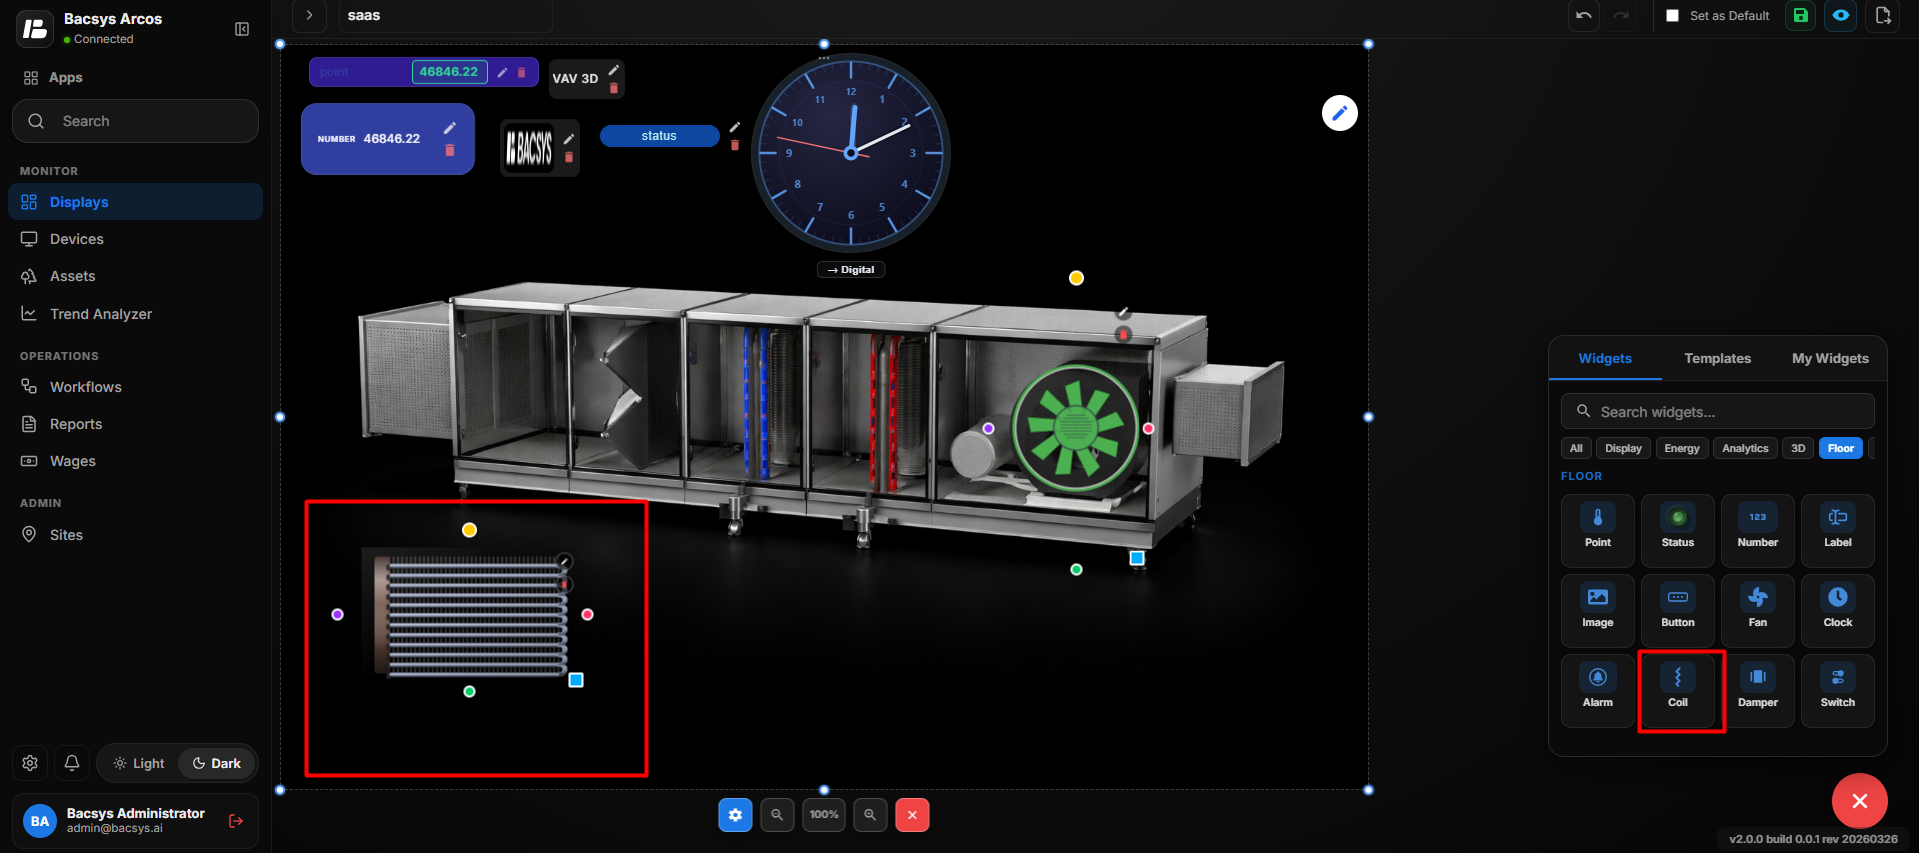 Coil Widget
 Configuration
| Setting | Description |
|---|---|
| Display Label | Defines the label displayed for the Coil Widget. |
| Widget Scale | Controls the size of the Coil Widget. |
| Connected Point | Selects the data point associated with the coil. |
| Browse Hierarchy | Allows users to browse the Network → Device → Point hierarchy and select the required point. |
| Write Enabled | Enables writing or controlling the connected point from the Coil Widget. |
| Coil Type | Defines the type of coil, such as Cooling or Heating. |
| Min Limit | Defines the minimum value allowed when writing a value. |
| Max Limit | Defines the maximum value allowed when writing a value. |
| Save Changes | Saves the configured Coil Widget settings. |
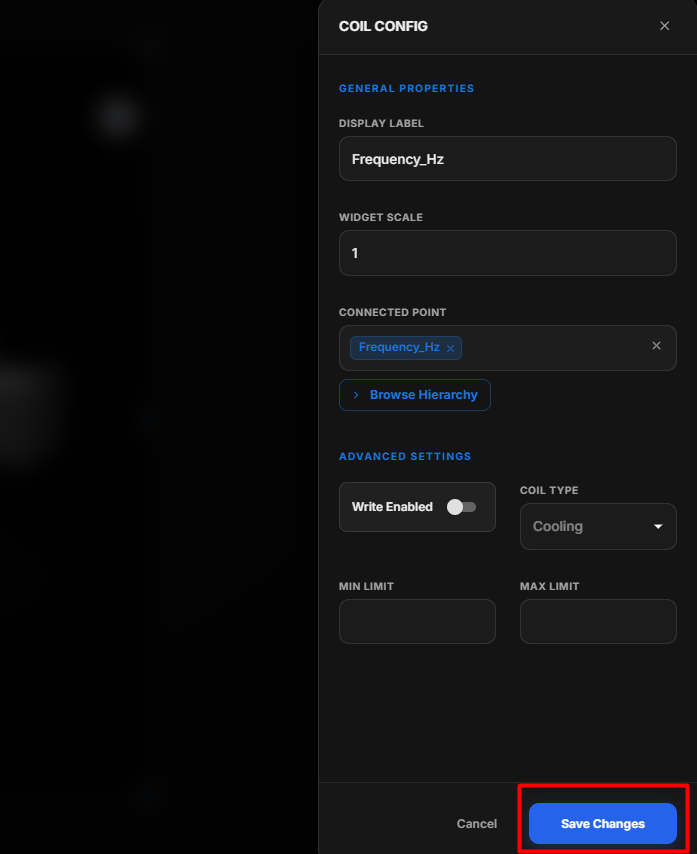 Coil Widget
- Configure the required Coil Widget settings.
- Click Save Changes.
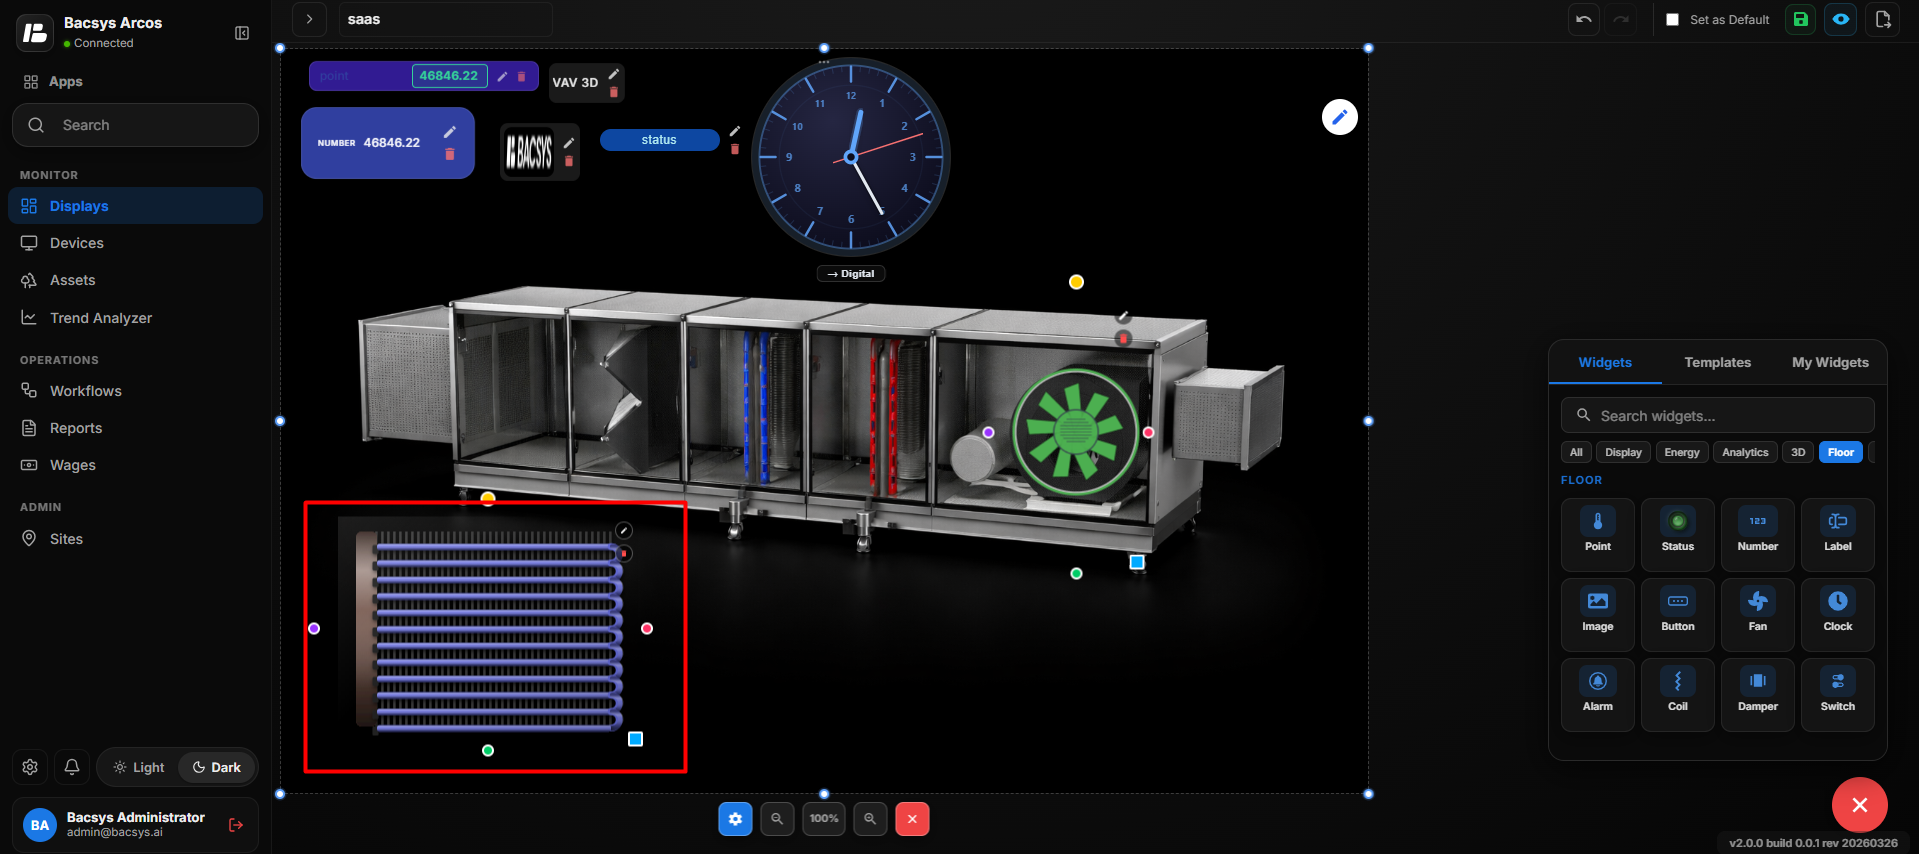 Coil Widget
- The configured Coil Widget is updated on the floor layout or 3D image.
Add and Configure the Damper Widget
- Drag and drop the Damper Widget onto the floor layout or 3D image.
- Position the Damper Widget at the required location.
- Select the Damper Widget and click Edit to open the Damper Config panel.
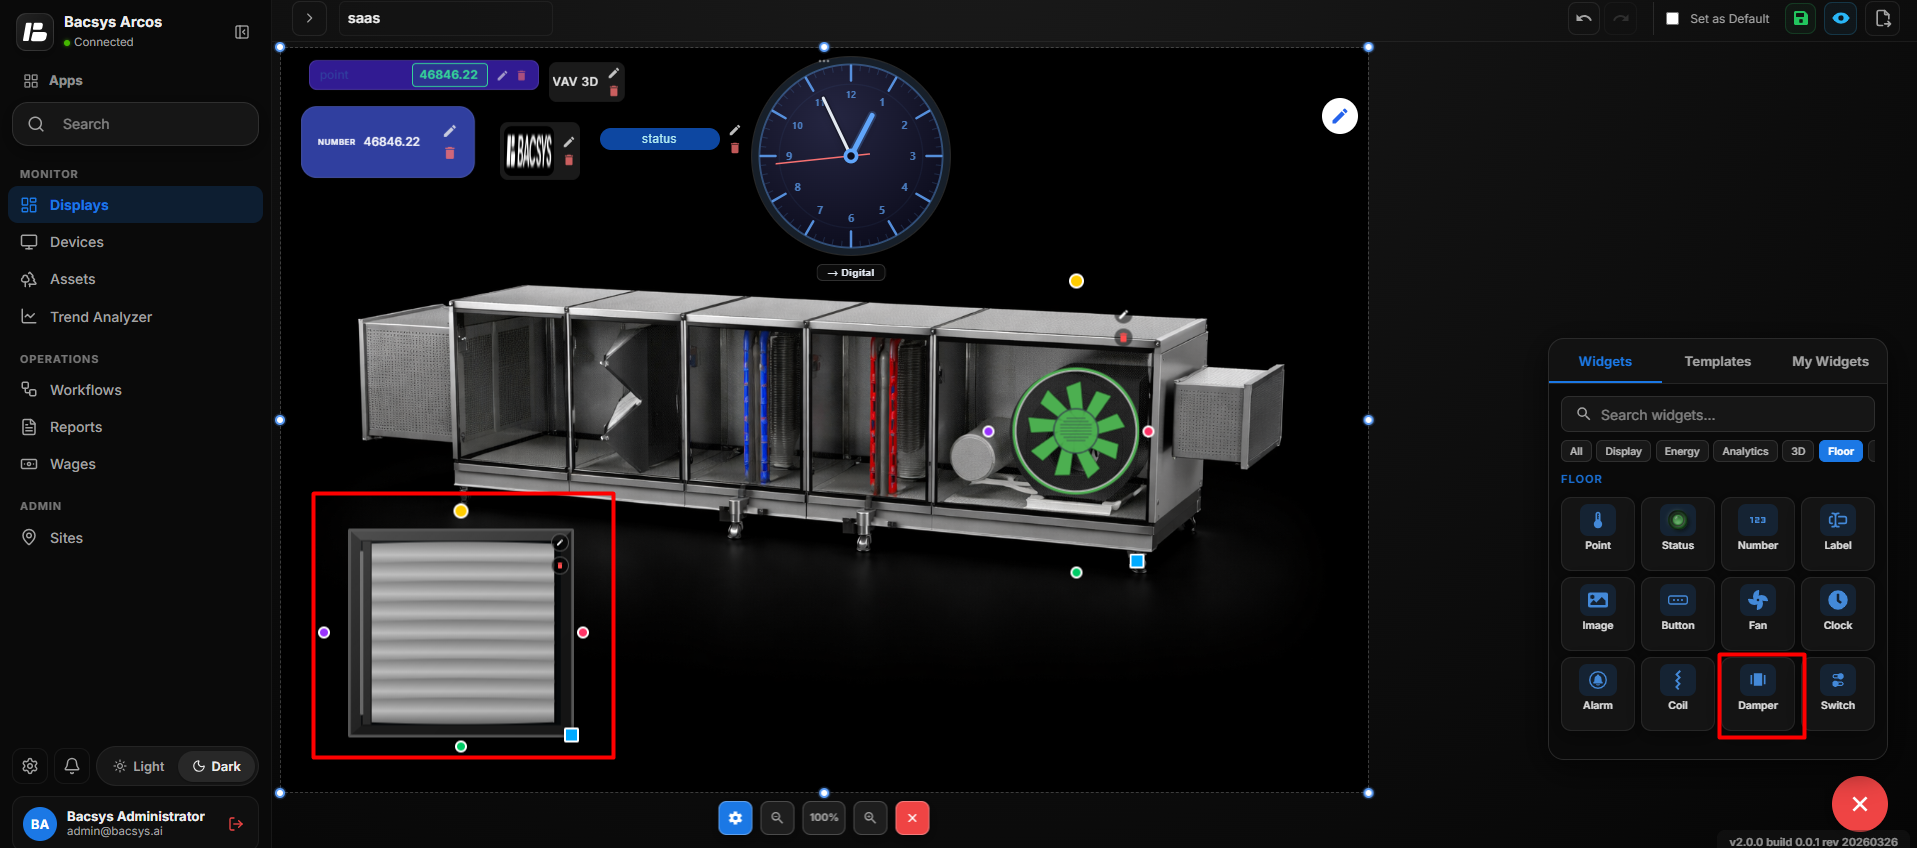 Damper Widget
 Configuration
| Setting | Description |
|---|---|
| Display Label | Defines the label displayed for the Damper Widget. |
| Widget Scale | Controls the size of the Damper Widget. |
| Connected Point | Selects the data point associated with the damper. |
| Browse Hierarchy | Allows users to browse the Network → Device → Point hierarchy and select the required point. |
| Write Enabled | Enables writing or controlling the connected damper point. |
| True Value | Defines the value sent when the damper is in the True/ON state. |
| False Value | Defines the value sent when the damper is in the False/OFF state. |
| Min Limit | Defines the minimum value allowed for the damper control. |
| Max Limit | Defines the maximum value allowed for the damper control. |
| Save Changes | Saves the configured Damper Widget settings. |
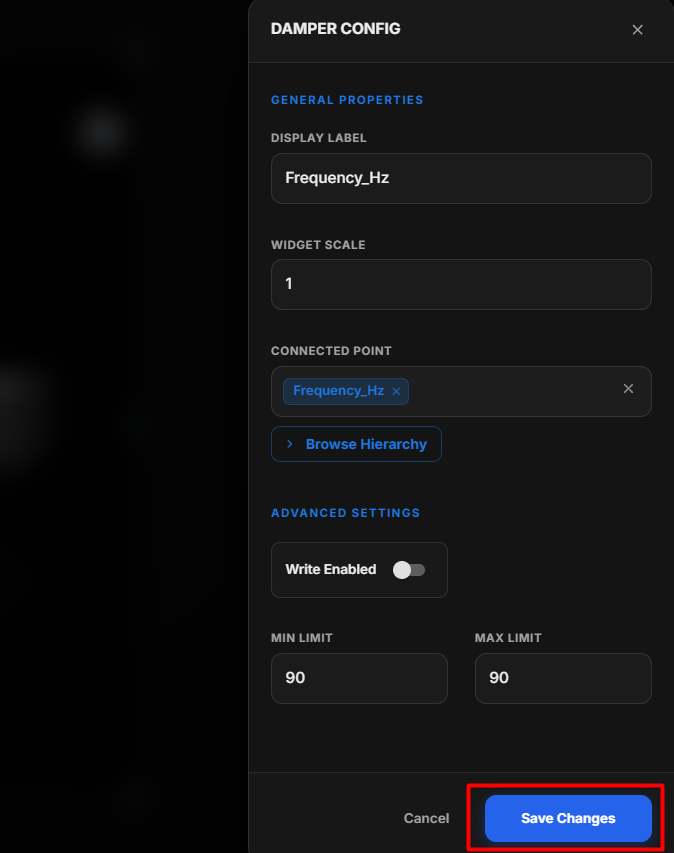 Damper Widget
- Configure the required Damper Widget settings.
- Click Save Changes.
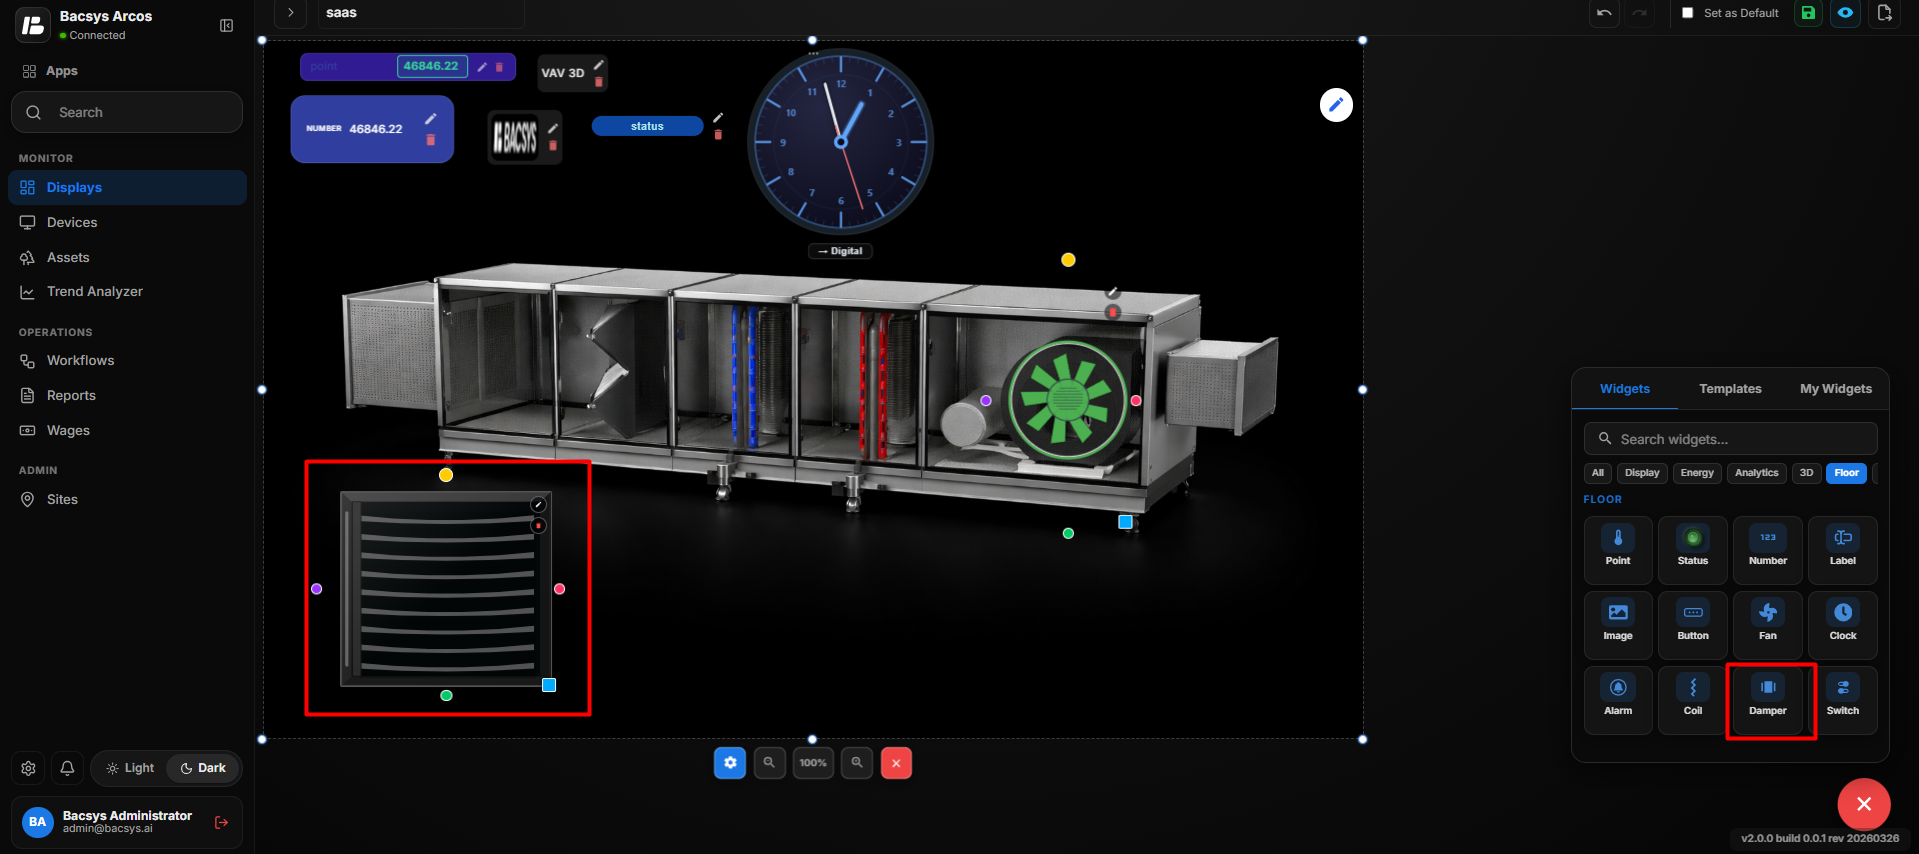 Damper Widget
- The configured Damper Widget is updated on the floor layout or 3D image.
Add and Configure the Switch Widget
- Drag and drop the Switch Widget onto the floor layout or 3D image.
- Position the Switch Widget at the required location.
- Select the Switch Widget and click Edit to open the Switch Config panel.
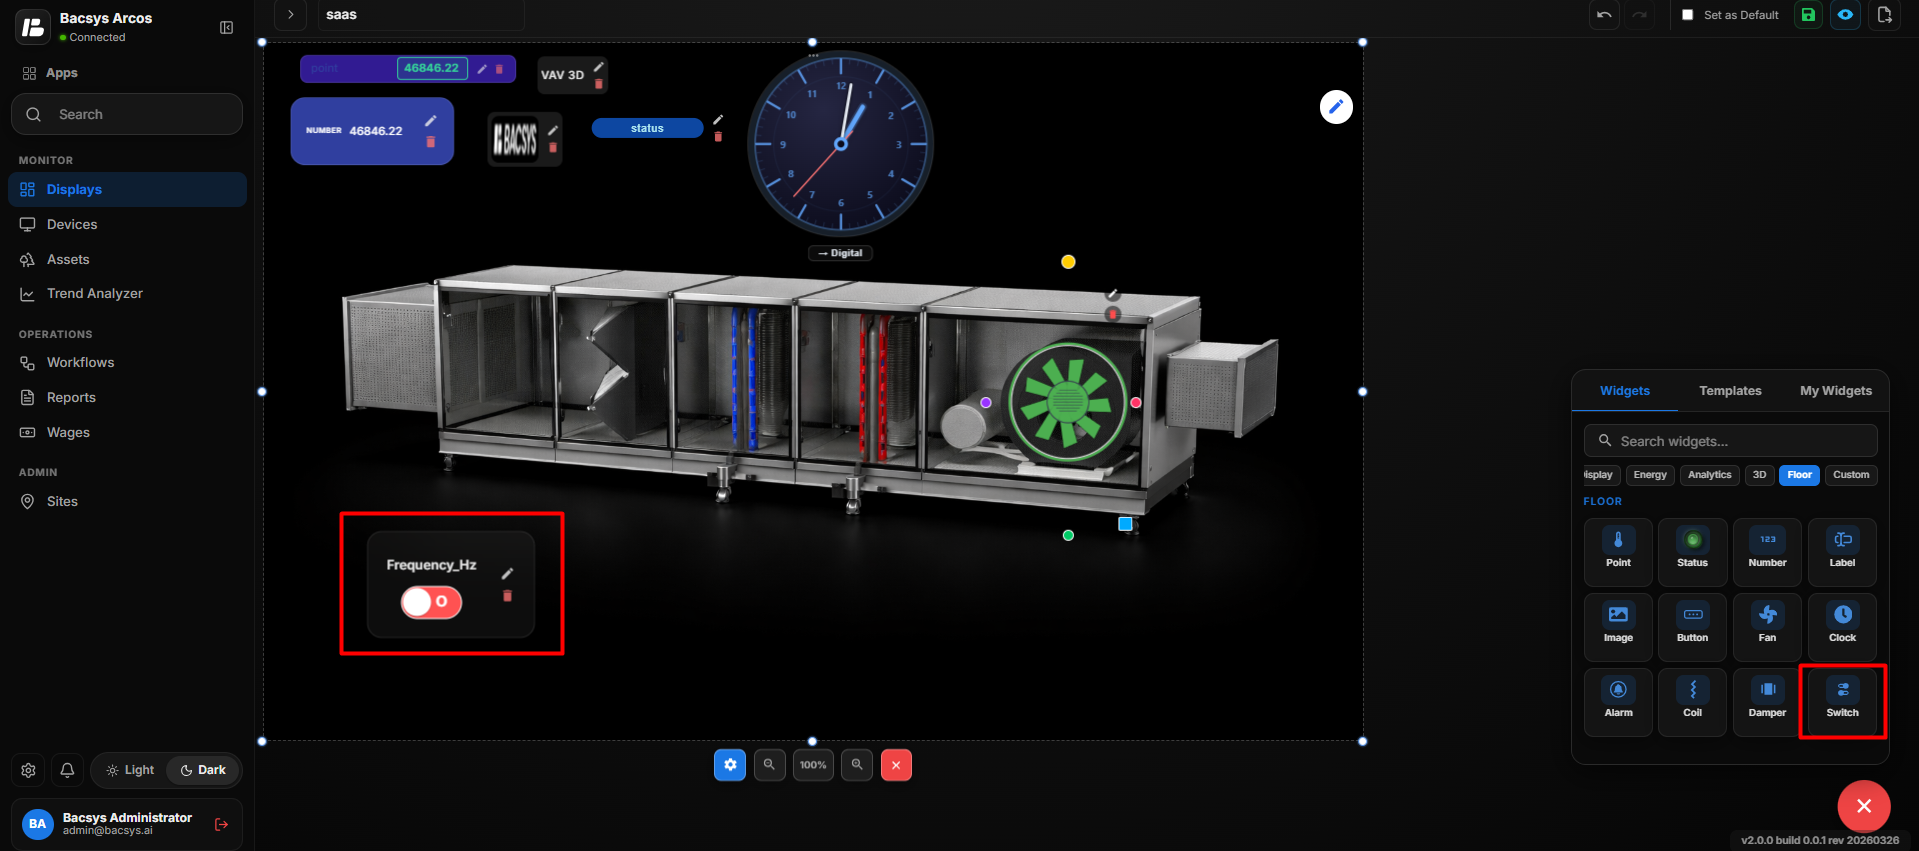 Switch Widget
 Configuration
| Setting | Description |
|---|---|
| Display Label | Defines the label displayed for the Switch Widget. |
| Widget Scale | Controls the size of the Switch Widget. |
| Connected Point | Selects the data point associated with the switch. |
| Browse Hierarchy | Allows users to browse the Network → Device → Point hierarchy and select the required point. |
| Font Size | Sets the font size of the displayed switch label or value. |
| Bold | Displays the label or value in bold text when enabled. |
| Italic | Displays the label or value in italic text when enabled. |
| Show Name | Displays the name of the connected point when enabled. |
| Transparent BG | Makes the widget background transparent when enabled. |
| Text Color | Sets the color of the switch text. |
| Widget Color | Sets the color of the Switch Widget. |
| Write Enabled | Enables writing or controlling the connected point through the Switch Widget. |
| Min Limit | Defines the minimum value allowed when writing a value. |
| Max Limit | Defines the maximum value allowed when writing a value. |
| Recent Colors | Provides quick access to previously selected colors. |
| Save Changes | Saves the configured Switch Widget settings. |
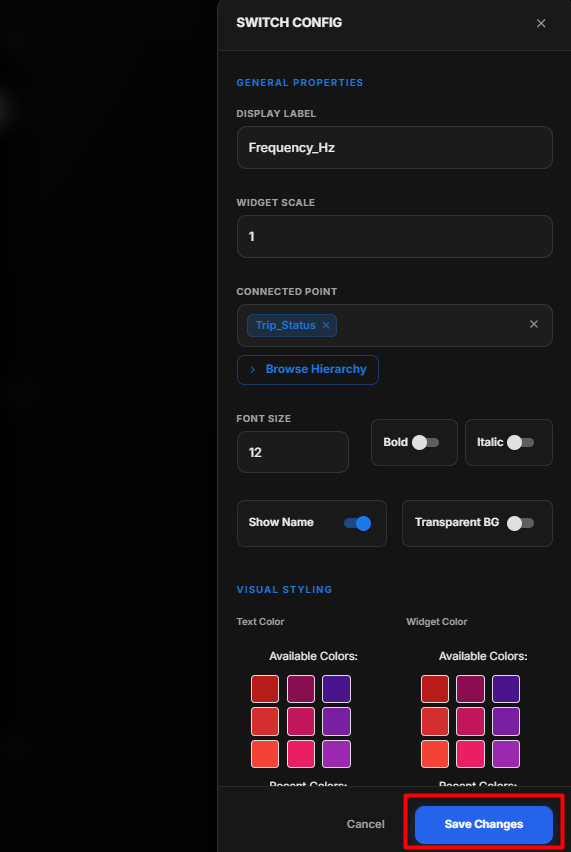 Switch Widget
Configure the Switch Widget
- Enter the required Display Label.
- Set the Widget Scale according to the required size.
- Under Connected Point, click Browse Hierarchy.
- Navigate through Network → Device → Point and select the required point.
- Configure the Font Size, Bold, and Italic options as required.
- Enable Show Name if the connected point name should be displayed.
- Enable Transparent BG if a transparent background is required.
- Select the required Text Color and Widget Color.
- Enable Write Enabled if the switch needs to control the connected point.
- Enter the required Min Limit and Max Limit when write control is enabled.
- Review the Switch Widget configuration.
- Click Save Changes.
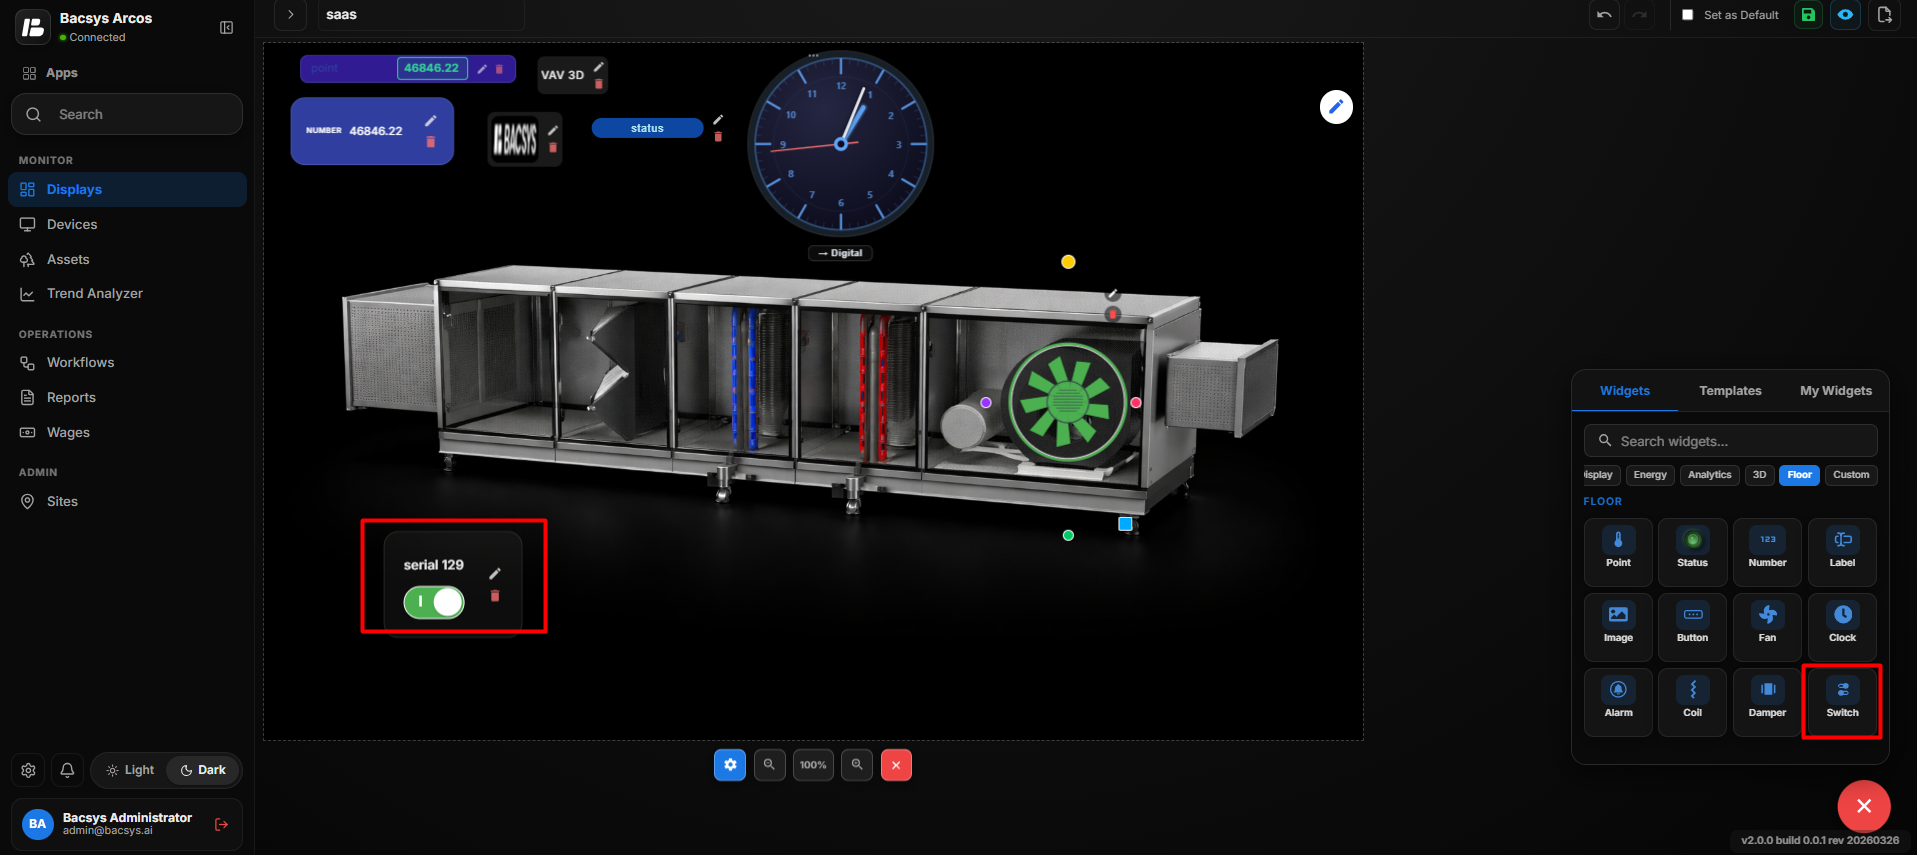 Switch Widget
- The configured Switch Widget is updated on the floor layout or 3D image.
Templates
The Templates section provides preconfigured widgets that can be added to the display for specific analysis and monitoring requirements.
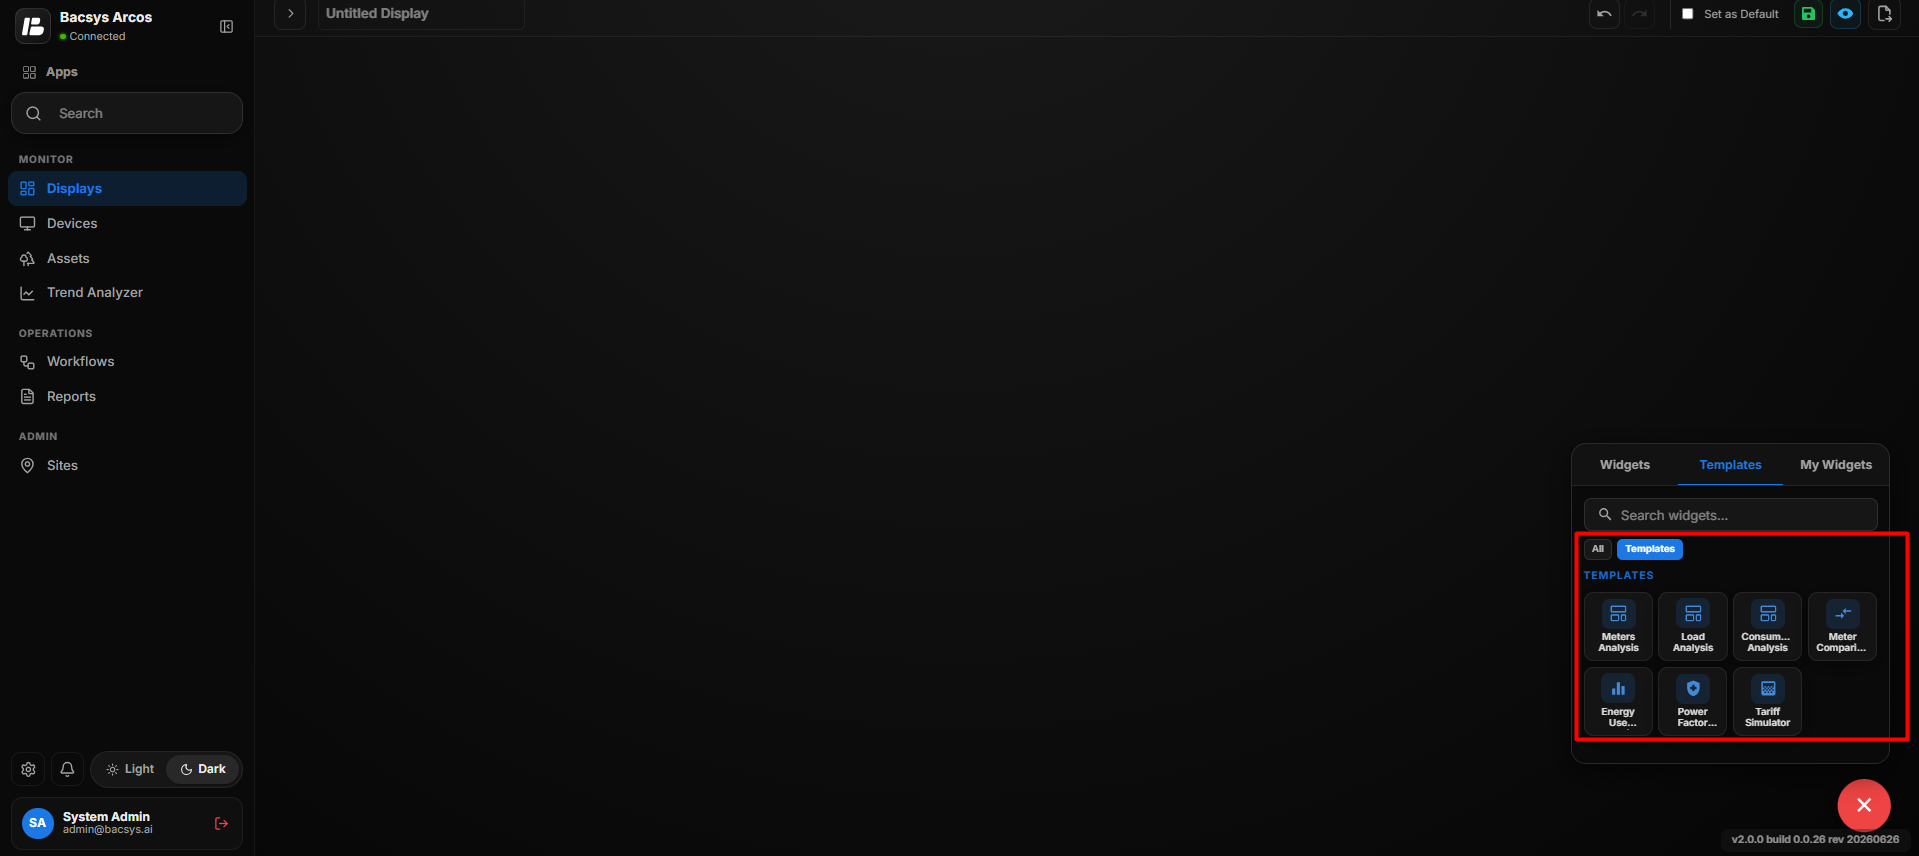 Templates
| Template | Description |
|---|---|
| Meters Analysis | Provides analysis and visualization of meter-related data and consumption information. |
| Load Analysis | Provides analysis of electrical load data and helps monitor load patterns over a selected period. |
| Consumption Analysis | Displays and analyzes energy consumption data for monitoring and comparison. |
| Meter Comparison | Allows users to compare data from multiple meters to identify differences and consumption patterns. |
| Energy Usage | Displays energy usage information for monitoring and evaluating energy consumption. |
| Power Factor | Displays and analyzes power factor values to monitor electrical system efficiency. |
| Tariff Simulator | Allows users to simulate and evaluate energy costs based on configured tariff structures. |
Add and Configure the Meters Analysis Widget
The Meters Analysis Widget provides a visual analysis of meter data on the display. It can be added from the Templates section and configured according to the required meter or data points. Users can resize the widget using the zoom controls, remove it when it is no longer required, and open its settings to configure the analysis
- Click the + icon to open the widget panel.
- Select the Templates tab.
- Drag and drop the Meters Analysis widget onto the display.
- Use the available Zoom In and Zoom Out controls to adjust the widget view.
- Use the Remove option to remove the widget from the display when required.
- Select the Meters Analysis widget and click Settings to open the Configure Data panel.
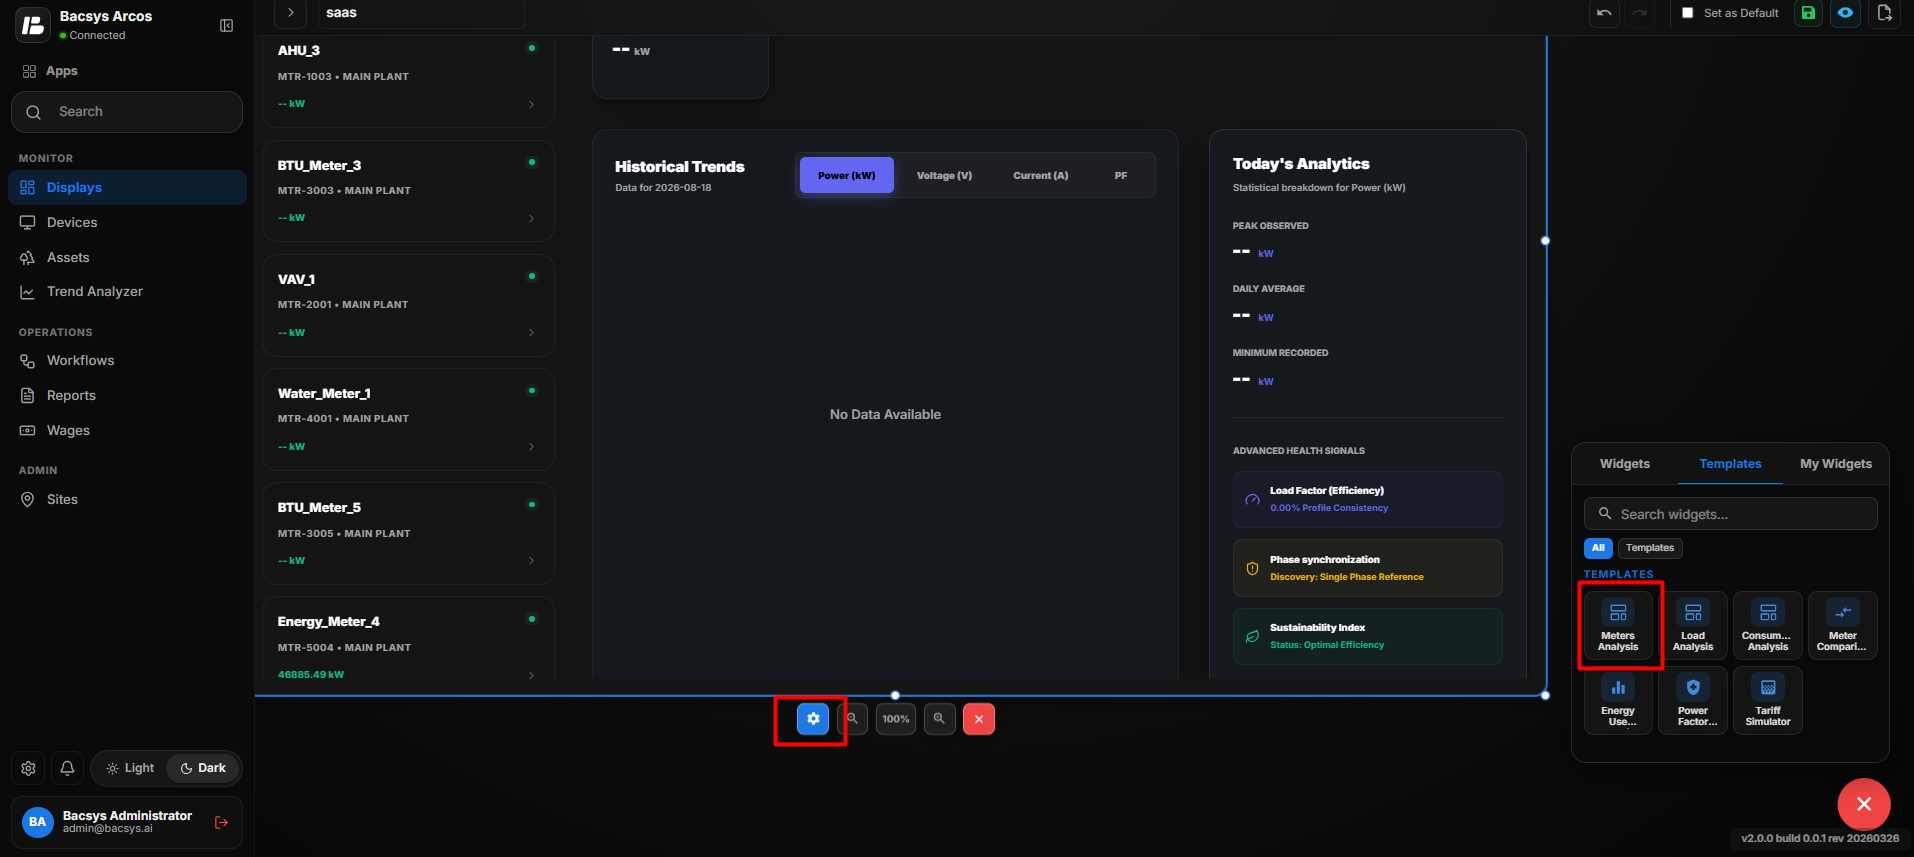 Add and Configure the Meters Analysis Widget
Meters Analysis Configuration
| Setting | Description |
|---|---|
| Title | Defines the title displayed for the Meters Analysis widget. |
| Select Visible Meters (Sidebar) | Selects the meters that are displayed in the widget sidebar. |
| Default Date Range – Start Date | Defines the default starting date for the analysis period. |
| Default Date Range – End Date | Defines the default ending date for the analysis period. |
| Voltage (L-L) | Specifies the point name used to retrieve line-to-line voltage data. |
| Voltage (L-N) | Specifies the point name used to retrieve line-to-neutral voltage data. |
| Voltage Phase R | Specifies the point name used to retrieve Phase R voltage data. |
| Voltage Phase Y | Specifies the point name used to retrieve Phase Y voltage data. |
| Voltage Phase B | Specifies the point name used to retrieve Phase B voltage data. |
| Current (Total/Avg) | Specifies the point name used to retrieve total or average current data. |
| Current Phase R | Specifies the point name used to retrieve Phase R current data. |
| Current Phase Y | Specifies the point name used to retrieve Phase Y current data. |
| Current Phase B | Specifies the point name used to retrieve Phase B current data. |
| Power Factor | Specifies the point name used to retrieve power factor data. |
| Active Power | Specifies the point name used to retrieve active power data. |
| Reactive Power | Specifies the point name used to retrieve reactive power data. |
| Active Energy | Specifies the point name used to retrieve active energy consumption data. |
| Reactive Energy | Specifies the point name used to retrieve reactive energy data. |
| Show Background | Displays the widget background when enabled. |
| Hide Header | Hides the widget header when enabled. |
| Save | Saves the configured Meters Analysis settings. |
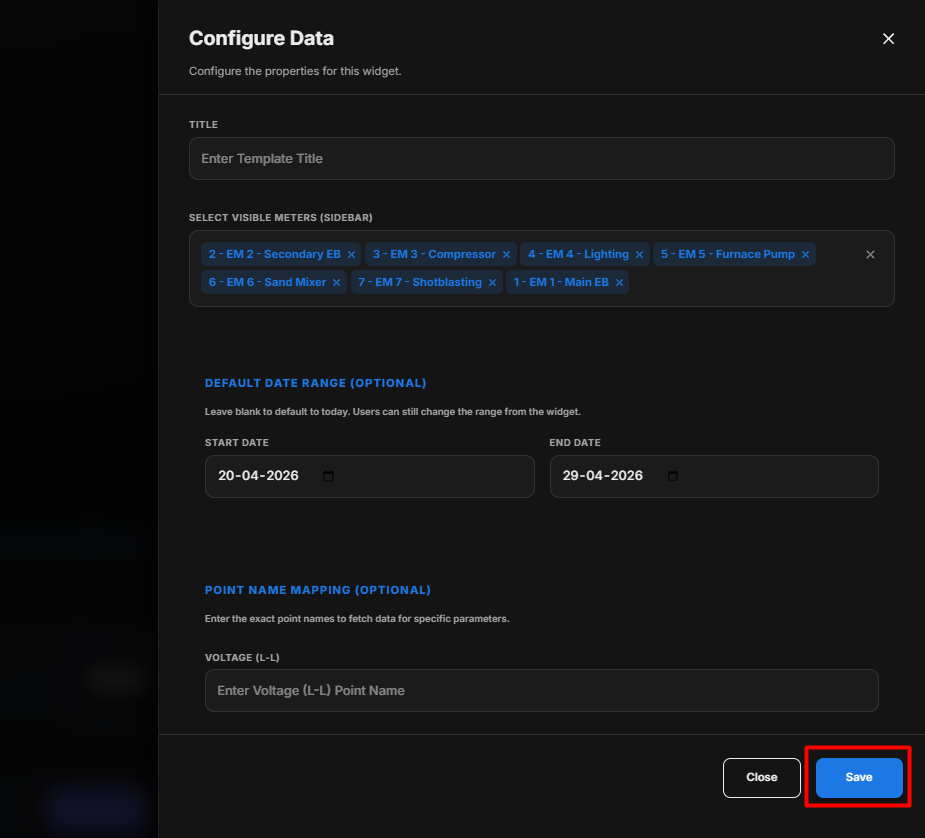 Meters Analysis Configuration
Save the Meters Analysis Configuration
- Configure the required meter and point settings.
- Select the required visible meters.
- Configure the default date range if required.
- Map the required point names to the corresponding parameters.
- Enable or disable Show Background and Hide Header as required.
- Click Save.
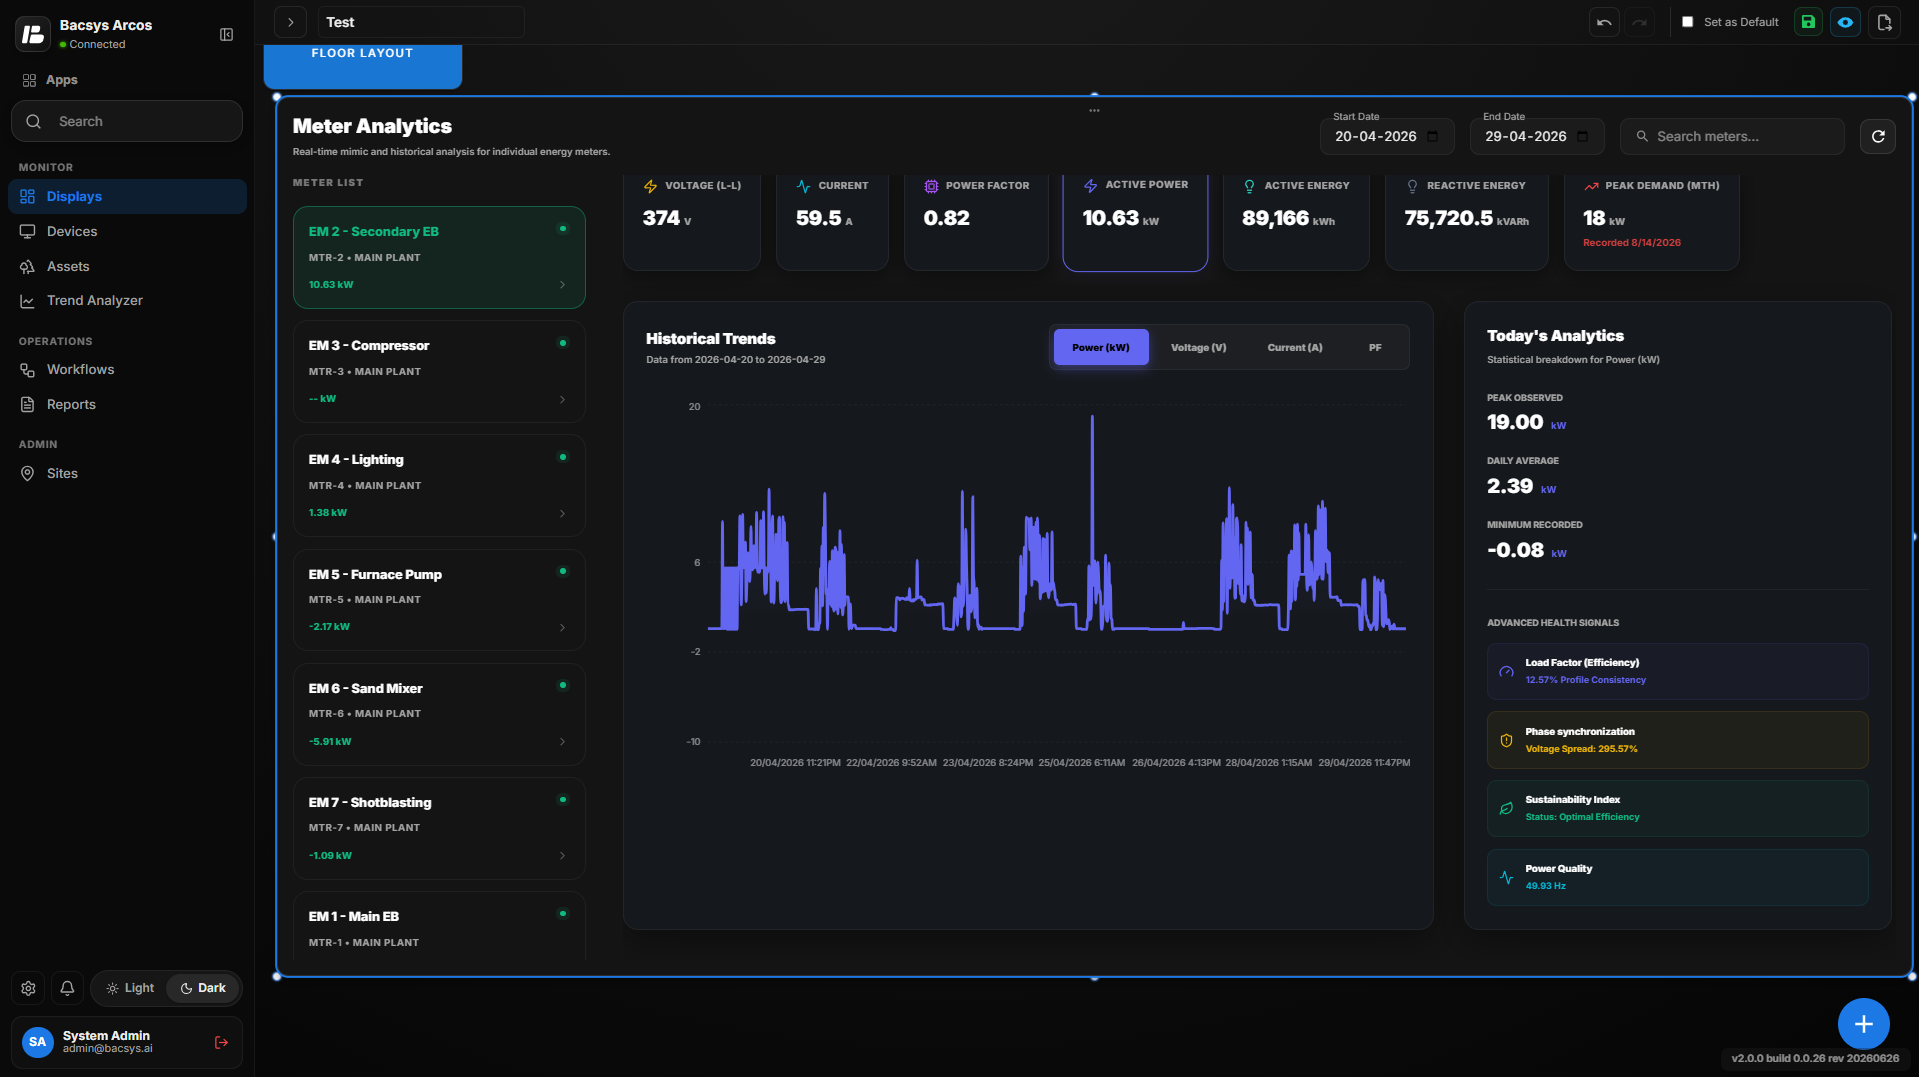 Save the Meters Analysis Configuration
- The configured Meters Analysis widget is updated on the display.
How to Configure the Meters Analysis Widget
-
In the Configure Data panel, enter the required Title for the widget.
-
Under Select Visible Meters (Sidebar), select the meters that should be available for analysis in the widget sidebar.
-
Under Default Date Range, select the required Start Date and End Date.
- Leave the dates blank to use the current date by default.
- Users can change the date range directly from the widget when required.
-
Under Point Name Mapping, enter the exact point names corresponding to the required meter parameters.
-
Configure the required voltage point mappings:
- Voltage (L-L)
- Voltage (L-N)
- Voltage Phase R
- Voltage Phase Y
- Voltage Phase B
-
Configure the required current point mappings:
- Current (Total/Avg)
- Current Phase R
- Current Phase Y
- Current Phase B
-
Configure the required power and energy point mappings:
- Power Factor
- Active Power
- Reactive Power
- Active Energy
- Reactive Energy
-
Verify that the entered point names exactly match the corresponding points configured for the selected meters.
-
Configure Show Background according to the required display appearance.
-
Enable Hide Header if the widget header should not be displayed.
-
Review all meter selections, date settings, and point mappings.
-
Click Save to save the Meters Analysis configuration.
-
The Meters Analysis Widget is updated on the display with the configured meter data.
Meters Analysis Widget Usage
After configuration, users can:
- Select a meter from the sidebar to view its analysis.
- Change the date range to analyze data for a different period.
- View the configured voltage, current, power, and energy parameters.
- Use Zoom In and Zoom Out to adjust the widget view.
- Remove the widget from the display using the Remove option when required.
Add and Configure the Load Analysis Widget
The Load Analysis Widget provides a visual representation of load-related data on the display. It is available under the Templates section and can be added to a display for analyzing the configured load data.
Users can position and resize the widget as required, use the Zoom In and Zoom Out controls to adjust its view, and open the Settings panel to configure the widget properties.
- Click the + icon to open the widget panel.
- Select the Templates tab.
- Drag and drop the Load Analysis widget onto the display.
- Position and resize the widget as required.
- Use the Zoom In and Zoom Out controls to adjust the widget view.
- Select the Load Analysis widget and click Settings to open the Configure Data panel.
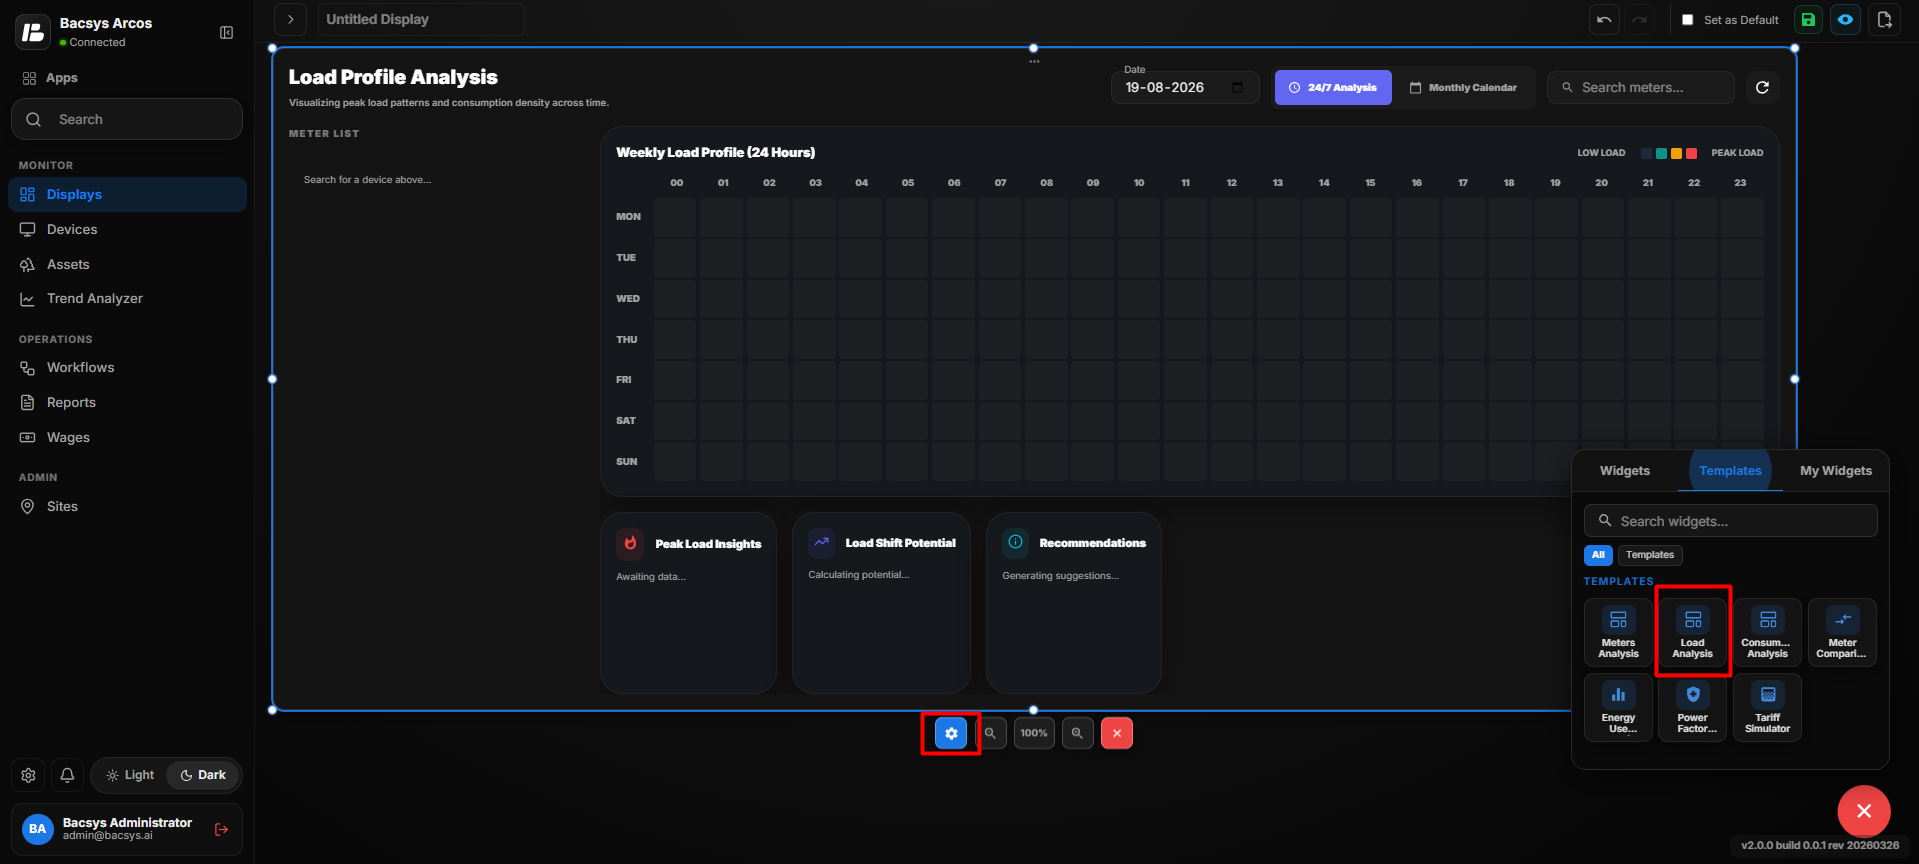 Load Analysis Widget
Load Analysis Configuration
| Setting | Description |
|---|---|
| Title | Defines the title displayed for the Load Analysis widget. |
| Select Visible Meters (Sidebar) | Allows users to search for and select the meters that should be displayed in the widget sidebar. |
| Show Background | Displays the widget background when enabled. |
| Hide Header | Hides the widget header when enabled. |
| Save | Saves the configured Load Analysis settings. |
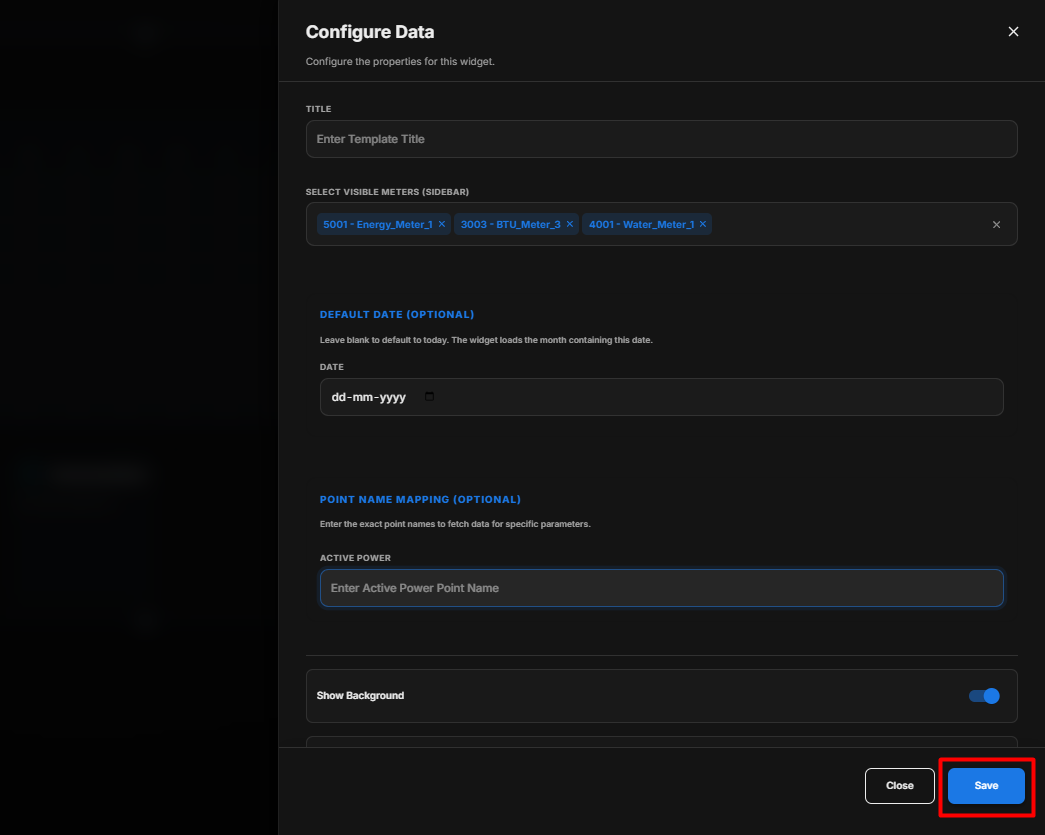 Load Analysis Configuration
How to Configure the Load Analysis Widget
- Enter the required Title for the widget.
- Under Select Visible Meters (Sidebar), click Search and Add Meters.
- Search for the required meter.
- Select one or more meters to add them to the Load Analysis widget.
- Verify that the selected meters are displayed in the meter list/sidebar.
- Enable or disable Show Background according to the display requirements.
- Enable Hide Header if the widget header should not be displayed.
- Review the selected meters and other configuration settings.
- Click Save.
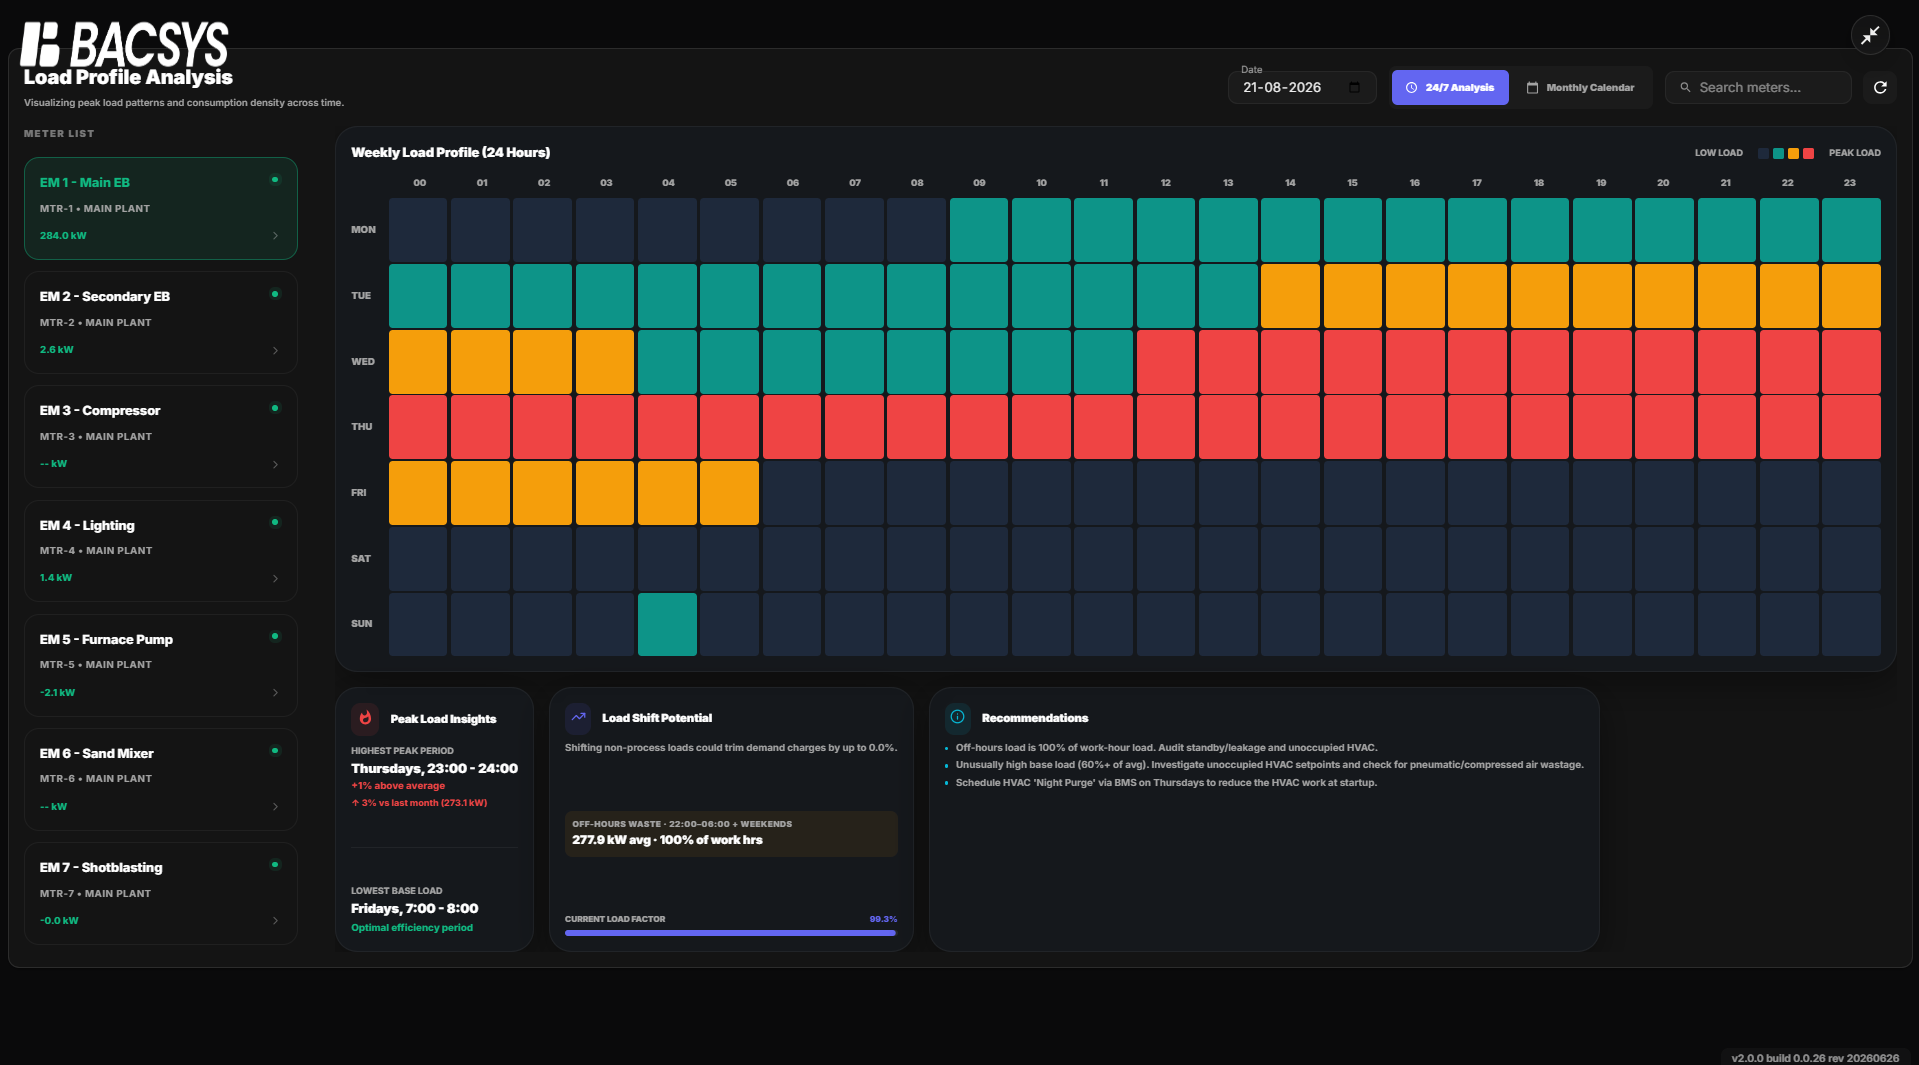 Save Load Analysis Configuration
- The configured Load Analysis widget is displayed on the display.
- The selected meters are available in the Meter List for analysis.
- Users can use the 24/7 Analysis and Monthly Calendar views to analyze load patterns.
- The Search Meters option can be used to quickly find a configured meter.
- Use the Zoom In and Zoom Out controls to adjust the widget view when required.
Add and Configure the Consumption Analytics Widget
- Click the + icon to open the widget panel.
- Select the Templates tab.
- Drag and drop the Consumption Analytics widget onto the display.
- Position and resize the widget as required.
- Use the Zoom In and Zoom Out controls to adjust the widget view.
- Select the Consumption Analytics widget and click Settings to open the Configure Data panel.
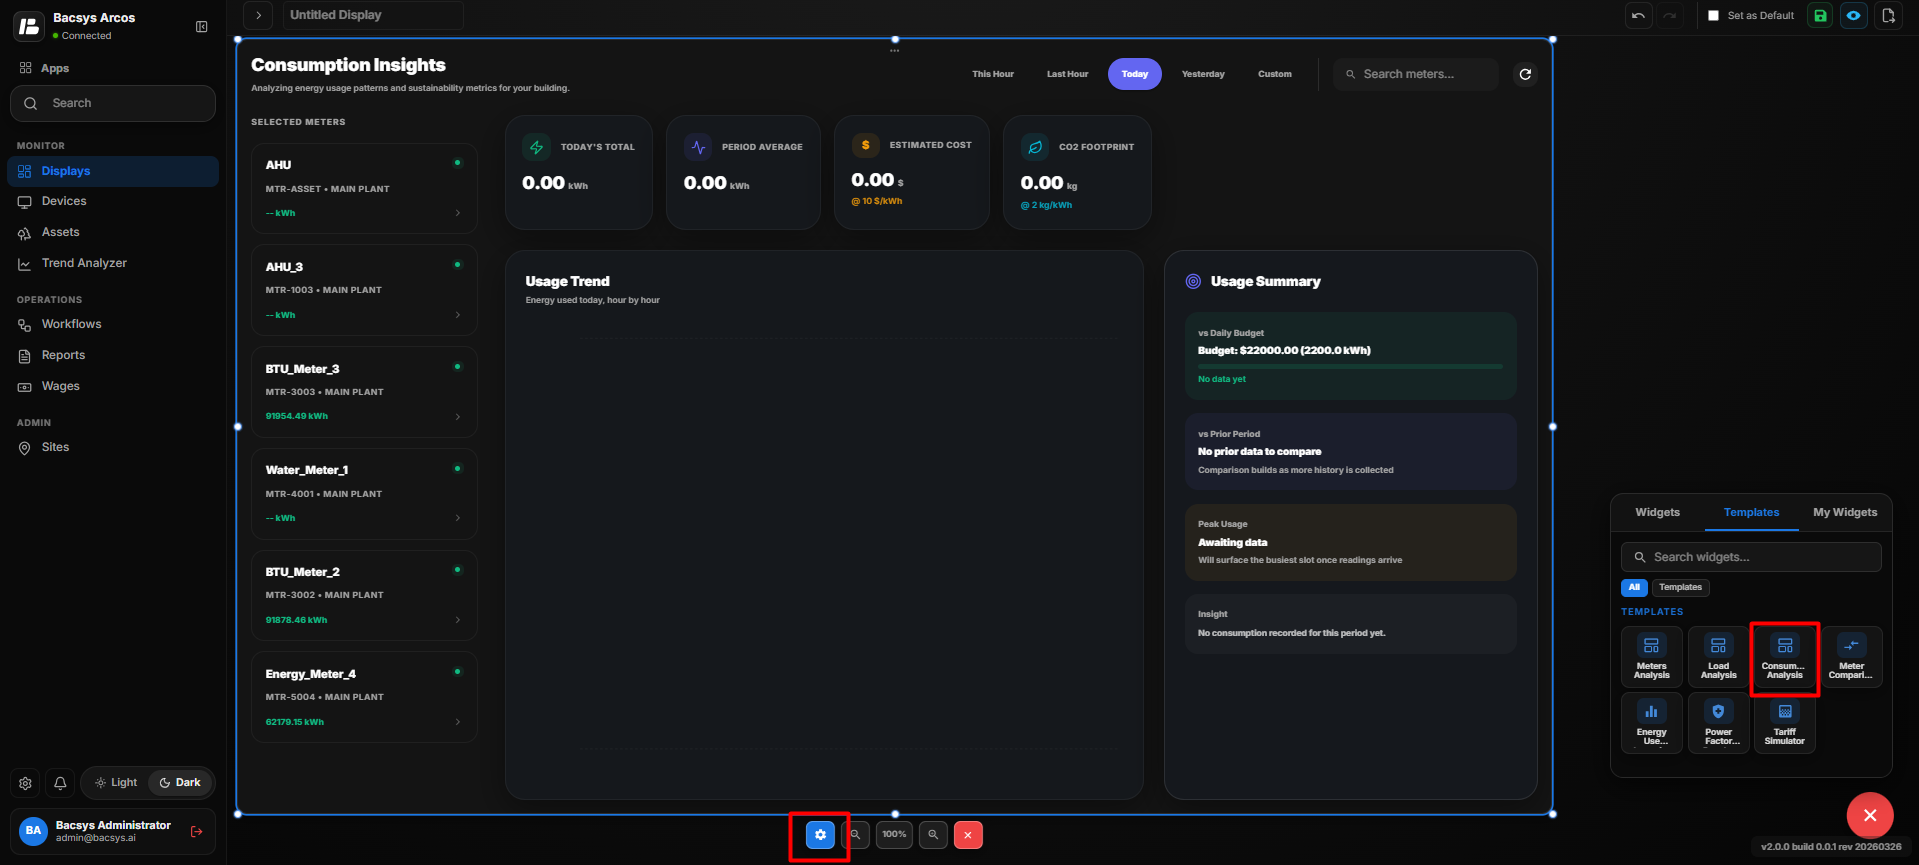 Consumption Analytics Widget
Consumption Analytics Configuration
| Setting | Description |
|---|---|
| Title | Defines the title displayed for the Consumption Analytics widget. |
| Select Visible Meters (Sidebar) | Allows users to select the meters that should be displayed in the widget sidebar. |
| Energy Budget (kWh/Day) | Defines the daily energy consumption budget used for comparison and analysis. |
| Energy Rate (Tariff) | Selects the applicable energy tariff used to calculate the estimated energy cost. |
| CO2 Factor | Selects the CO2 conversion factor used to calculate the carbon footprint. |
| Currency Symbol | Defines the currency used to display estimated energy costs. |
| Default Time Range | Defines the initial time period displayed when the widget is loaded. |
| Time Range | Provides options such as This Hour, Last Hour, Today, Yesterday, and Custom. |
| Active Energy | Specifies the exact point name used to retrieve active energy consumption data. |
| Show Background | Displays the widget background when enabled. |
| Hide Header | Hides the widget header when enabled. |
| Save | Saves the configured Consumption Analytics settings. |
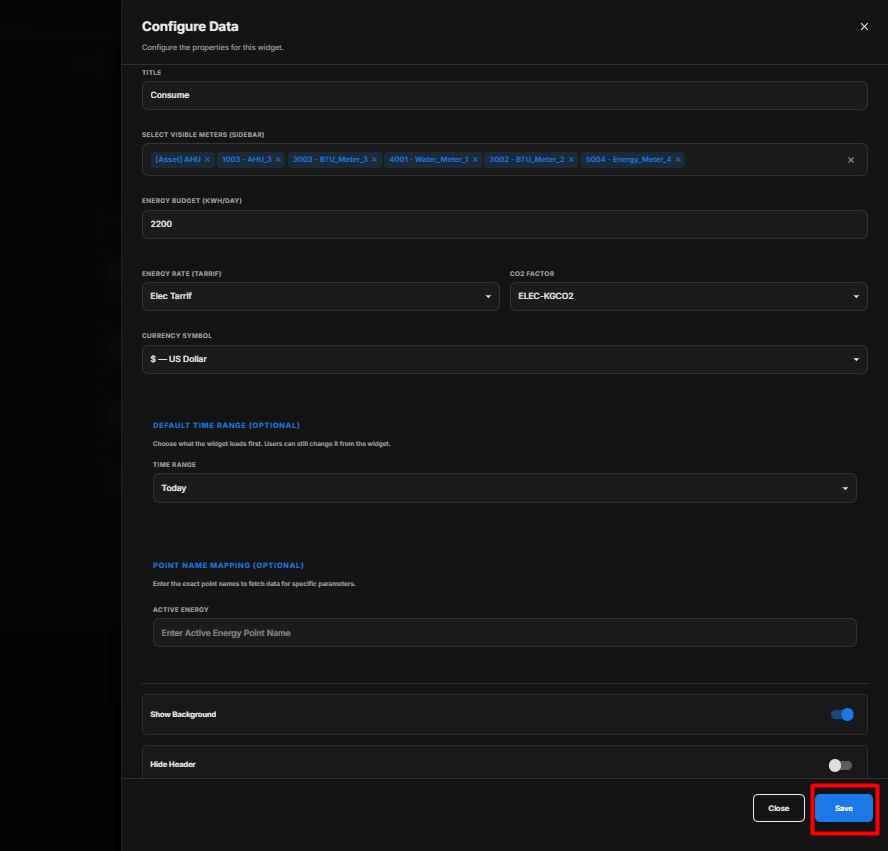 Consumption Analytics Configuration
How to Configure the Consumption Analytics Widget
- Enter the required Title for the widget.
- Under Select Visible Meters (Sidebar), search for and select the meters that should be available for consumption analysis.
- Enter the required Energy Budget (kWh/Day).
- Select the required Energy Rate (Tariff) from the available tariff options.
- Select the required CO2 Factor for calculating the carbon footprint.
- Select the required Currency Symbol for displaying estimated costs.
- Under Default Time Range, select the initial period that should be loaded when the widget opens:
- This Hour
- Last Hour
- Today
- Yesterday
- Custom
- Under Point Name Mapping, enter the exact Active Energy Point Name used by the selected meters.
- Verify that the entered point name matches the configured meter point.
- Enable or disable Show Background as required.
- Enable Hide Header if the widget header should not be displayed.
- Review all configured meter, tariff, CO2, currency, date-range, and point-mapping settings.
- Click Save.
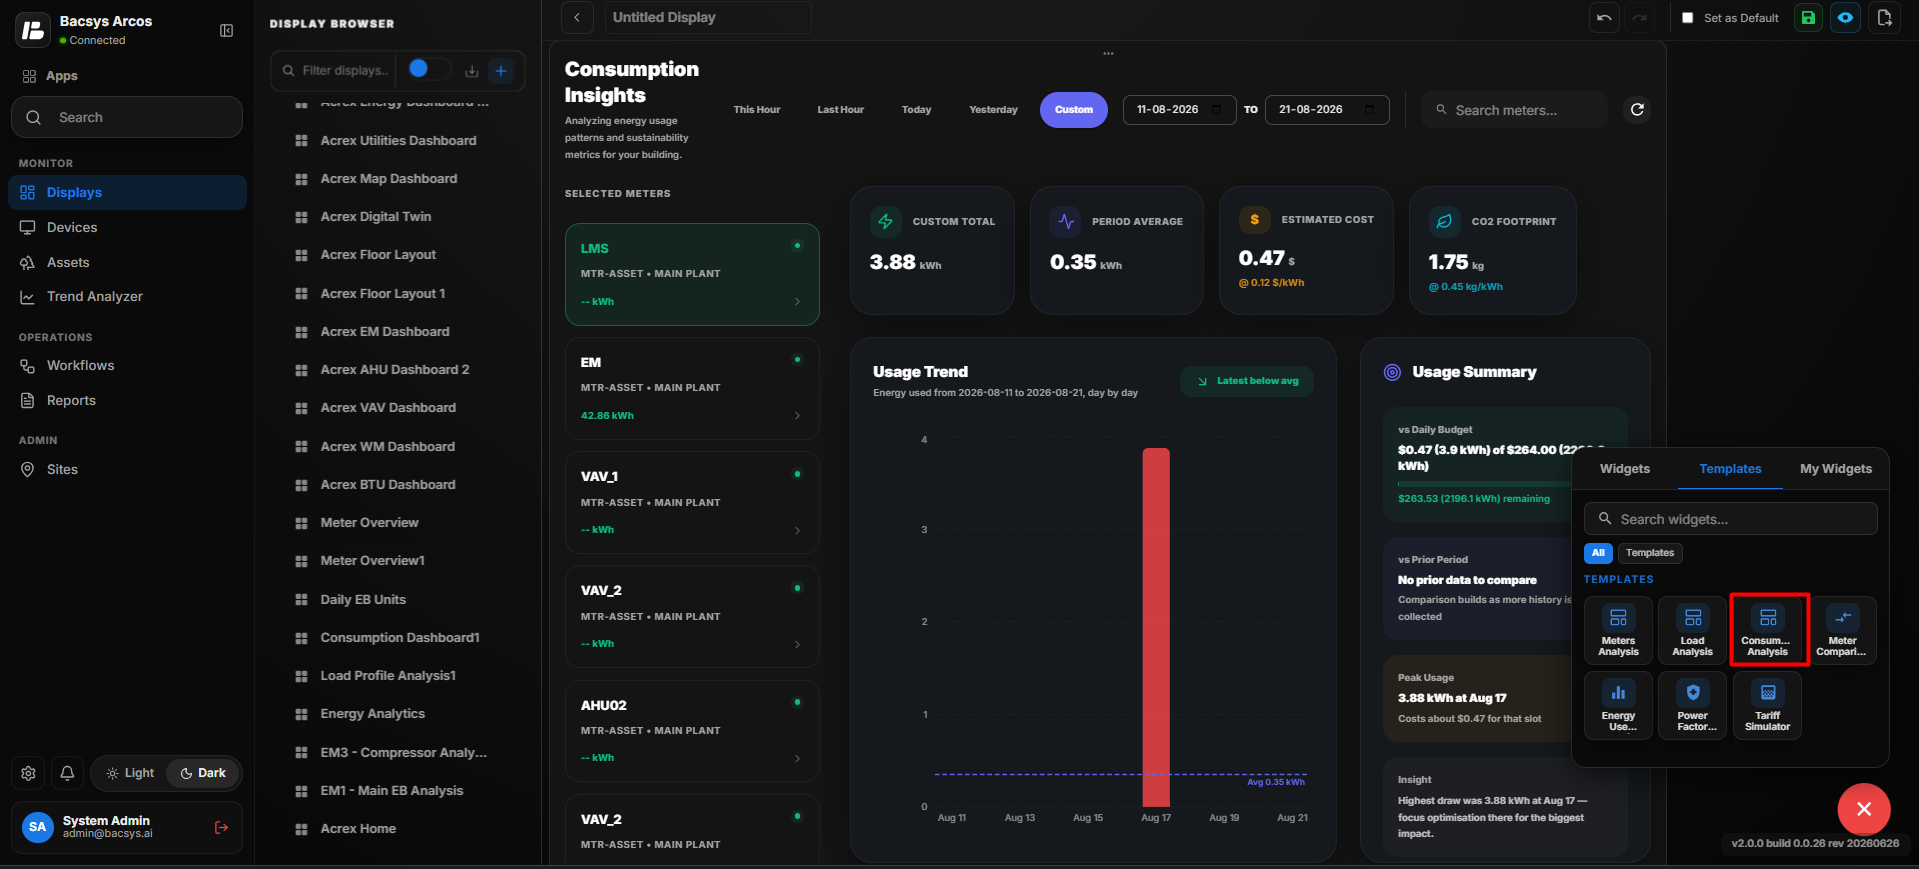 Save Consumption Analytics Configuration
Consumption Analytics Widget Controls
After the widget is configured, users can:
| Control | Description |
|---|---|
| Time Range | Changes the analysis period displayed by the widget. |
| Search Meters | Searches for a configured meter. |
| Zoom In | Enlarges the widget view for better visibility. |
| Zoom Out | Reduces the widget view to display more information. |
| Delete / Remove | Removes the Consumption Analytics widget from the display. |
| Settings | Opens the configuration panel to modify the widget settings. |
| Refresh | Refreshes the displayed consumption data. |
The configured Consumption Analytics widget displays consumption metrics, usage trends, estimated cost, CO2 footprint, and usage summaries based on the selected meters and configured settings.
Add and Configure the Meter Comparison Widget
The Meter Comparison Widget is used to compare data from meters on the display. It provides a dedicated view for analyzing and comparing meter-related values based on the configured settings.
Users can add the widget from the Templates section, position and resize it on the display, and use the Settings option to configure the required meter comparison properties.
- Click the + icon to open the widget panel.
- Select the Templates tab.
- Drag and drop the Meter Comparison widget onto the display.
- Position the Meter Comparison widget at the required location.
- Use the Zoom In and Zoom Out controls to adjust the widget view.
- Select the Meter Comparison widget and click Settings to open the Configure Data panel.
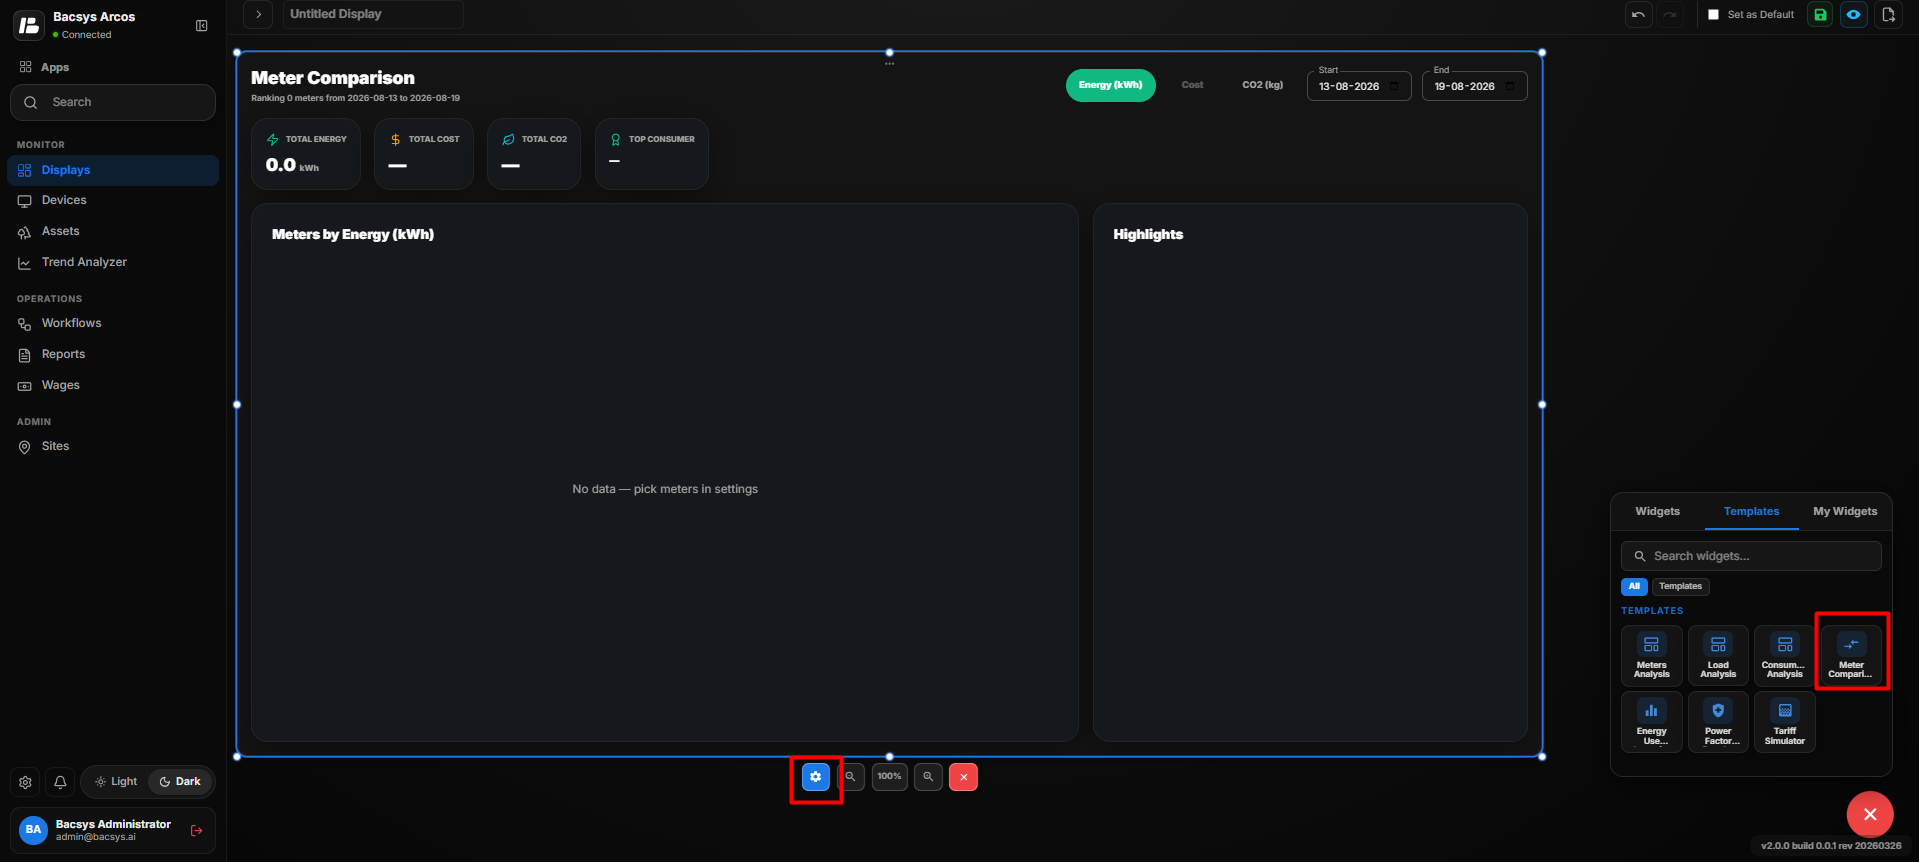 Meter Comparison Widget
Meter Comparison Configuration
| Setting | Description |
|---|---|
| Title | Defines the title displayed for the Meter Comparison widget. |
| Select Visible Meters (Sidebar) | Allows users to search for and select the meters that will be included in the comparison. |
| Energy Rate (Tariff) | Selects the tariff used to calculate energy-related cost information. |
| CO2 Factor | Selects the CO2 conversion factor used to calculate the carbon footprint. |
| Currency Symbol | Defines the currency used to display cost values. |
| Show Background | Displays the widget background when enabled. |
| Hide Header | Hides the widget header when enabled. |
| Save | Saves the configured Meter Comparison settings. |
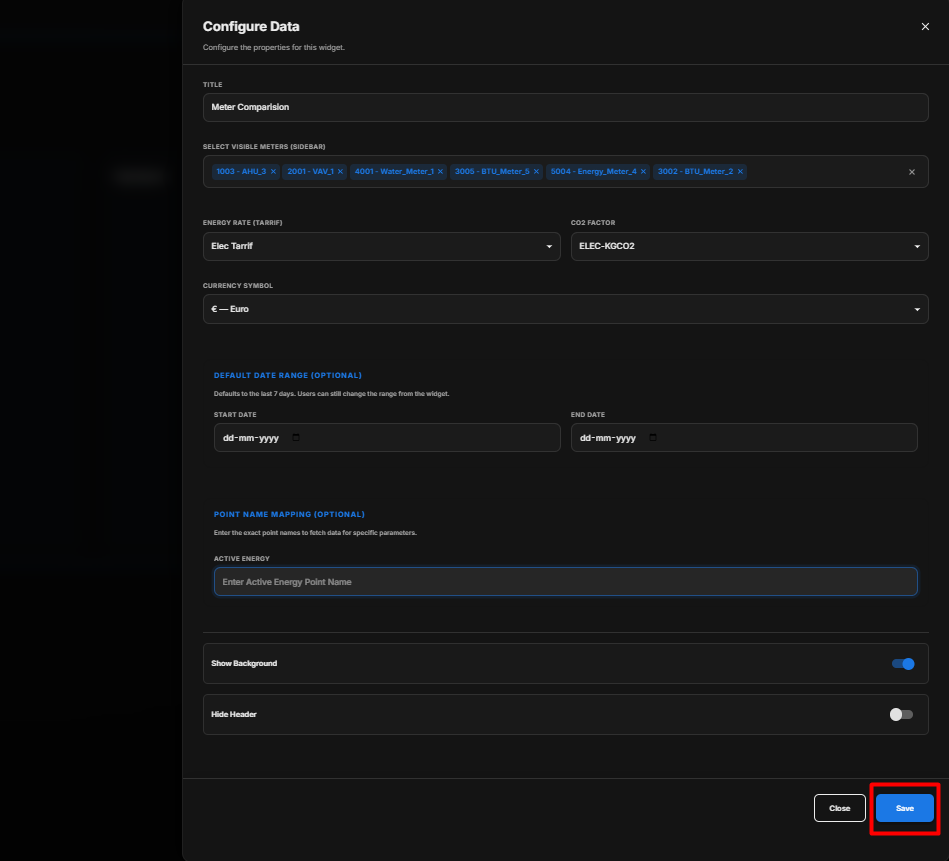 Meter Comparison Configuration
How to Configure the Meter Comparison Widget
- Enter the required Title.
- Under Select Visible Meters (Sidebar), search for and select the meters that should be included in the comparison.
- Under Energy Rate (Tariff), select the required tariff from the available options.
- Under CO2 Factor, select the required CO2 factor:
- ELEC-KGCO2
- BTU-KgCO2
- Under Currency Symbol, select the required currency, such as:
- US Dollar
- Euro
- British Pound
- Indian Rupee
- Malaysian Ringgit
- UAE Dirham
- Saudi Riyal
- Singapore Dollar
- Australian Dollar
- Enable or disable Show Background as required.
- Enable Hide Header if the widget header should not be displayed.
- Review the configured meters, tariff, CO2 factor, currency, and display settings.
- Click Save.
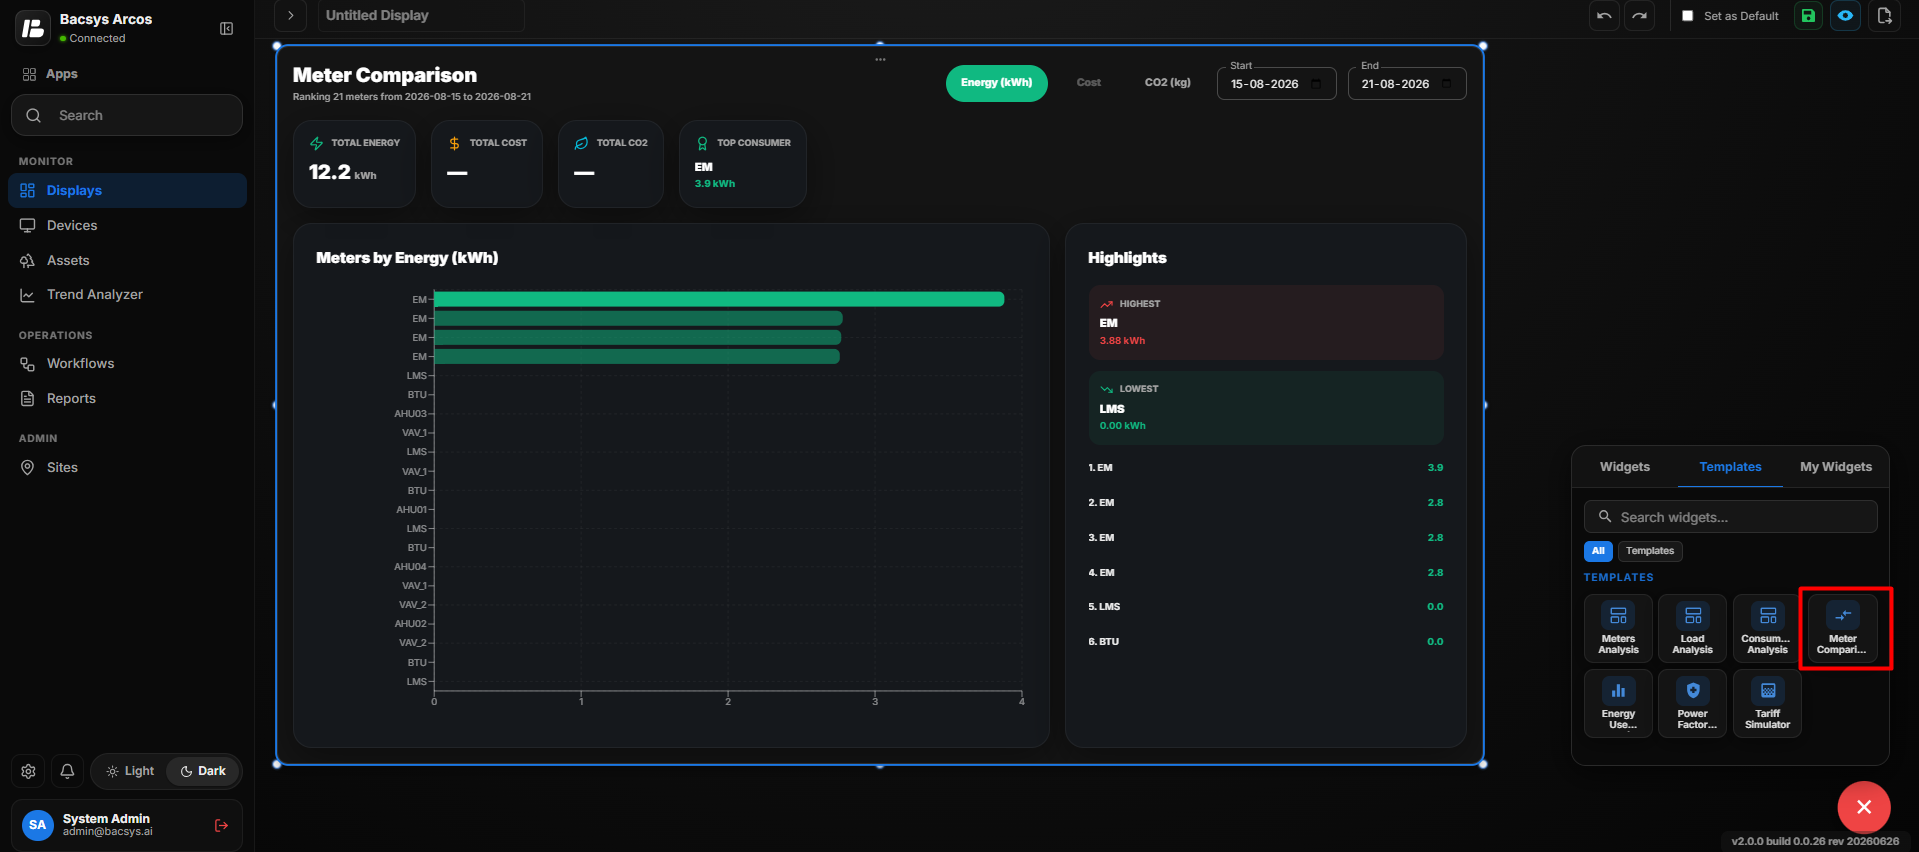 Meter Comparison Saved Configuration
Meter Comparison Widget Controls
| Control | Description |
|---|---|
| Energy (kWh) | Displays the comparison based on energy consumption. |
| Cost | Displays the comparison based on energy cost. |
| CO2 (kg) | Displays the comparison based on CO2 emissions. |
| Start Date | Defines the beginning of the comparison period. |
| End Date | Defines the end of the comparison period. |
| Search Meters | Searches for meters available in the comparison. |
| Zoom In | Enlarges the widget view. |
| Zoom Out | Reduces the widget view. |
| Settings | Opens the configuration panel to modify the widget settings. |
| Delete / Remove | Removes the Meter Comparison widget from the display. |
After saving, the Meter Comparison widget compares the selected meters for the configured date range and displays the relevant energy, cost, and CO2 information.
Add and Configure the Energy Use Intensity (EUI) Widget
The Energy Use Intensity (EUI) Widget is used to display and analyze energy usage intensity on the display. It is available under the Templates section and can be added to a display for monitoring energy performance.
The widget can be positioned and resized according to the display layout. Users can also open the Settings panel to configure the EUI widget properties.
- Click the + icon to open the widget panel.
- Select the Templates tab.
- Drag and drop the Energy Use Intensity (EUI) widget onto the display.
- Position the widget at the required location.
- Use the Zoom In and Zoom Out controls to adjust the widget view.
- Use the Delete/Remove option to remove the widget when required.
- Select the EUI Widget and click Settings to open the Configure Data panel.
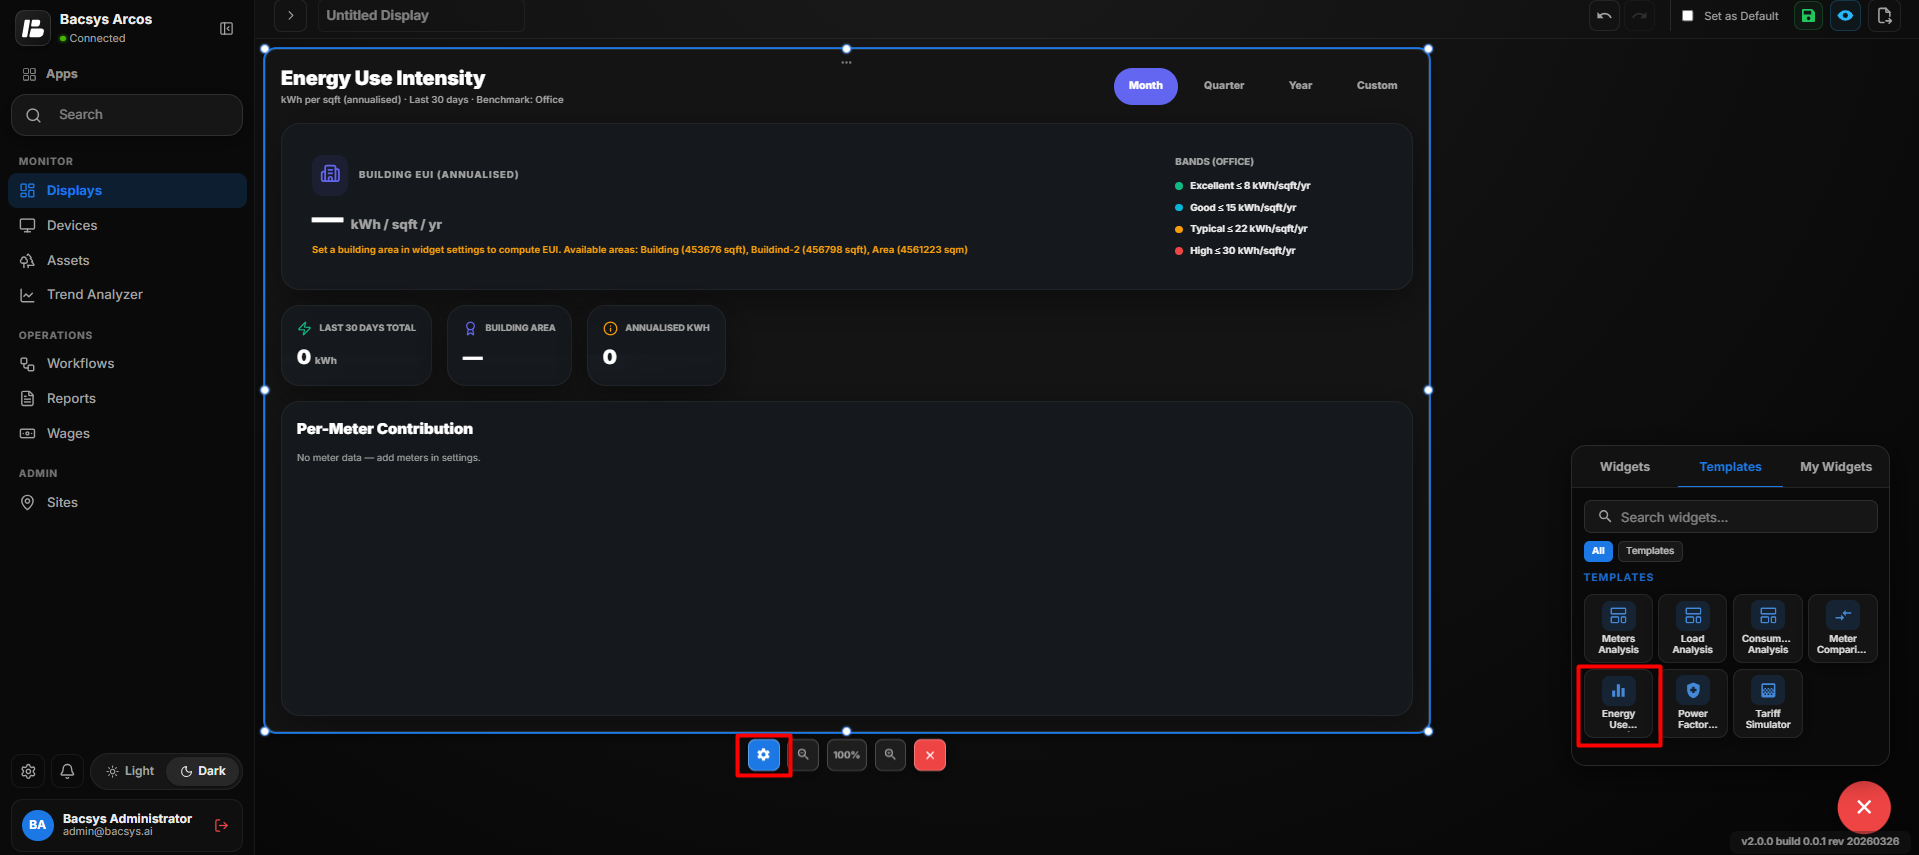 Energy Use Intensity Widget
EUI Widget Configuration
| Setting | Description |
|---|---|
| Title | Defines the title displayed for the EUI widget. |
| Select Visible Meters (Sidebar) | Allows users to search for and select the meters used for EUI analysis. |
| Energy Rate (Tariff) | Selects the tariff used to calculate energy cost information. |
| CO2 Factor | Selects the CO2 conversion factor used for emissions calculations. Available options include ELEC-KGCO2 and BTU-KgCO2. |
| Currency Symbol | Selects the currency used to display cost-related values, such as US Dollar, Euro, British Pound, Indian Rupee, and other available currencies. |
| Building Area | Selects the building area used to calculate Energy Use Intensity. |
| Building Type | Defines the building type used for the EUI benchmark. Available options include Office, Hospital, School (K-12), Hotel, Retail, Warehouse, Data Center, and Custom. |
| Excellent Limit | Defines the maximum EUI value for the Excellent benchmark category. |
| Good Limit | Defines the maximum EUI value for the Good benchmark category. |
| Typical Limit | Defines the maximum EUI value for the Typical benchmark category. |
| High Limit | Defines the maximum EUI value for the High benchmark category. |
| Default Period | Defines the period used to calculate the EUI. Options include Last 30 days, Last 90 days, Last 365 days, and Custom Range. |
| Show Background | Displays the widget background when enabled. |
| Hide Header | Hides the widget header when enabled. |
| Save | Saves the configured EUI widget settings. |
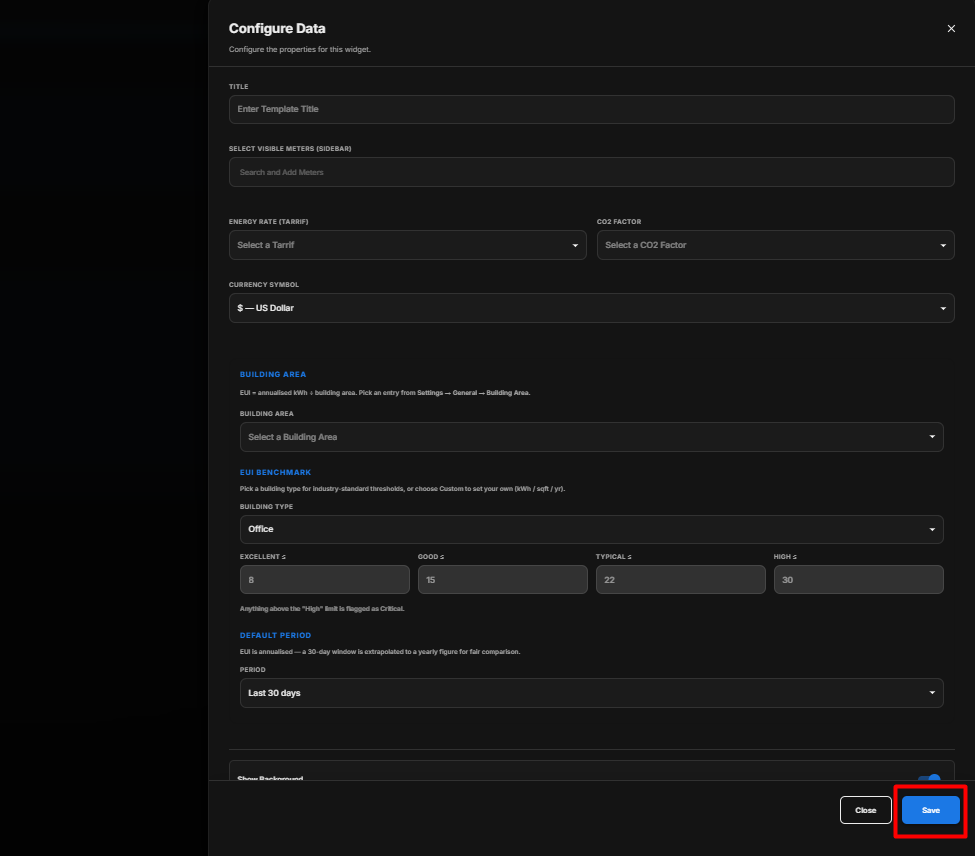 EUI Widget Configuration
Configure the EUI Widget
- Enter the required Title.
- Under Select Visible Meters (Sidebar), search for and select the meters that should be included in the EUI calculation.
- Select the required Energy Rate (Tariff).
- Select the required CO2 Factor.
- Select the required Currency Symbol.
- Under Building Area, select the required building area.
- Under EUI Benchmark, select the required Building Type.
- If Custom is selected, configure the required Excellent, Good, Typical, and High benchmark limits.
- Under Default Period, select the required analysis period:
- Last 30 days
- Last 90 days
- Last 365 days
- Custom Range
- Enable or disable Show Background as required.
- Enable Hide Header if the widget header should not be displayed.
- Review all configured settings.
- Click Save.
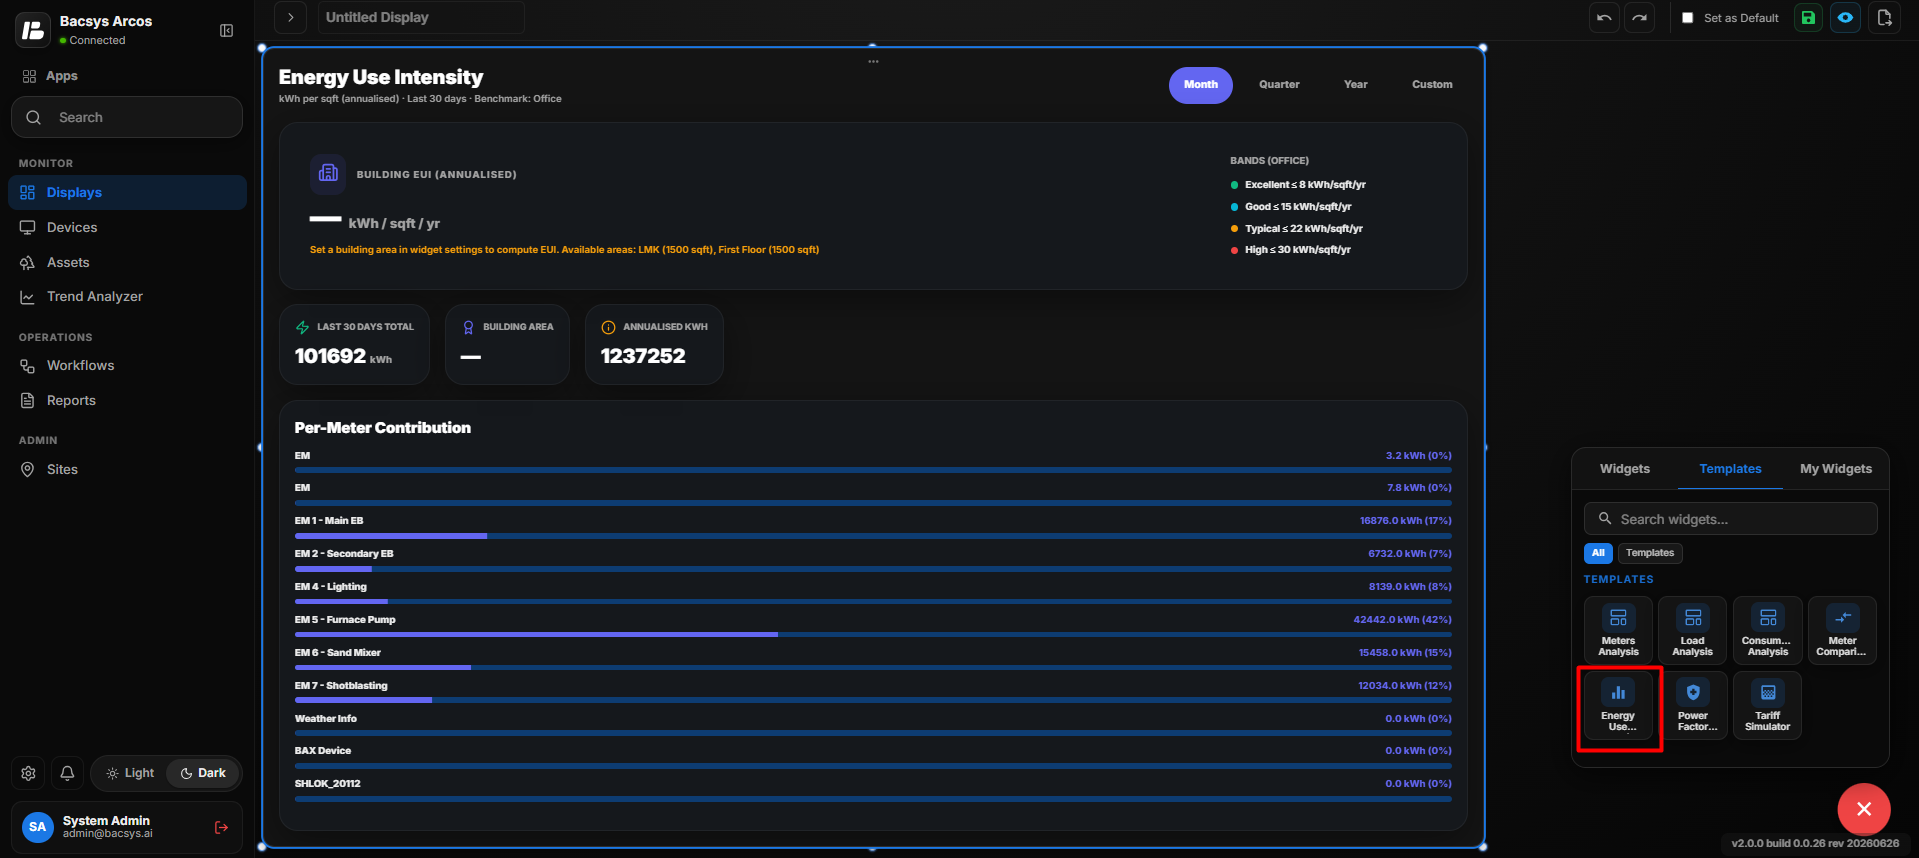 EUI Widget Configuration
EUI Calculation
The EUI value is calculated using the annualised energy consumption and the selected building area:
EUI = Annualised Energy Consumption (kWh) ÷ Building Area
The resulting value is displayed as:
kWh / sqft / yr
The widget compares the calculated EUI against the configured benchmark limits and categorizes the building performance as Excellent, Good, Typical, High, or Critical.
EUI Widget Controls
| Control | Description |
|---|---|
| Month | Displays the EUI analysis for the monthly period. |
| Quarter | Displays the EUI analysis for the quarterly period. |
| Year | Displays the EUI analysis for the yearly period. |
| Custom | Allows a custom analysis period to be selected. |
| Zoom In | Enlarges the widget view. |
| Zoom Out | Reduces the widget view. |
| Settings | Opens the Configure Data panel to modify the EUI configuration. |
| Delete / Remove | Removes the EUI widget from the display. |
After clicking Save, the EUI widget is updated with the selected meters, building area, benchmark settings, analysis period, and other configured properties.
Add and Configure the Power Factor Penalty Widget
The Power Factor Penalty Widget is used to display power factor penalty-related information on the display. It is available under the Templates section and can be added to a display for monitoring and analyzing the configured power factor penalty data.
The widget can be positioned and resized according to the display layout. Users can also open the Settings panel to configure the required Power Factor Penalty properties.
- Click the + icon to open the widget panel.
- Select the Templates tab.
- Drag and drop the Power Factor Penalty widget onto the display.
- Position the widget at the required location.
- Use the Zoom In and Zoom Out controls to adjust the widget view.
- Use the Delete/Remove option to remove the widget when required.
- Select the Power Factor Penalty widget and click Settings to open the Configure Data panel.
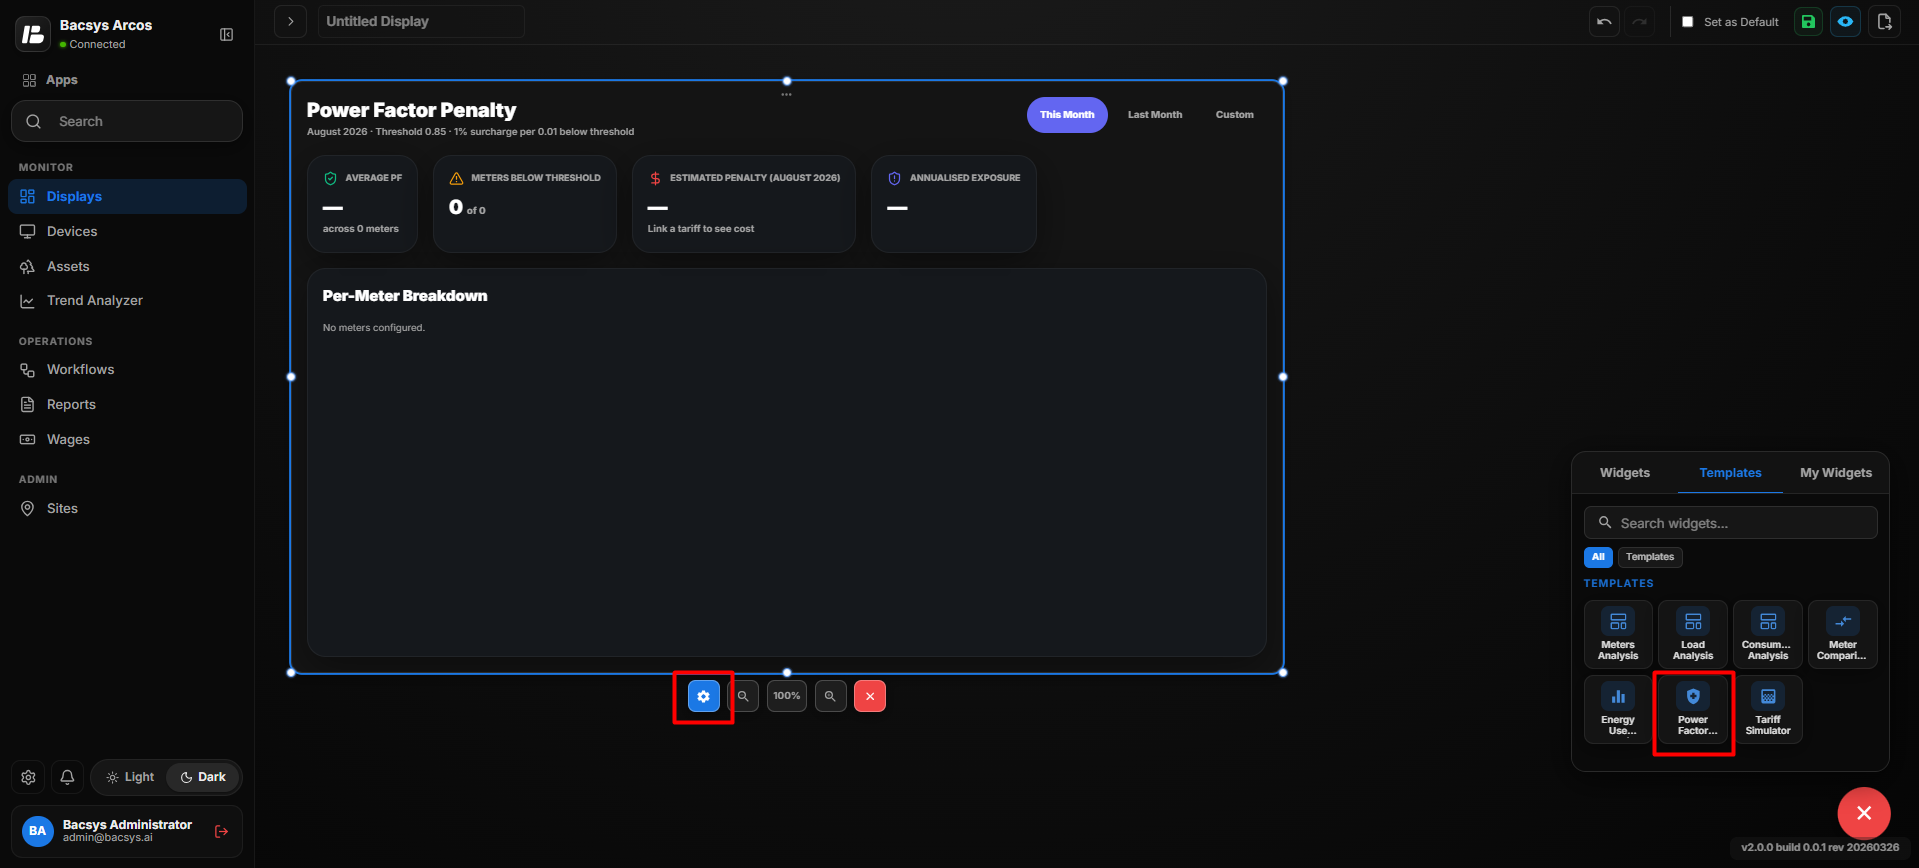 Power Factor Penalty Widget
Power Factor Penalty Configuration
| Setting | Description |
|---|---|
| Title | Defines the title displayed for the Power Factor Penalty widget. |
| Select Visible Meters (Sidebar) | Allows users to search for and select the meters used for power factor penalty analysis. |
| Energy Rate (Tariff) | Selects the tariff used to calculate the estimated penalty cost. |
| CO2 Factor | Selects the CO2 conversion factor used for related calculations. Available options include ELEC-KGCO2 and BTU-KgCO2. |
| Currency Symbol | Selects the currency used to display penalty cost values. |
| Threshold (e.g. 0.85) | Defines the minimum acceptable power factor threshold. Power factor values below this threshold are considered for penalty calculation. |
| % Per 0.01 Below | Defines the percentage surcharge applied for every 0.01 that the power factor falls below the configured threshold. |
| Power Factor | Specifies the exact point name used to retrieve power factor data. |
| Active Energy | Specifies the exact point name used to retrieve active energy data for penalty calculations. |
| Show Background | Displays the widget background when enabled. |
| Hide Header | Hides the widget header when enabled. |
| Save | Saves the configured Power Factor Penalty settings. |
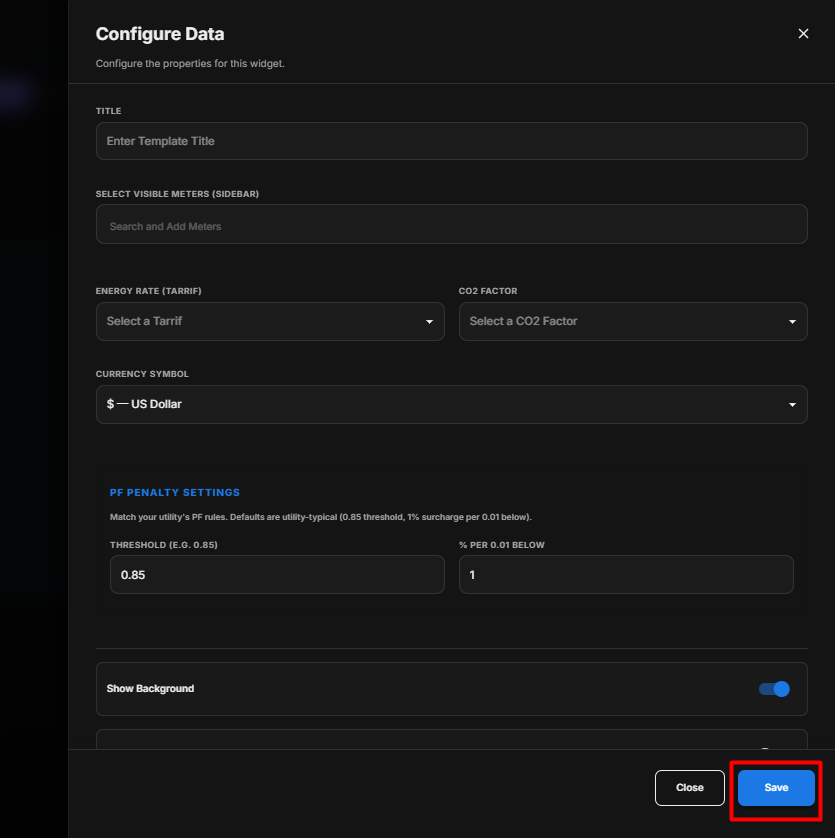 Power Factor Penalty Widget
Configure the Power Factor Penalty Widget
- Enter the required Title.
- Under Select Visible Meters (Sidebar), search for and select the meters that should be included in the analysis.
- Select the required Energy Rate (Tariff).
- Select the required CO2 Factor.
- Select the required Currency Symbol.
- Under PF Penalty Settings, enter the required Threshold value.
- Enter the % Per 0.01 Below value to define the applicable surcharge.
- Under Point Name Mapping, enter the exact Power Factor point name.
- Enter the exact Active Energy point name.
- Enable or disable Show Background as required.
- Enable Hide Header if the widget header should not be displayed.
- Review the configured settings.
- Click Save.
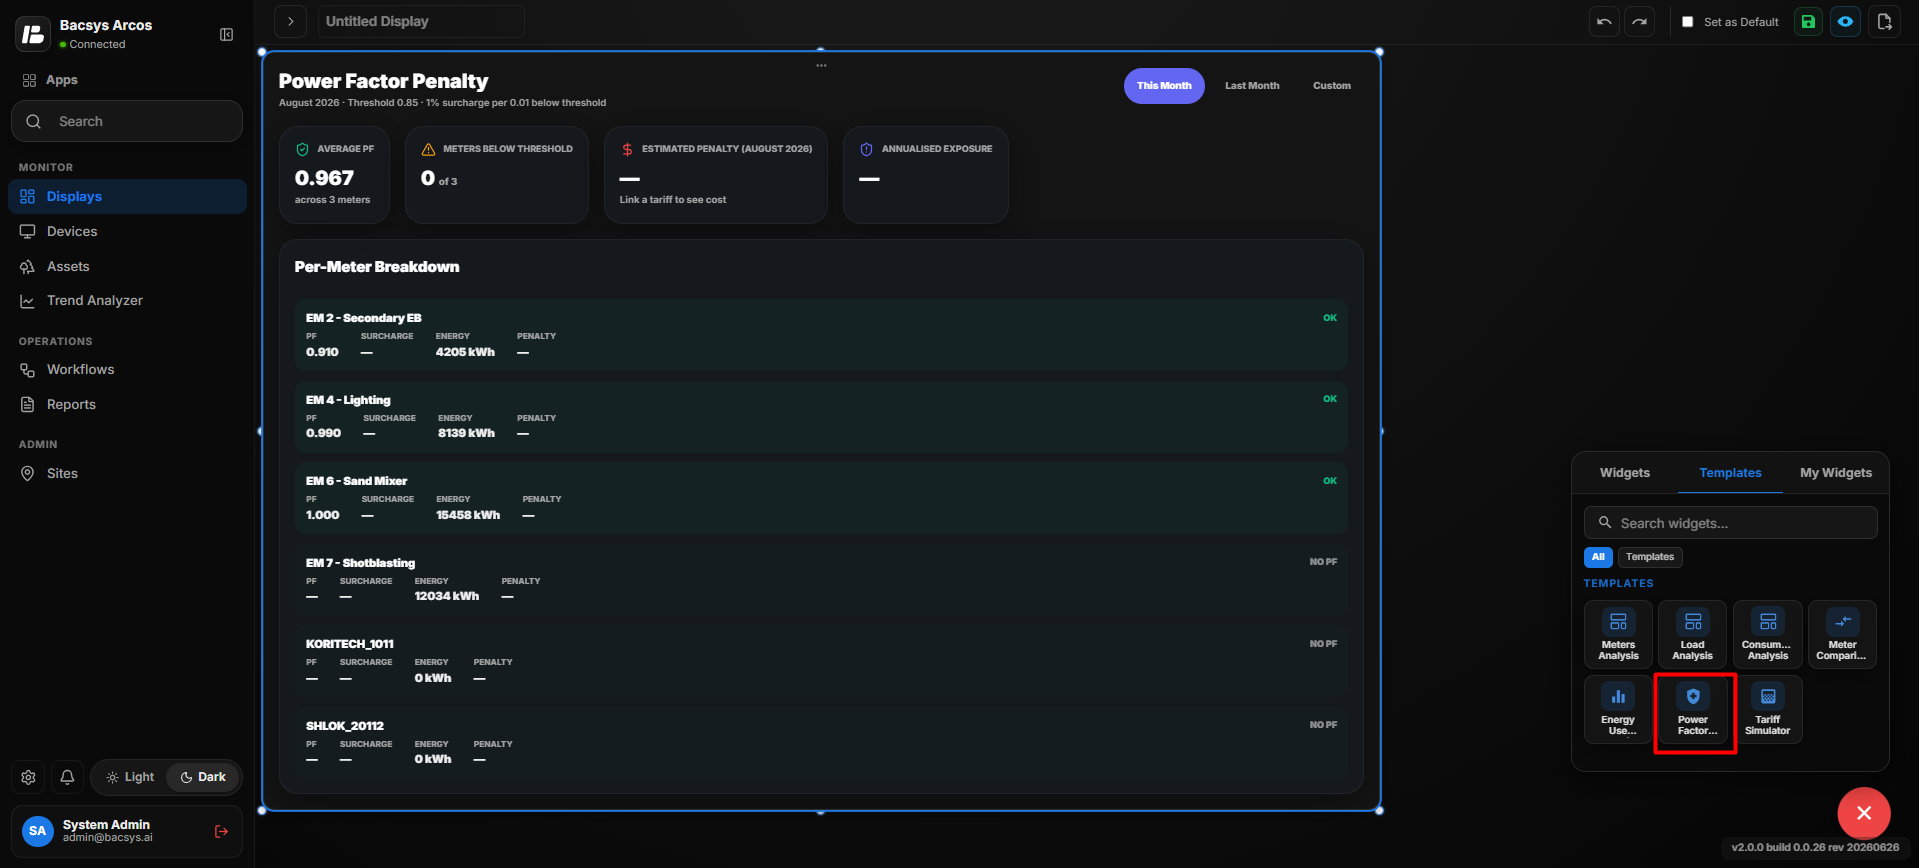 Power Factor Penalty Widget
Power Factor Penalty Calculation
The widget evaluates the selected meters against the configured power factor threshold.
For example, if the Threshold is 0.85 and the power factor is 0.80, the value is 0.05 below the threshold. If the surcharge is 1% per 0.01 below, the applicable surcharge is calculated based on the difference below 0.85.
Power Factor Penalty Widget Controls
| Control | Description |
|---|---|
| This Month | Displays the power factor penalty analysis for the current month. |
| Last Month | Displays the power factor penalty analysis for the previous month. |
| Custom | Allows a custom analysis period to be selected. |
| Zoom In | Enlarges the widget view. |
| Zoom Out | Reduces the widget view. |
| Settings | Opens the Configure Data panel to modify the widget configuration. |
| Delete / Remove | Removes the Power Factor Penalty widget from the display. |
After clicking Save, the Power Factor Penalty widget is updated with the selected meters, tariff, threshold, surcharge settings, point mappings, and other configured properties.
Add and Configure the Tariff Simulator Widget
The Tariff Simulator Widget is used to simulate and visualize tariff-related information on the display. It is available under the Templates section and can be added to a display for analyzing tariff scenarios based on the configured settings.
The widget can be positioned and resized according to the display layout. Users can also open the Settings panel to configure the required Tariff Simulator properties.
- Click the + icon to open the widget panel.
- Select the Templates tab.
- Drag and drop the Tariff Simulator widget onto the display.
- Position the Tariff Simulator at the required location.
- Use the Zoom In and Zoom Out controls to adjust the widget view.
- Use the Remove/Delete option to remove the widget when required.
- Select the Tariff Simulator widget and click Settings to open the Configure Data panel.
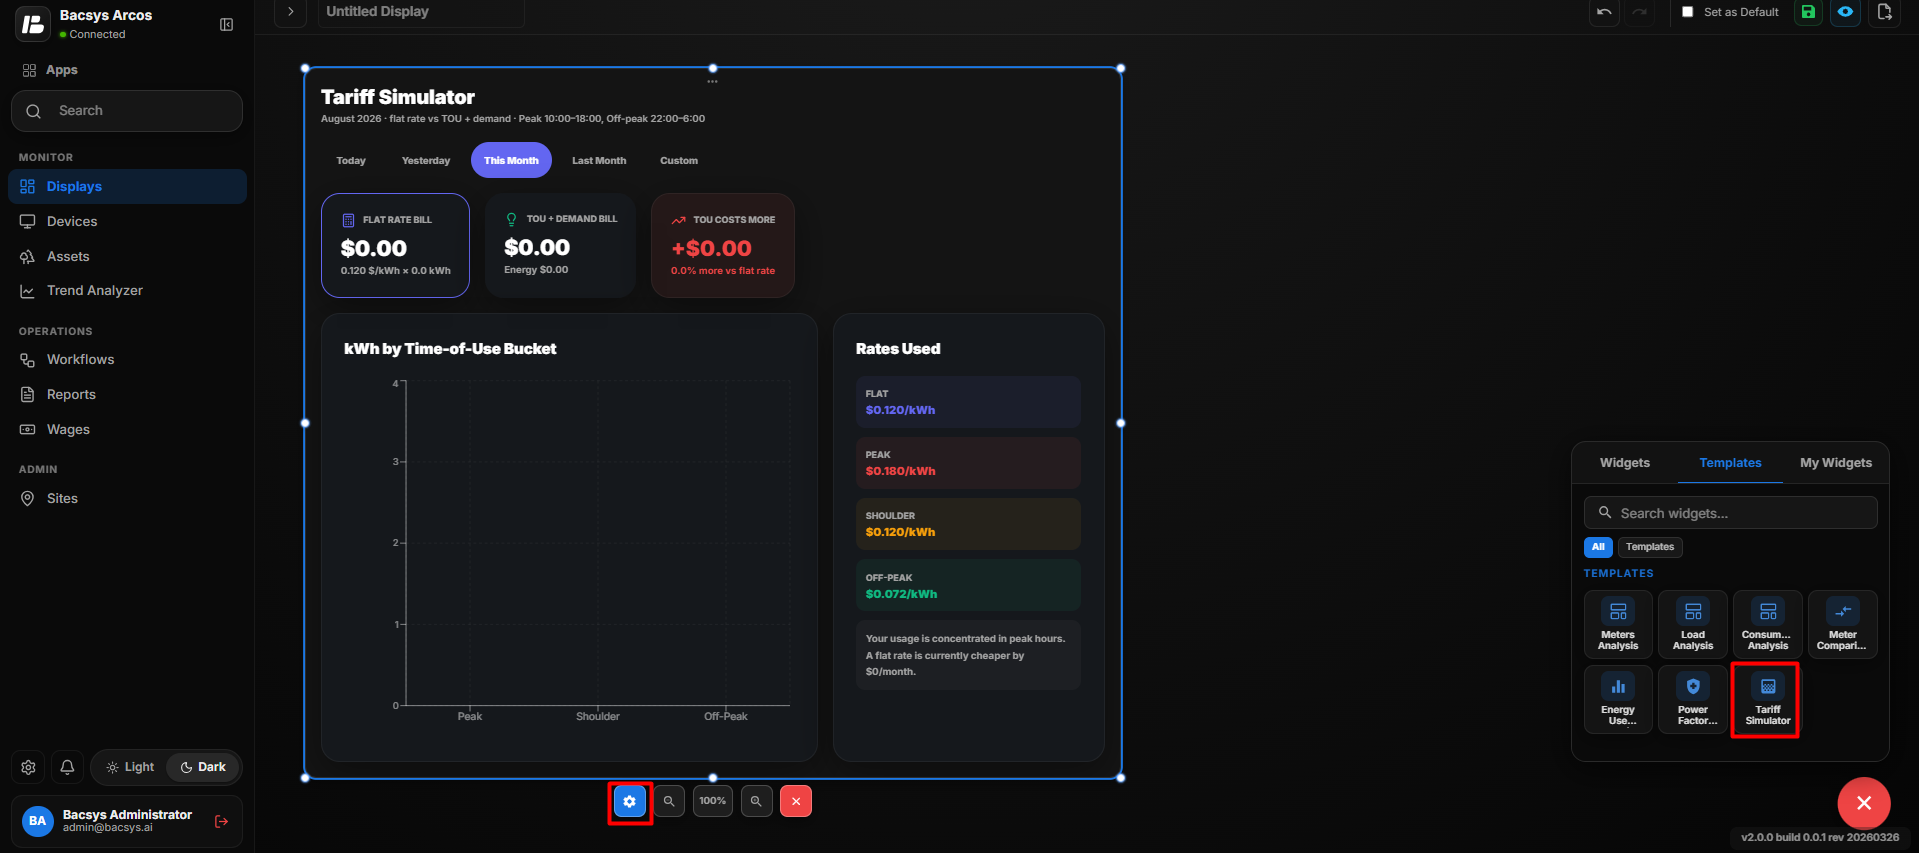 Tariff Simulator Widget
Tariff Simulator Configuration
| Setting | Description |
|---|---|
| Title | Defines the title displayed for the Tariff Simulator widget. |
| Select Visible Meters (Sidebar) | Allows users to search and select the meters to be included in the tariff simulation. |
| Energy Rate (Tariff) | Selects the tariff used to calculate the energy cost. |
| CO2 Factor | Selects the CO2 conversion factor used for the calculation. Available options include ELEC-KGCO2 and BTU-KgCO2. |
| Currency Symbol | Selects the currency used to display tariff and cost values. |
| Peak Rate ($/kWh) | Defines the rate applied during the peak period. |
| Shoulder Rate ($/kWh) | Defines the rate applied during the shoulder period. |
| Off-Peak Rate ($/kWh) | Defines the rate applied during the off-peak period. |
| Demand Charge ($/kW) | Defines the demand charge applied based on demand usage. |
| Show Background | Displays the widget background when enabled. |
| Hide Header | Hides the widget header when enabled. |
| Save | Saves the configured Tariff Simulator settings. |
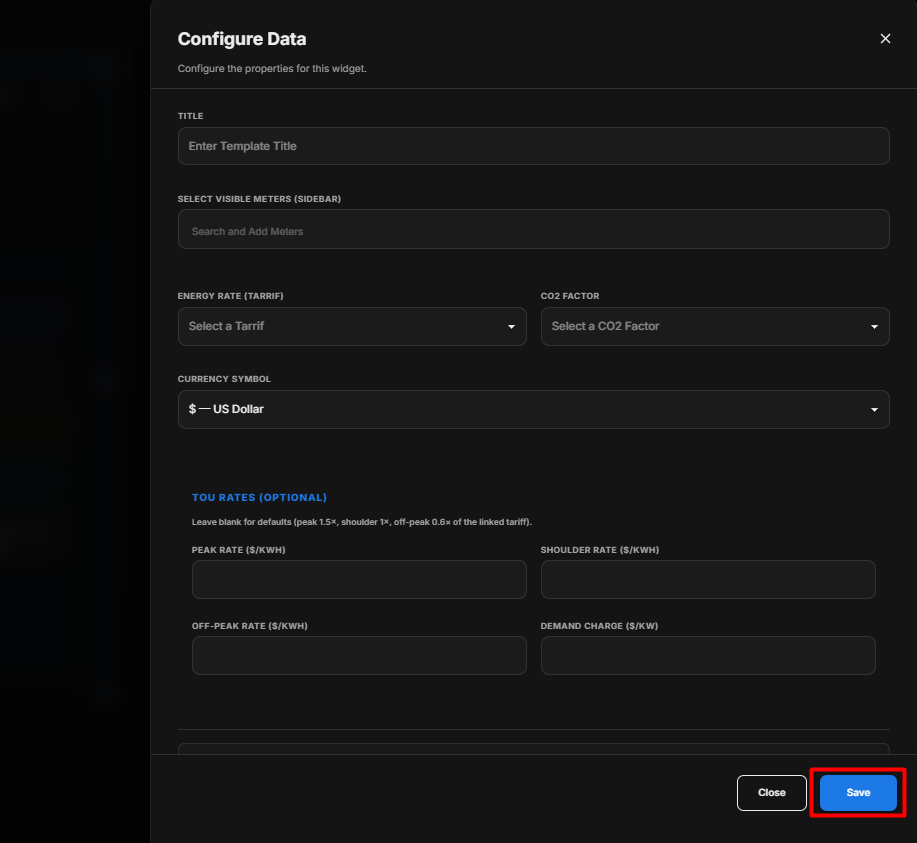 Tariff Simulator Widget
How to Configure
- Enter the required Title.
- Under Select Visible Meters (Sidebar), search for and select the required meters.
- Select the required Energy Rate (Tariff).
- Select the required CO2 Factor.
- Select the required Currency Symbol.
- Under TOU Rates (Optional), enter the required:
- Peak Rate
- Shoulder Rate
- Off-Peak Rate
- Demand Charge
- Leave the TOU rate fields blank if the default rates from the selected tariff should be used.
- Enable or disable Show Background as required.
- Enable Hide Header if the widget header should not be displayed.
- Review the configured settings.
- Click Save.
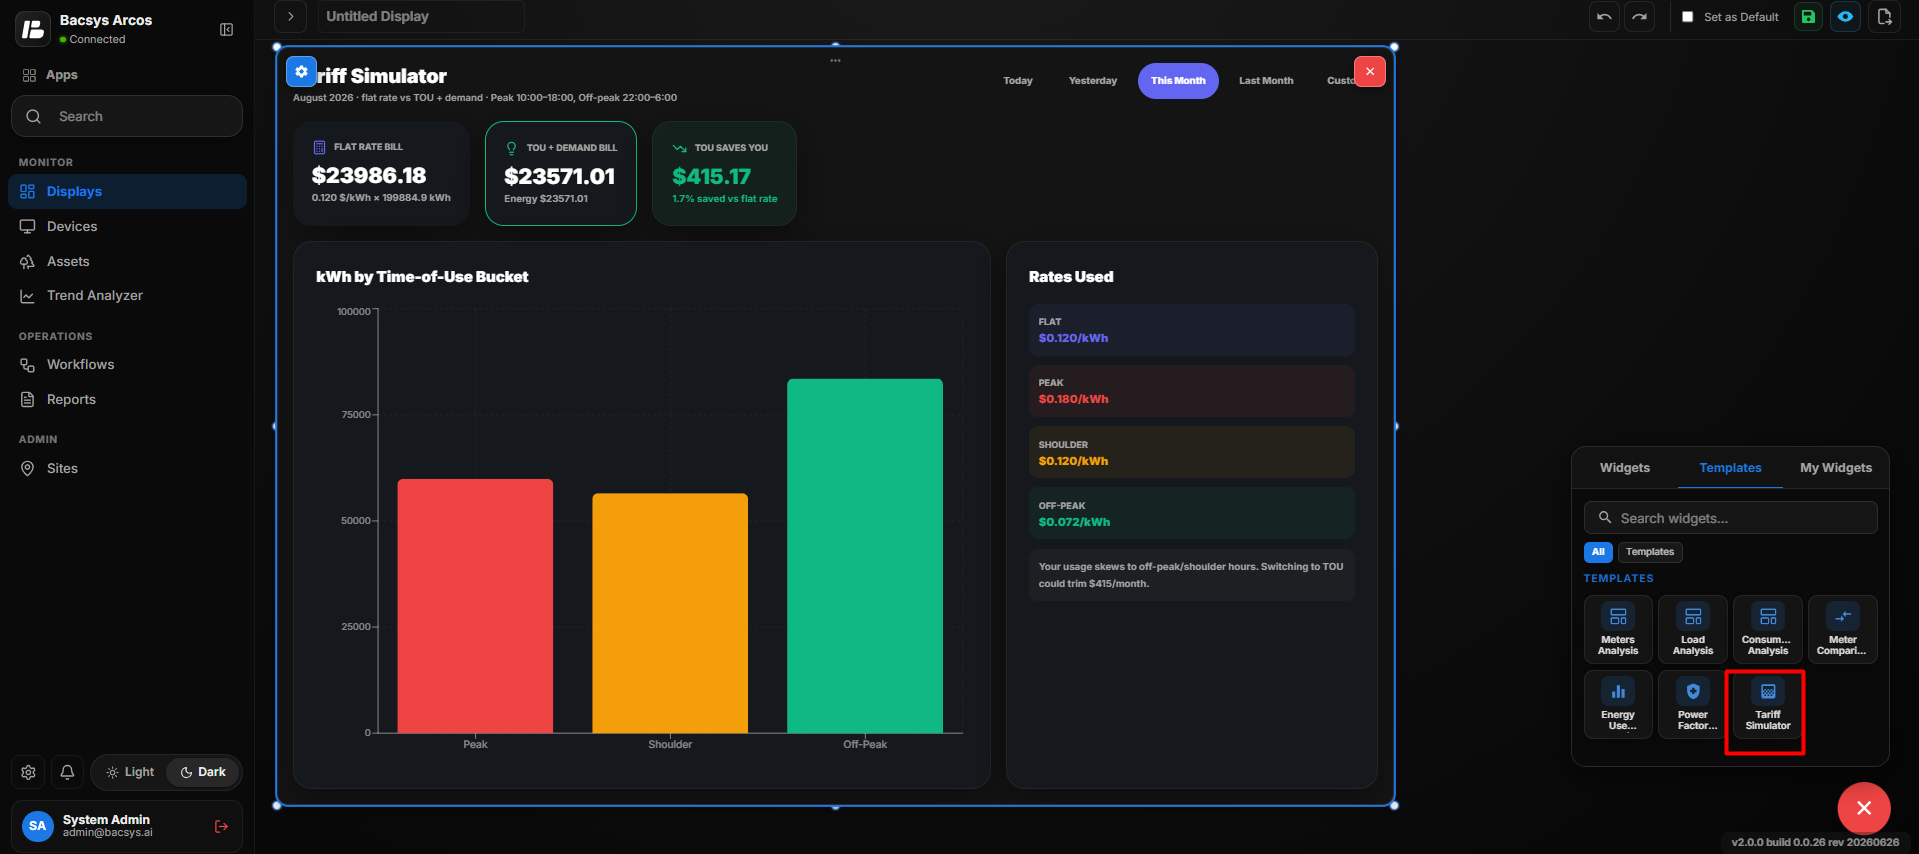 Tariff Simulator Widget
- The configured Tariff Simulator widget is updated on the display.
Tariff Simulator Controls
| Control | Description |
|---|---|
| Today | Displays tariff simulation results for the current day. |
| Yesterday | Displays results for the previous day. |
| This Month | Displays results for the current month. |
| Last Month | Displays results for the previous month. |
| Custom | Allows a custom analysis period to be selected. |
| Zoom In | Enlarges the widget view. |
| Zoom Out | Reduces the widget view. |
| Settings | Opens the Configure Data panel to modify the widget configuration. |
| Remove/Delete | Removes the Tariff Simulator widget from the display. |
Add New Display
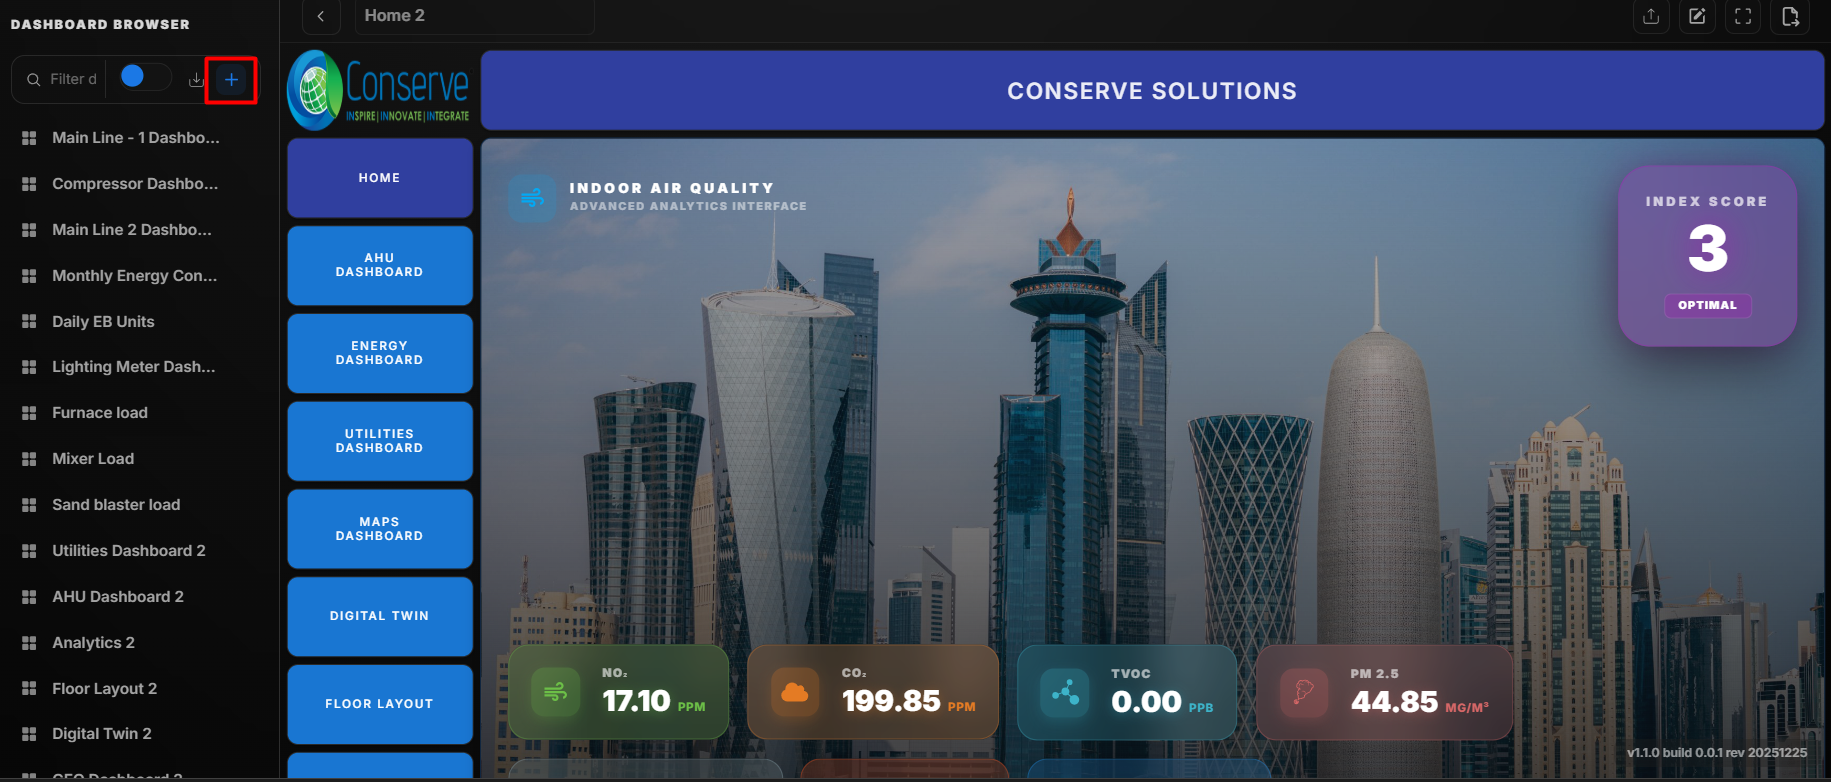 Add New Display
The + (Add) Button allows users to create a new display.
When the + button is clicked:
- A new display configuration page is opened.
- Users can enter the display name and configure the layout.
- Widgets can be added and customized as required.
- The display can be saved and accessed later from the display list.
Export Display
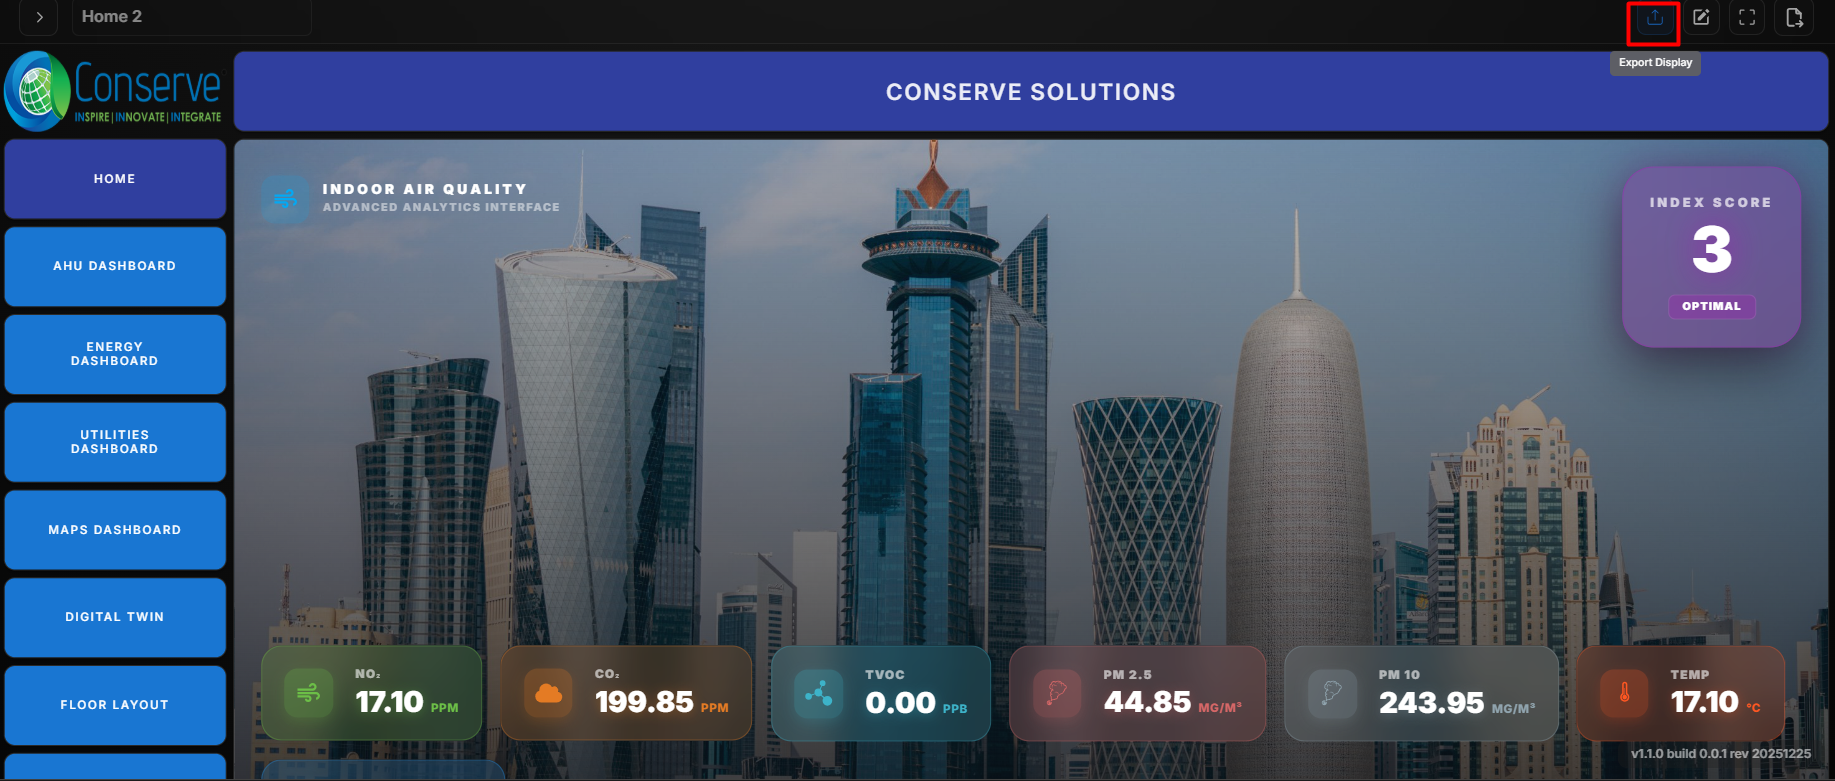 Export Display
The Export Display option allows users to export the configured display layout.
When the Export Display button is clicked, the selected display configuration, including widgets, layout settings, and associated data points, will be exported for backup.
Edit Mode
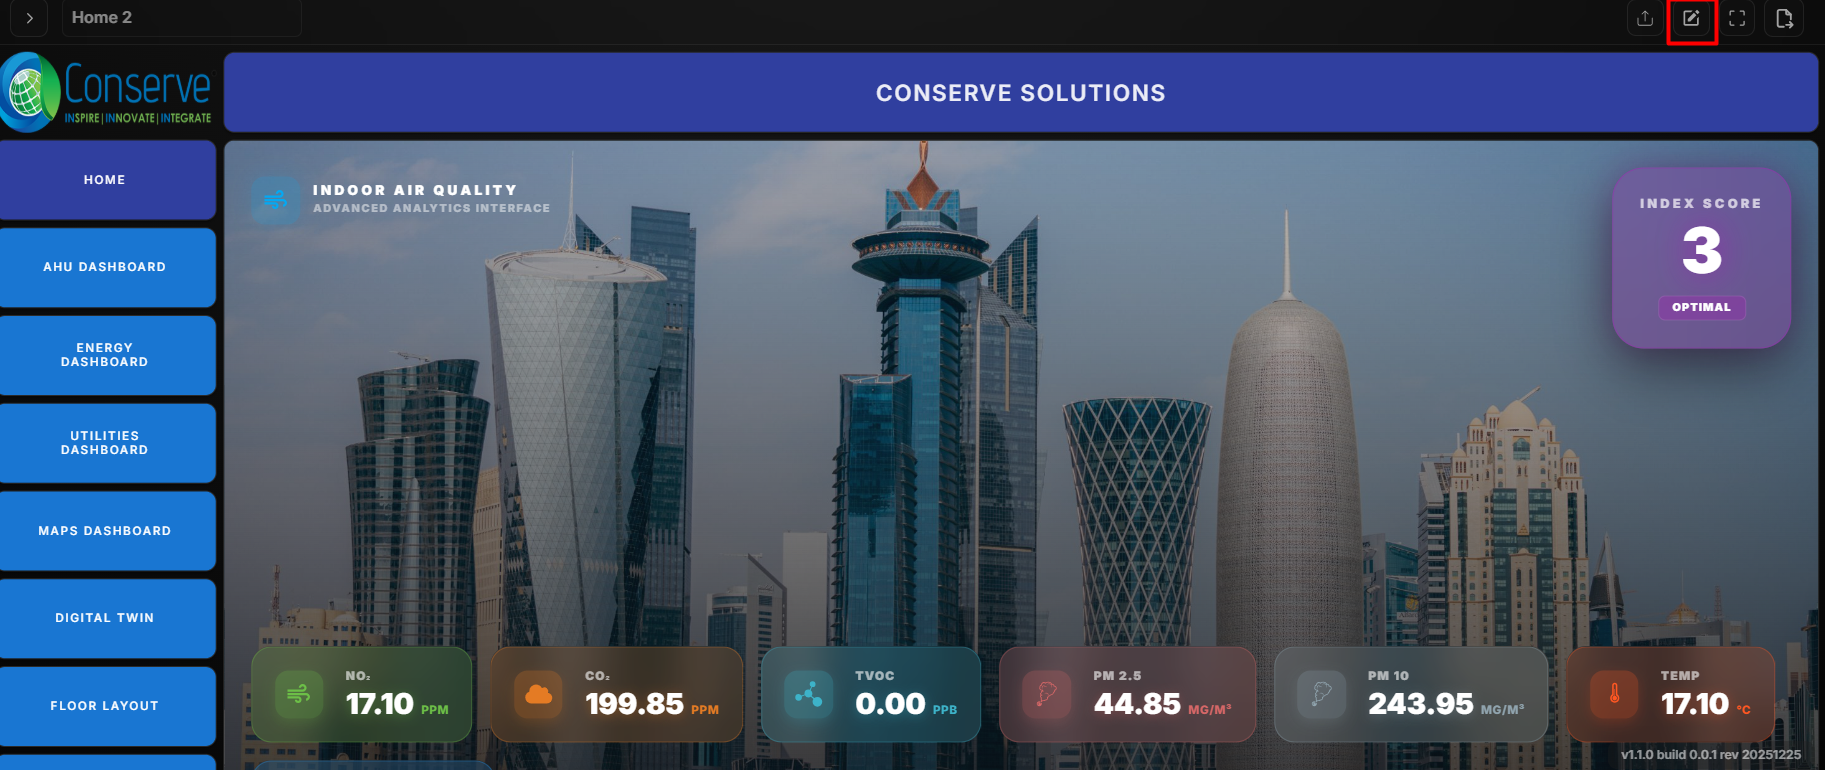 Edit Mode
The Edit Mode option allows users to modify the existing display configuration.
When the Edit button is clicked, edit mode is enabled, allowing users to:
- Add new widgets
- Modify existing widget settings
- Resize and reposition widgets
- Delete widgets from the layout
Changes can be saved after editing to update the display configuration.
Set as Default
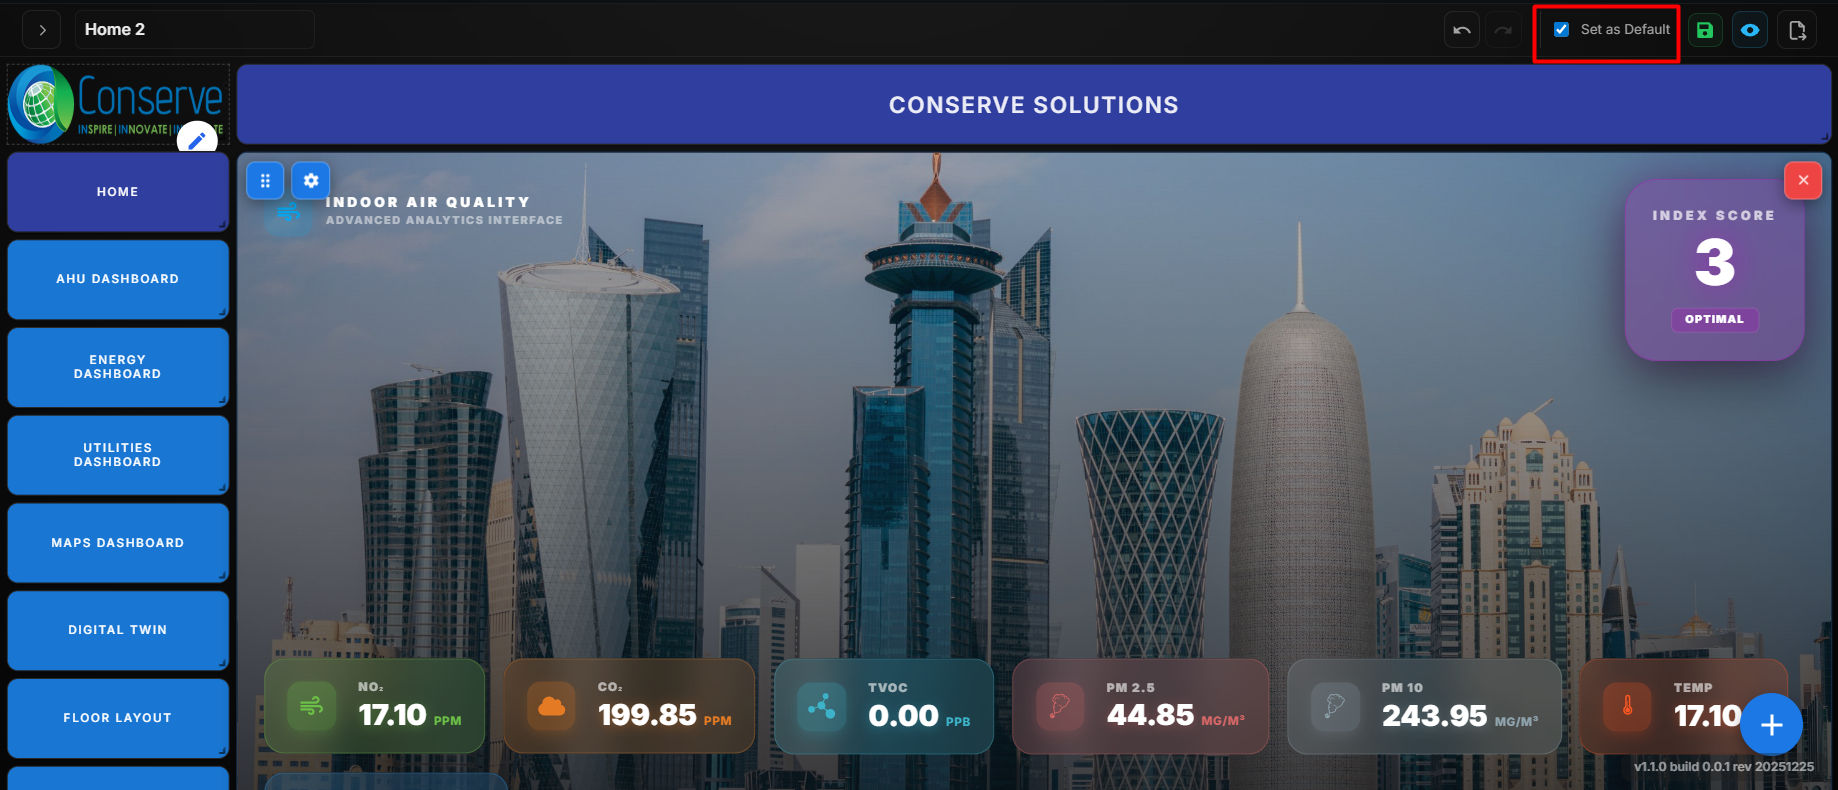 Set as Default
The Set as Default option allows users to mark a selected display as the default display.
When the Set as Default option is clicked:
- The selected display is marked as the default configuration.
- This display will automatically load when the user accesses the module.
- Only one display can be set as default at a time.
- If another display is set as default later, it will replace the previous default display.
Save Changes
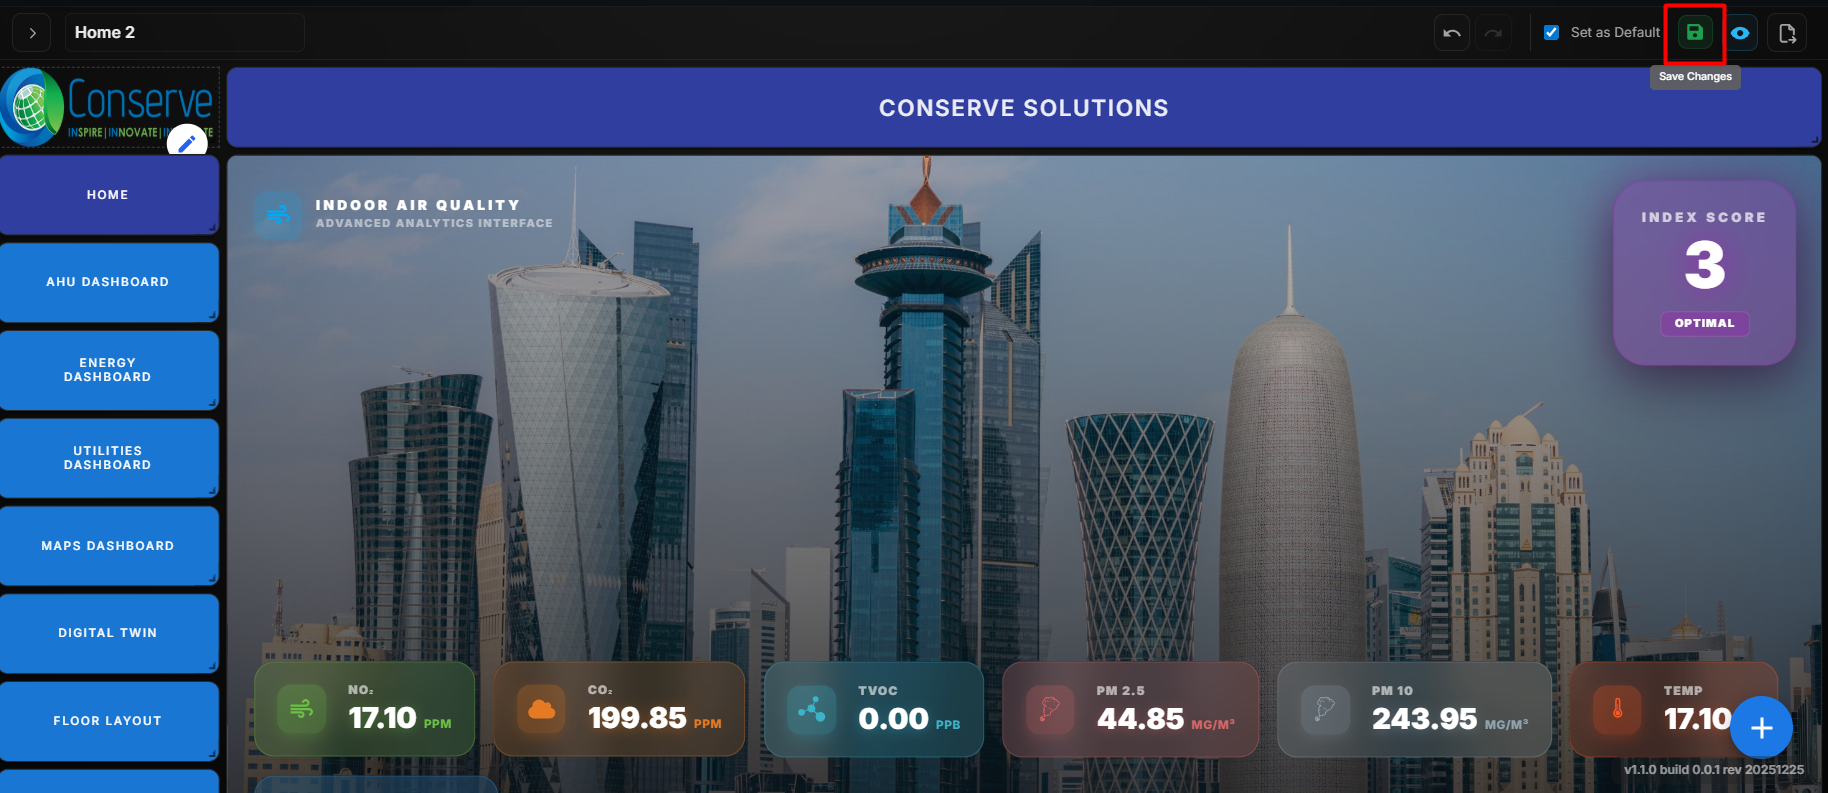 Save Changes
The Save Changes option allows users to store the modifications made to a display.
When the Save Changes button is clicked:
- All newly added widgets are saved.
- Any modifications to existing widgets are updated.
- Layout changes, including resizing and repositioning, are stored.
- The display configuration is updated with the latest changes.
Once saved, the updated display will be available for future access.
Exit Edit Mode
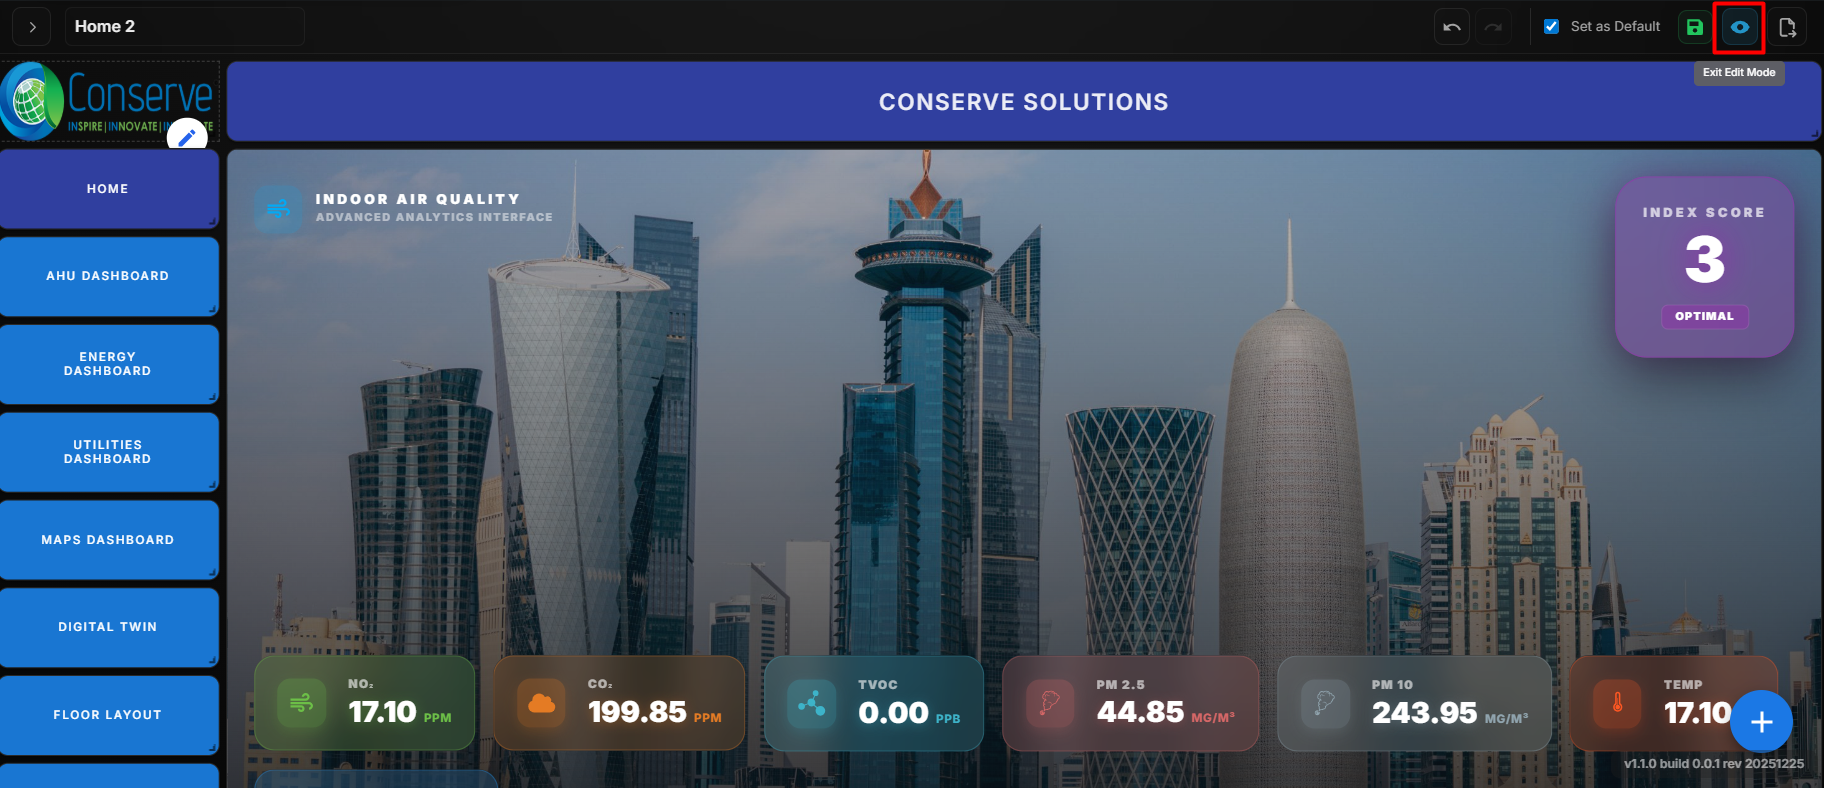 Exit Edit Mode
The Exit Edit Mode option allows users to leave the editing interface and return to view mode.
When the Exit Edit Mode button is clicked:
- The editing tools and configuration options are disabled.
- The display switches back to standard viewing mode.
- No further changes can be made unless Edit Mode is enabled again.
If changes were not saved before exiting, they may be discarded depending on system settings.
Full Screen Mode
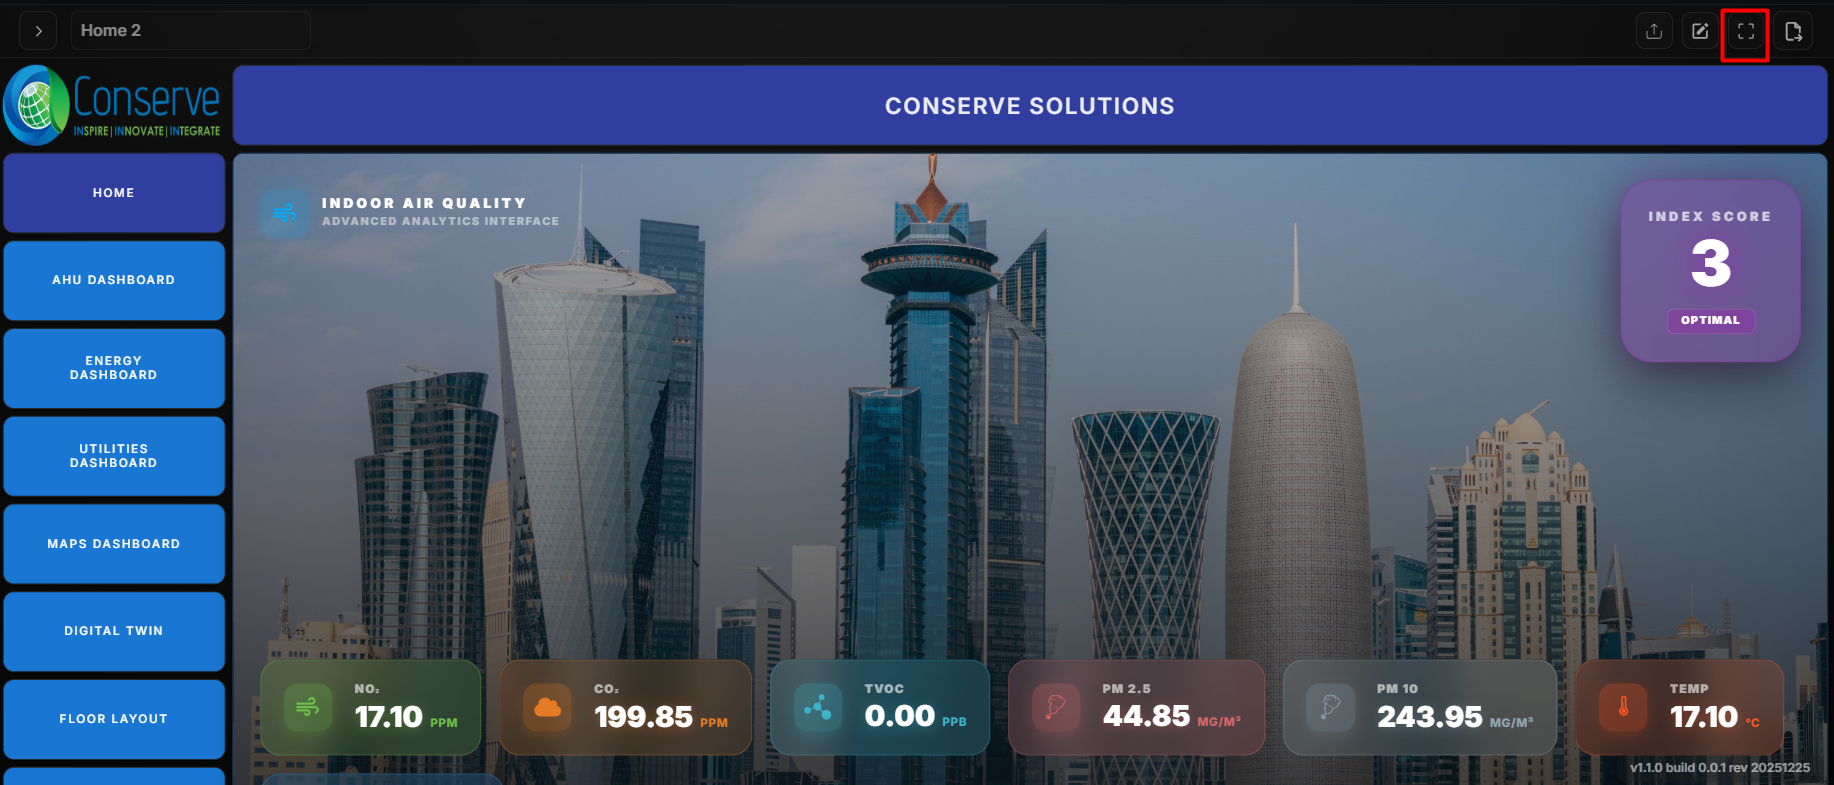 Full Screen Mode
The Full Screen option allows users to view the display in full-screen mode.
When the Full Screen button is clicked, the display expands to occupy the entire screen, providing a larger and clearer view of all widgets and visual elements.
To exit full-screen mode, users can press the Esc key or click the exit full-screen option.
Export – Save As Option
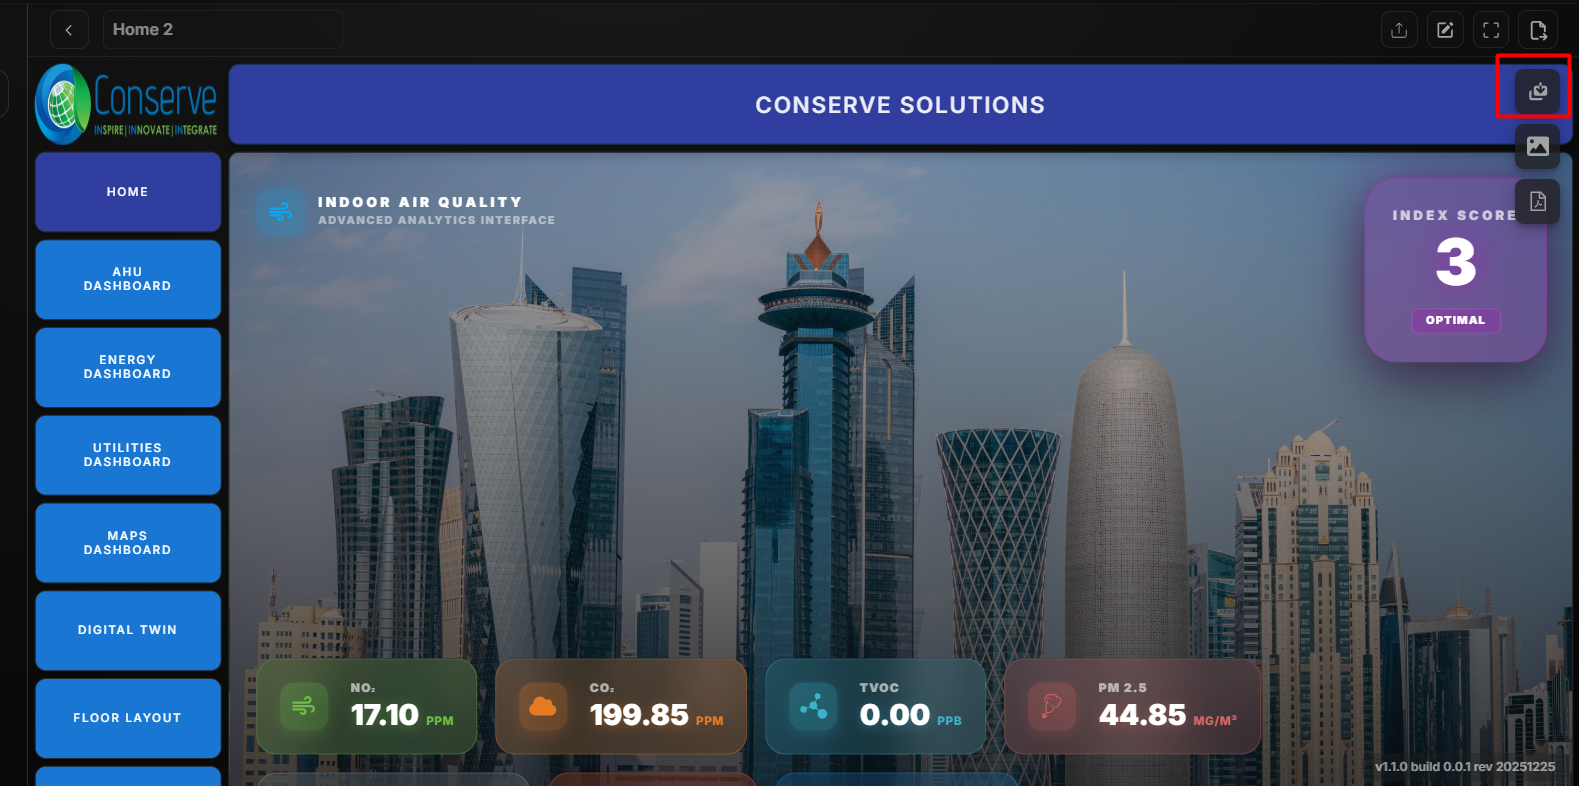 Save AS
The Save As option allows users to save the current display configuration with a new name.
When the Save As option is clicked:
- A prompt will appear to enter a new display name.
- After entering the desired name and confirming, the system saves the display as a new configuration.
- The original display remains unchanged.
- The newly saved display will be available in the display list for future access and editing.
Export as Image
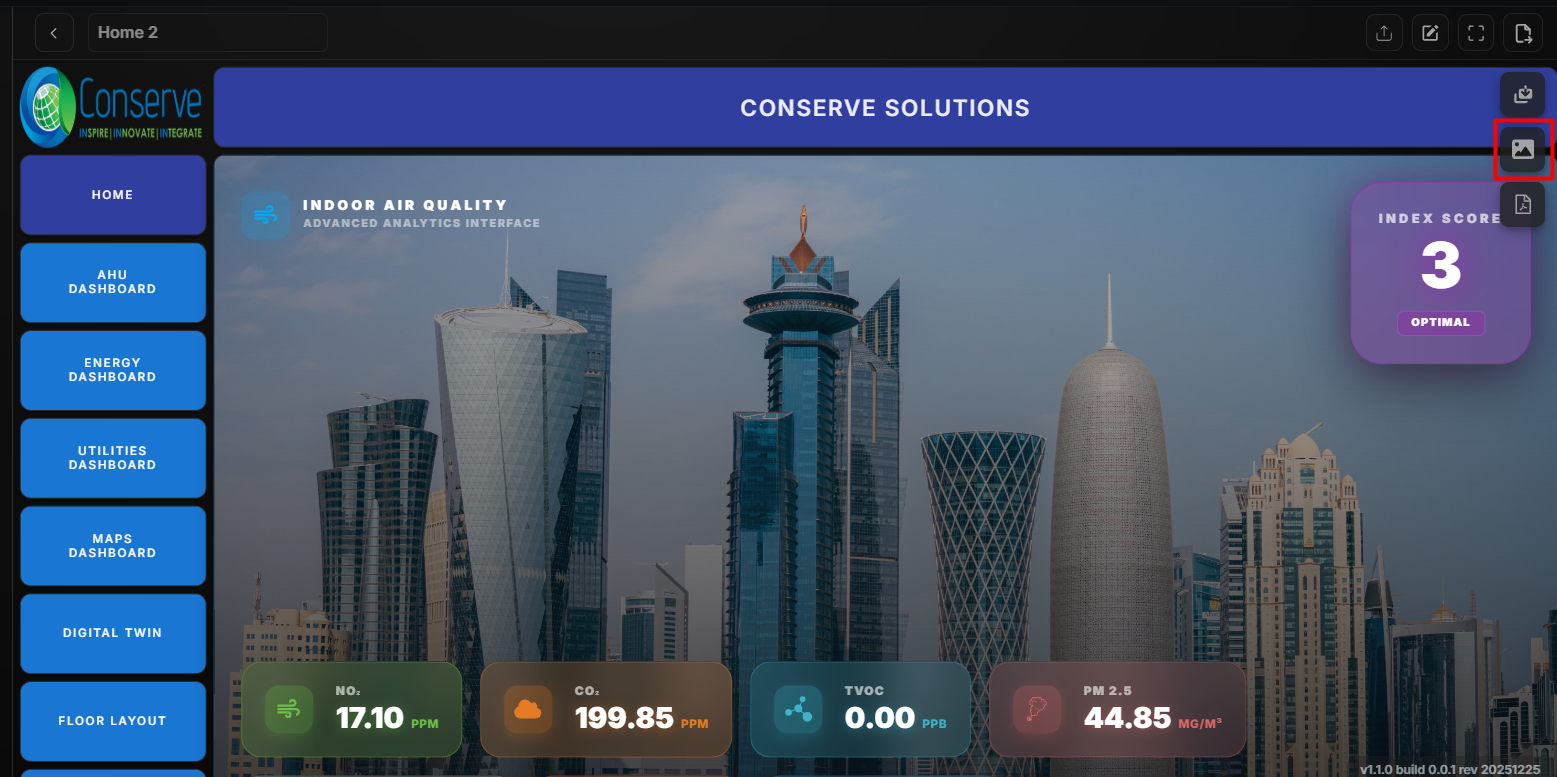 Export as Image
The Export as Image option allows users to save the current display as an image file.
When the Export as Image option is clicked:
- The system captures the current display layout, including all widgets and visual elements.
- The display is saved as an image file (e.g., PNG or JPEG format).
- The image can be downloaded and used for reporting, sharing, or documentation purposes.
Export as PDF
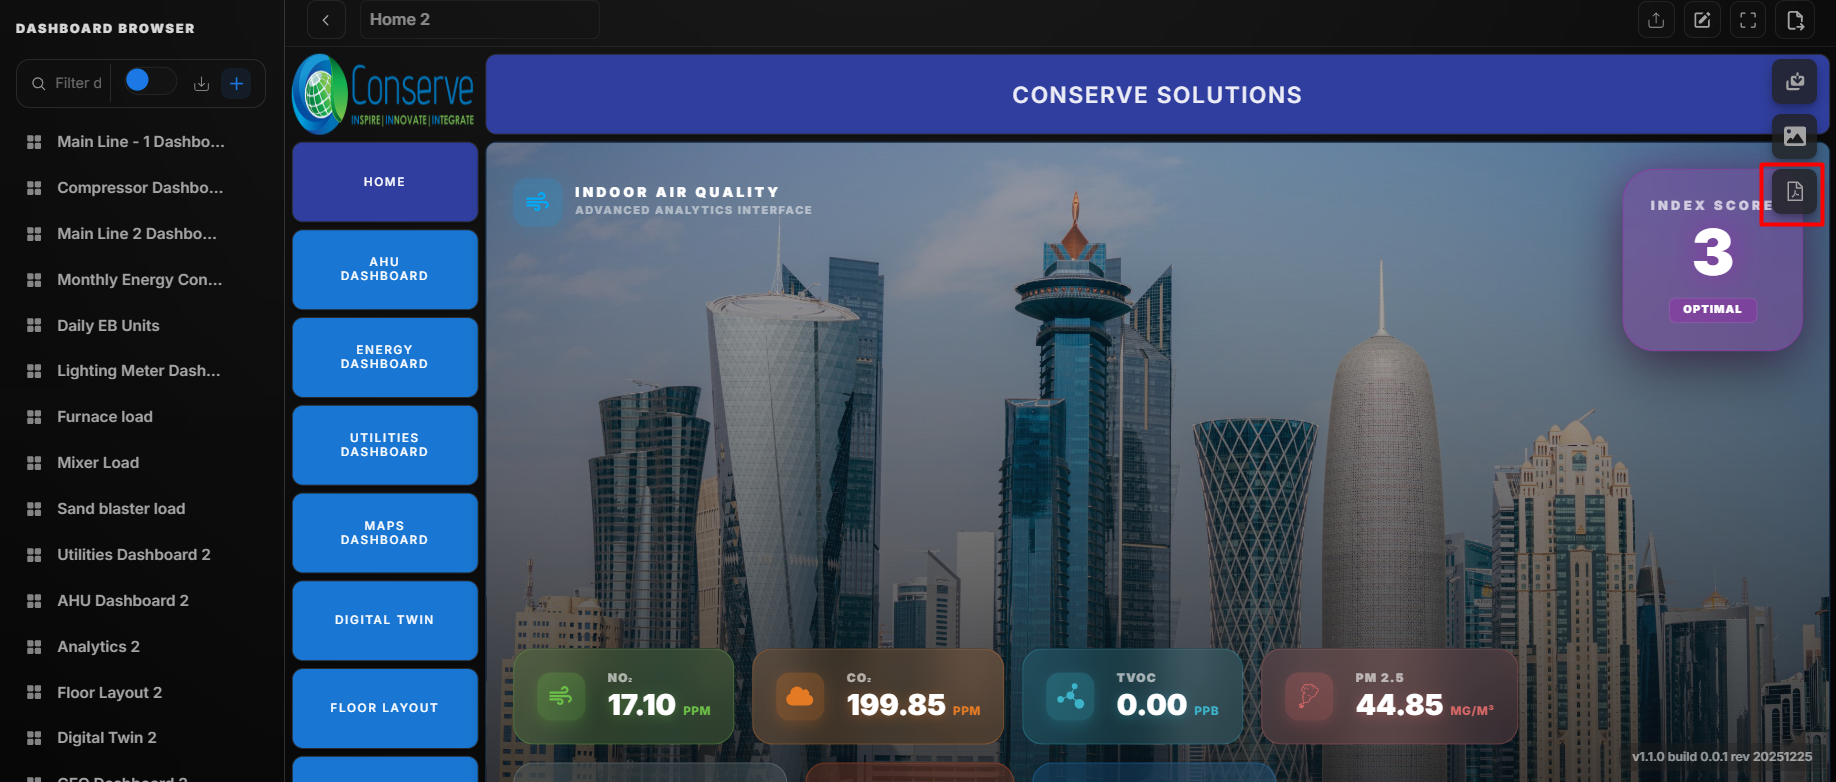 Export as PDF
The Export as PDF option allows users to save the current display as a PDF document.
When the Export as PDF option is clicked:
- The system generates a PDF version of the current display layout.
- All visible widgets, charts, and visual elements are included in the document.
- The PDF file is automatically downloaded for reporting, sharing, or record-keeping purposes.
Import Display
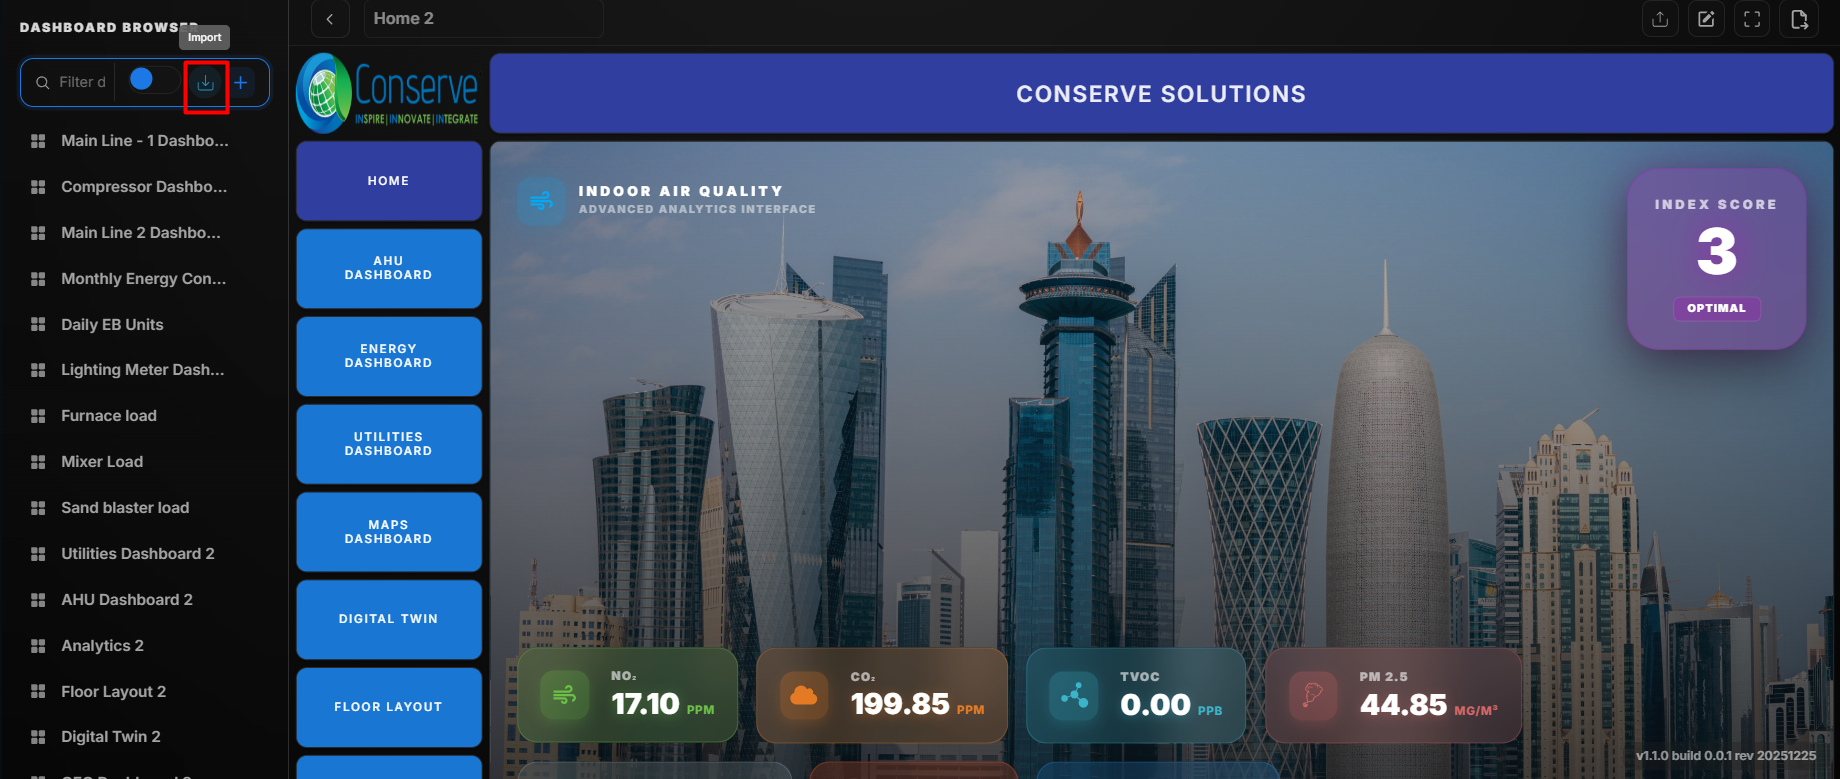 Import Display
The Import option allows users to upload and apply an existing display configuration to the system.
When the Import button is clicked:
- Users can select a previously exported display file.
- The system uploads and validates the file.
- Once successfully imported, the display