Configuring Trends
Point Configuration Trends:
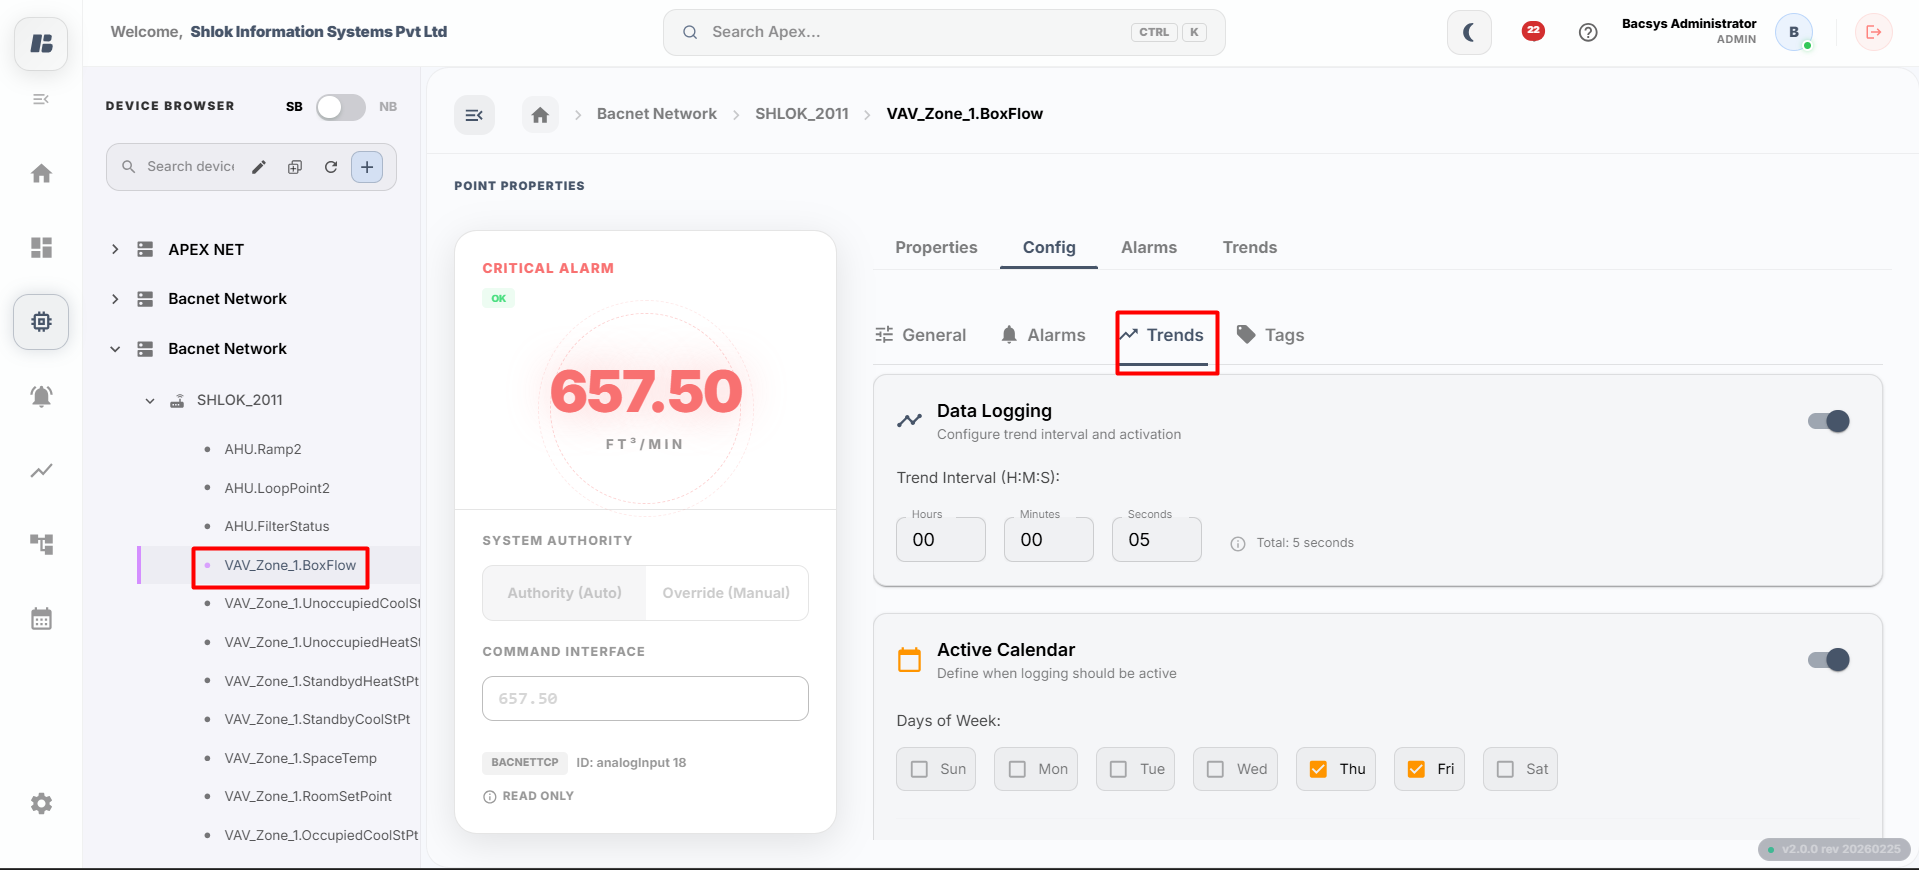
| Field | Description |
|---|---|
| Trend Enable | Tick the checkbox to enable the trend. Untick the checkbox to disable the trend. |
| Trend Interval | Enter the time interval at which the trend values should be recorded. |
| Record Count | Enter the number of trend values to be recorded (Maximum: 500). |
| Enable Trend Active Calendar | Tick the checkbox to enable the calendar. Untick the checkbox to disable the calendar. |
| Day of Week | Tick the day(s) for which the trend values should be recorded. |
| Time Range | Enter the start time and end time between which the trend values should be recorded. |
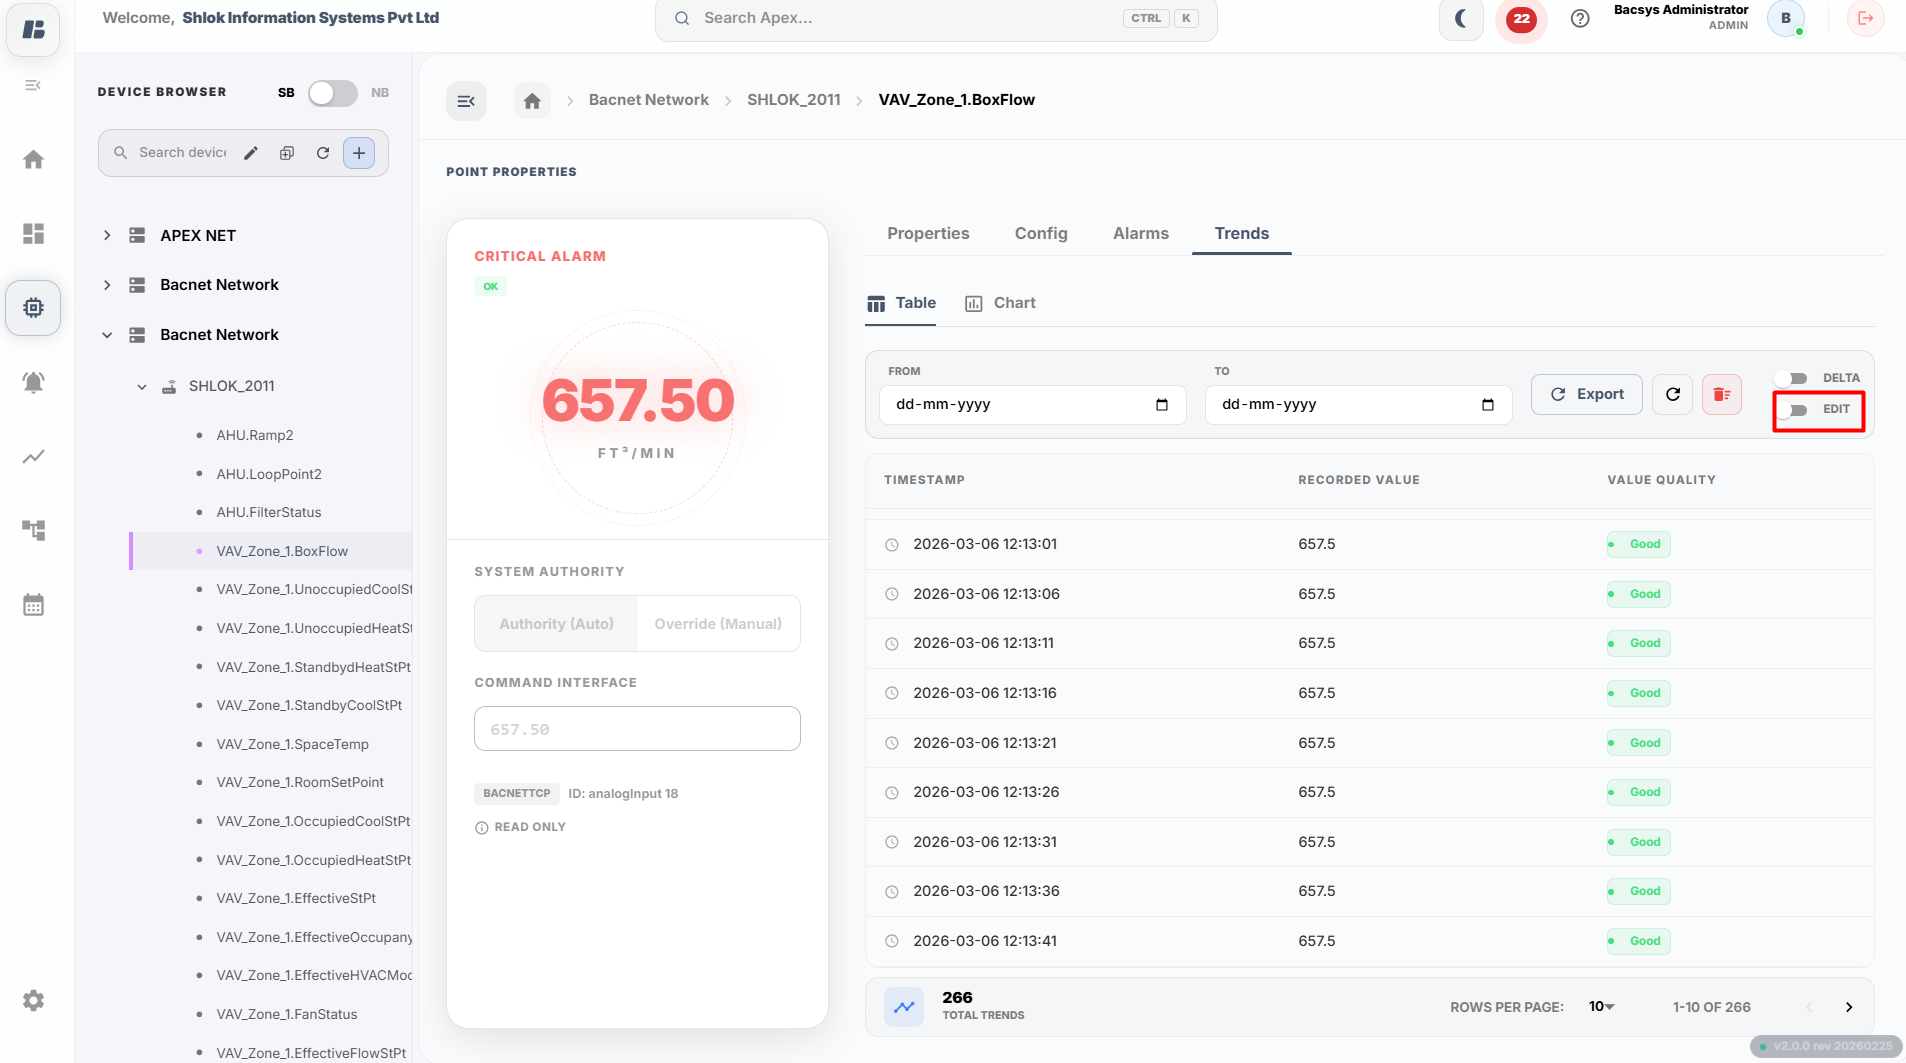
Configuring Trends
-
Navigate to the Devices Module
- Select the point you want to configure.
-
Inside the config tab, go to the Trends tab.
-
Check the Trend Enable checkbox to activate trend logging for this point.
-
Specify the Trend Interval, which determines how frequently the point value is sampled.
- Example: Enter 5 seconds to record data every 5 seconds.
-
Enter the Record Count, which is the maximum number of trend records to store in the controller.
- Maximum allowed is 500.
- Example: Enter 500 to store up to 500 records.
-
If you want trends to be recorded only on certain days and times:
- Check Enable Trend Active Calendar.
- Select the days of the week on which trends should be recorded.
- Set the time range during which the trend should be active.
-
Click the Save button to apply and store the trend settings.
Viewing Saved Trends
-
After configuring and saving the trends, the trend settings will be stored for the selected point.
-
Next to the Config panel, you will see a Trends tab for the point. Click on the Trends tab to access the recorded trends.
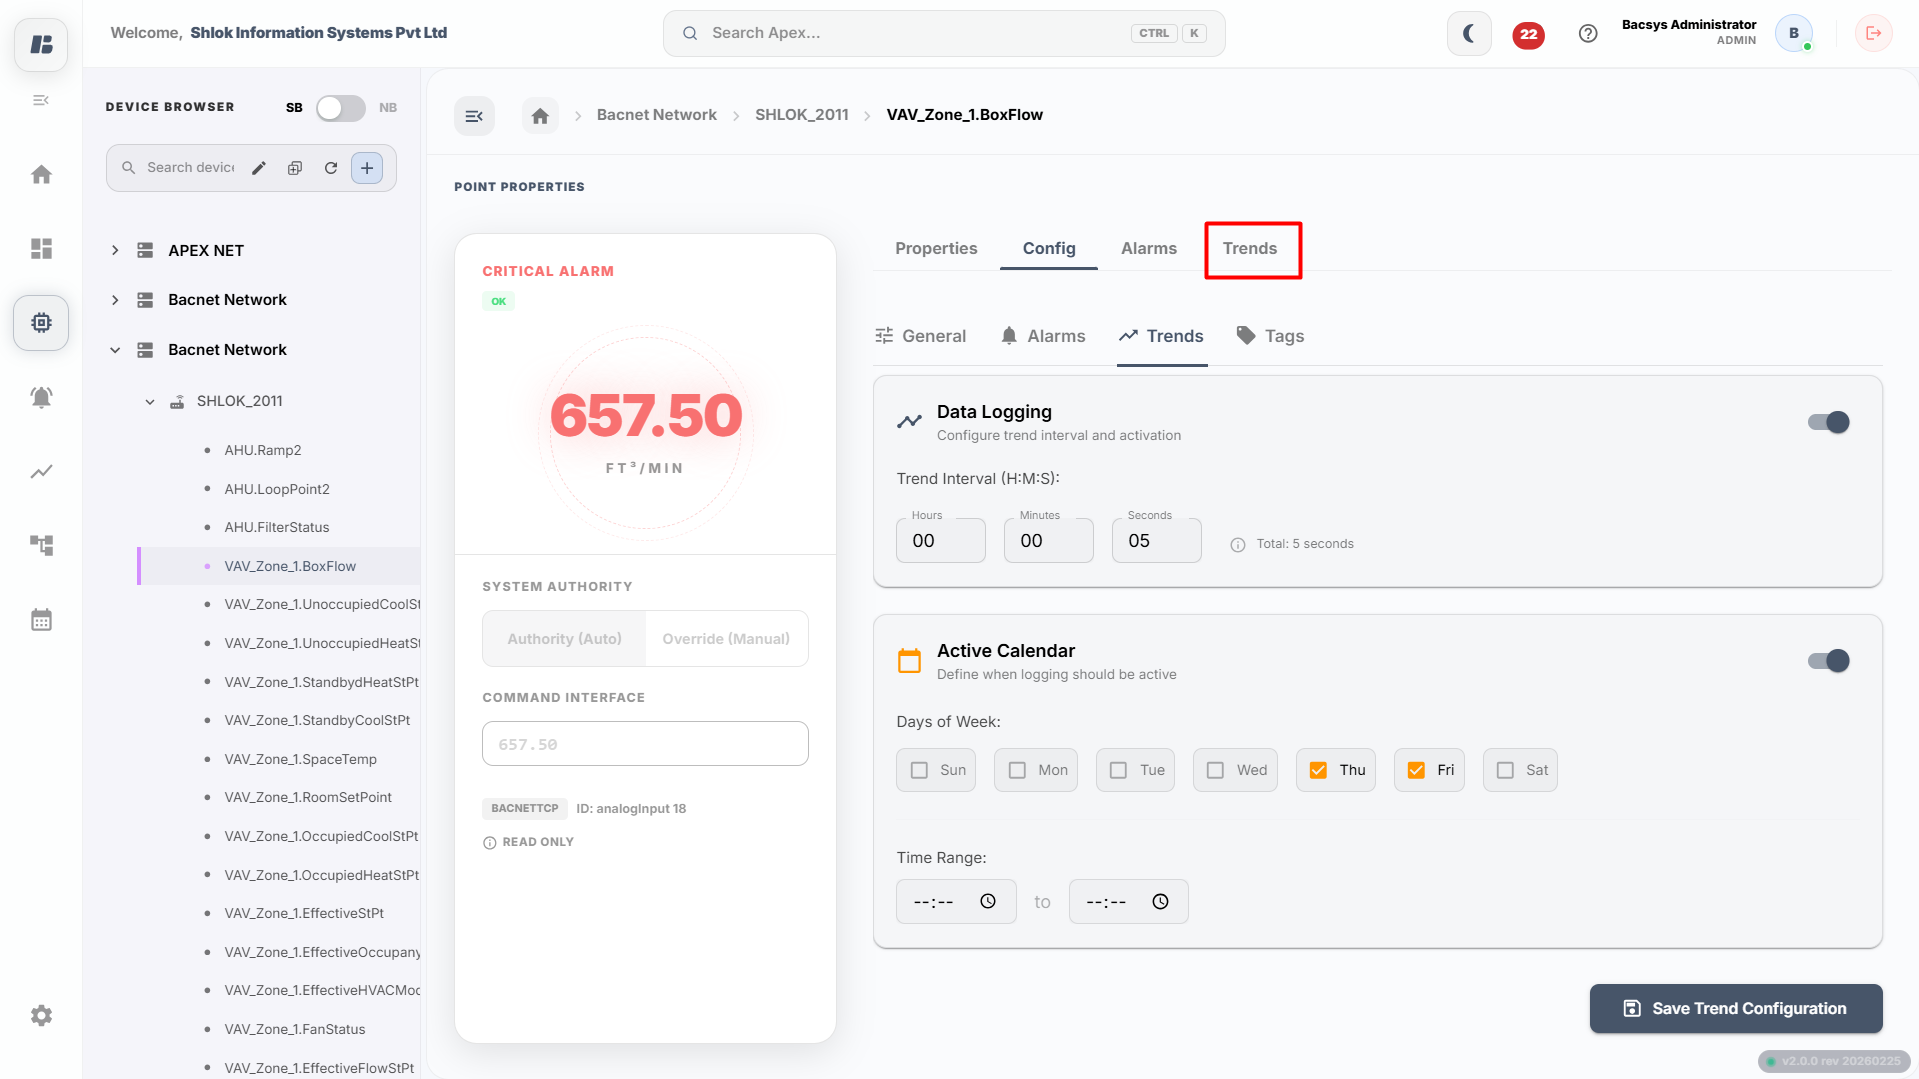
-
Once inside the Trends tab, you can view the trend data in two formats:
- Table View: Displays the historical data points in a tabular format.
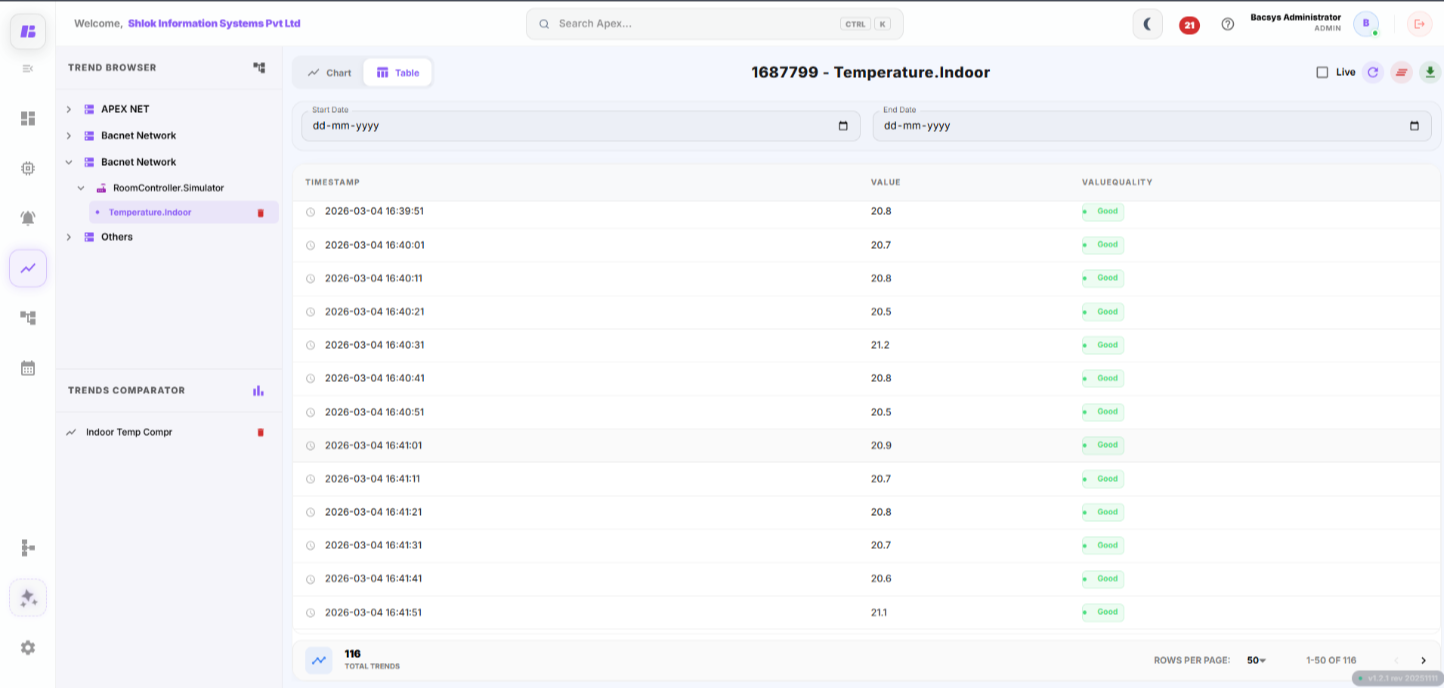
- Chart View: Shows the trend data graphically in a chart.
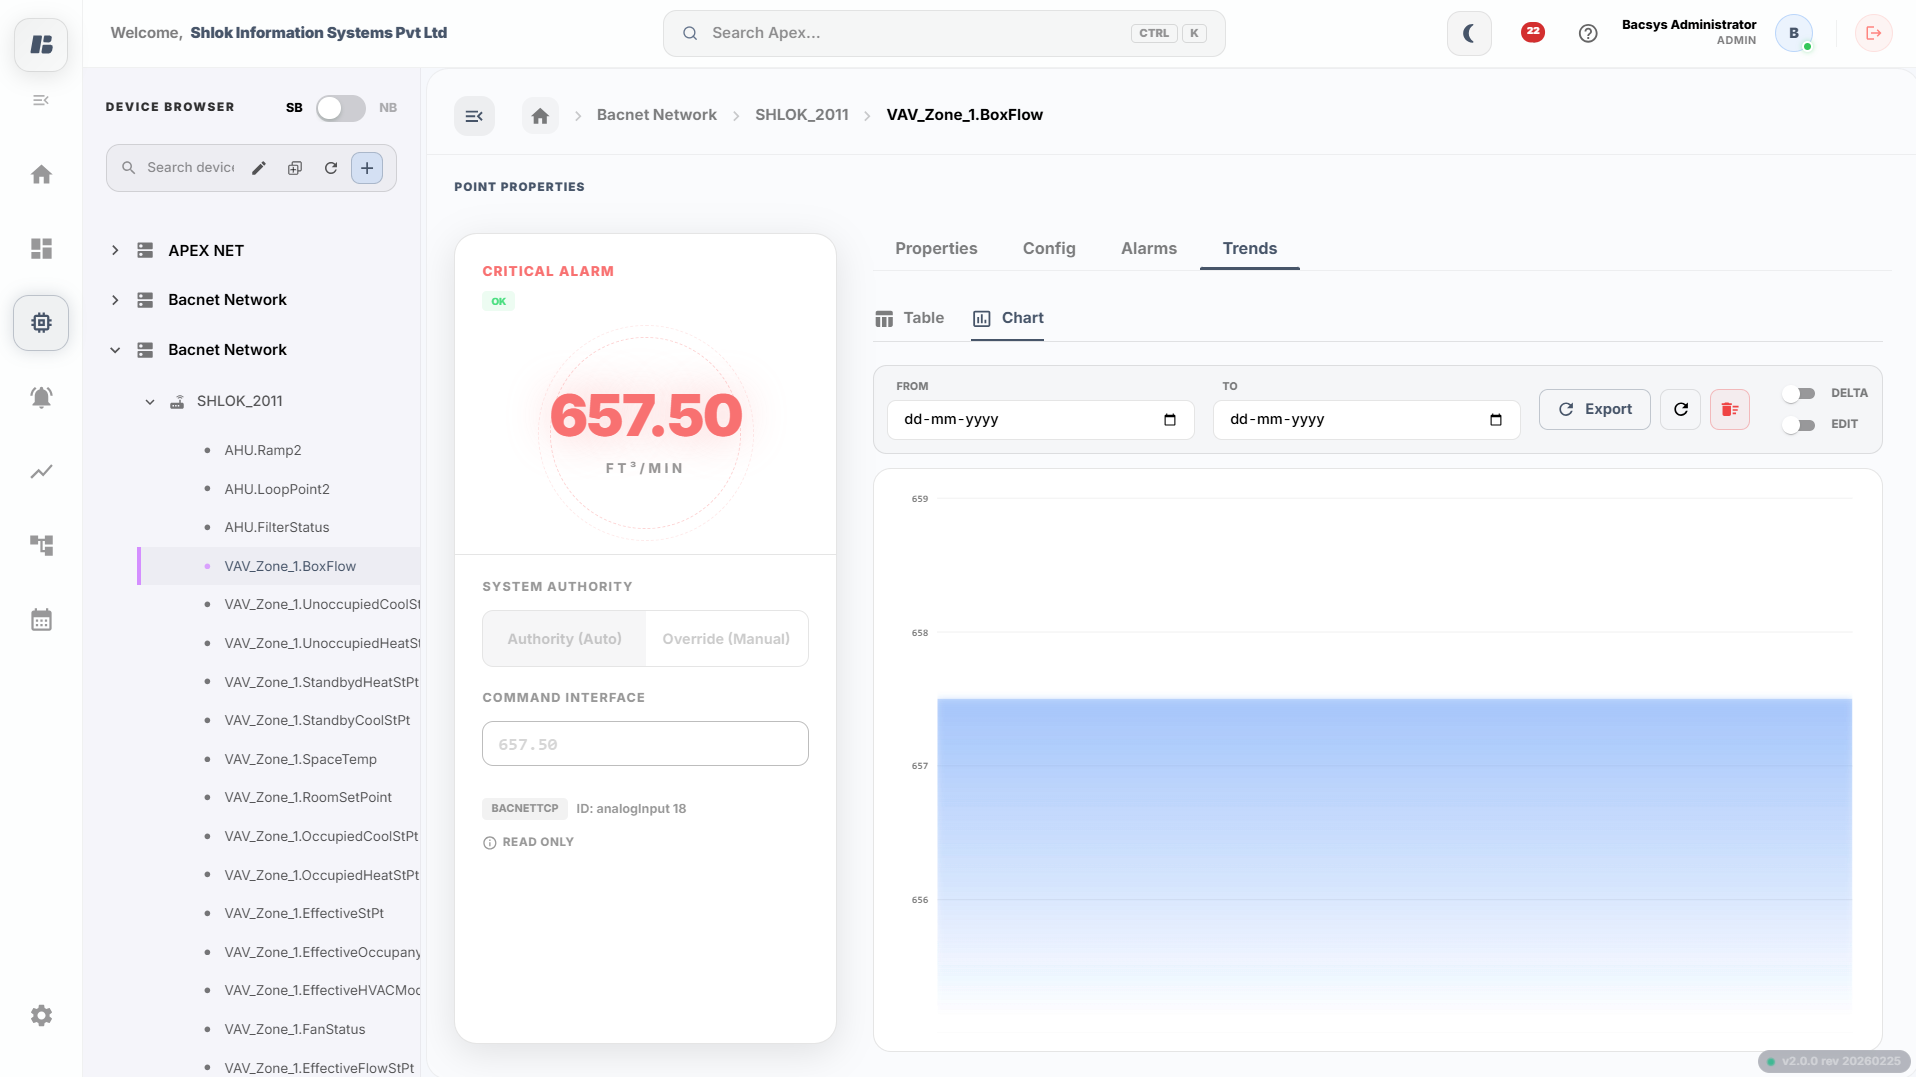
- Table View: Displays the historical data points in a tabular format.
-
The trends are automatically updated at the configured trend interval (e.g., every 5 seconds) to reflect the latest readings from the point.
Trends & Charts – Controls and Actions
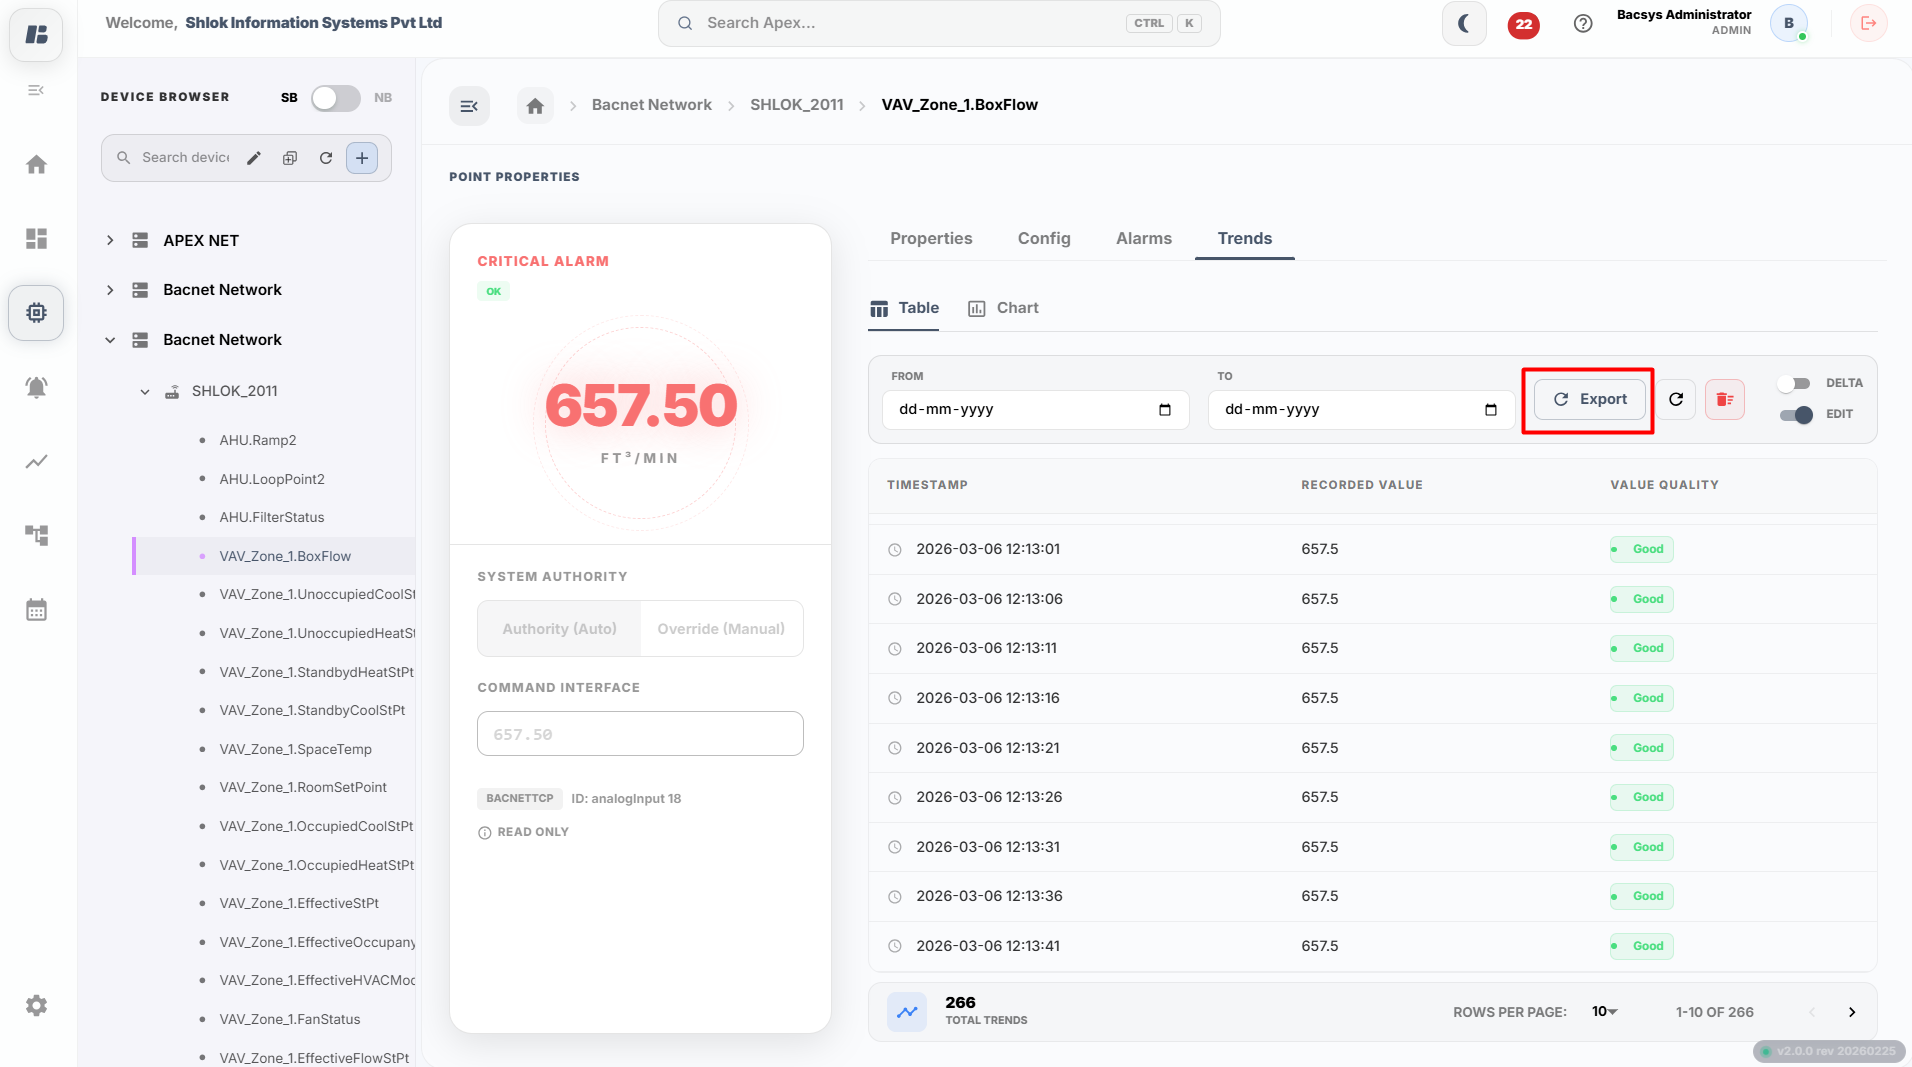
Export Button
- Exports the displayed trend data as a CSV file.
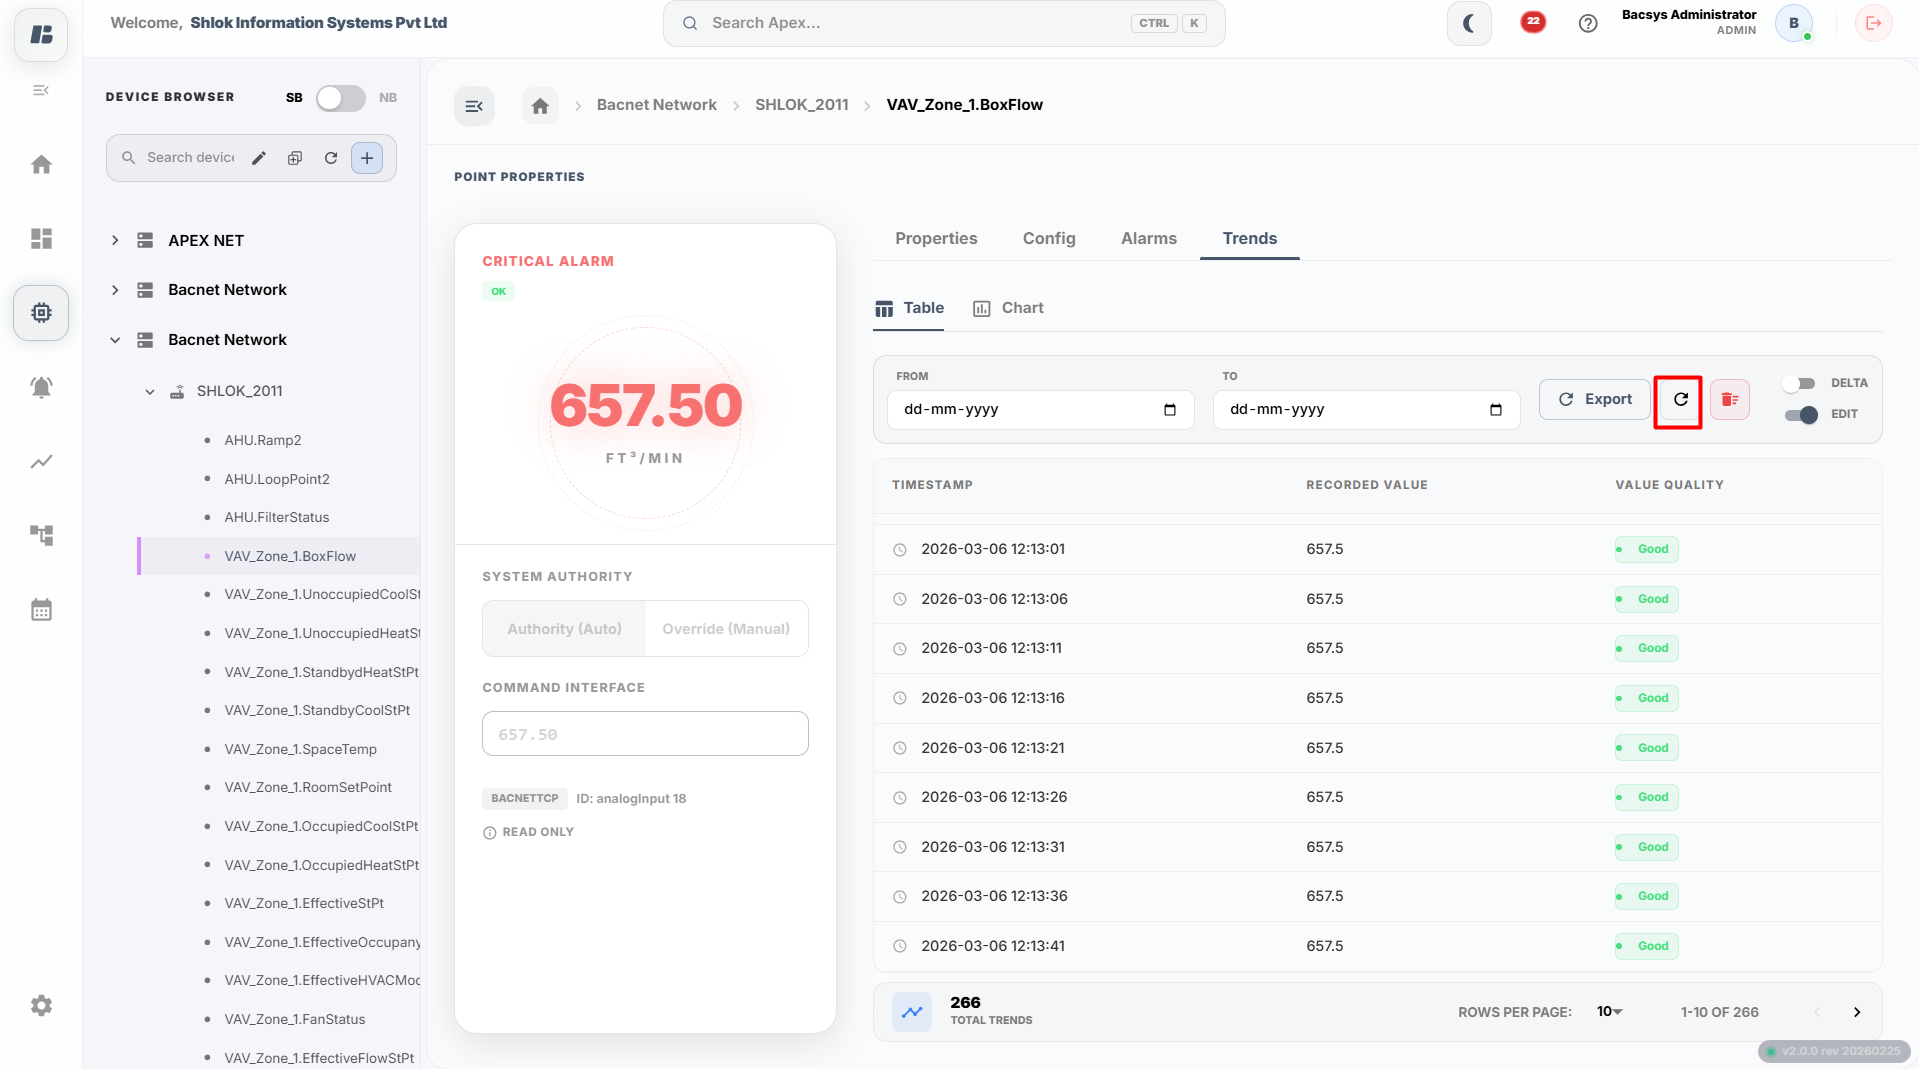
Refresh Button
- Reloads and updates the latest data on the chart.
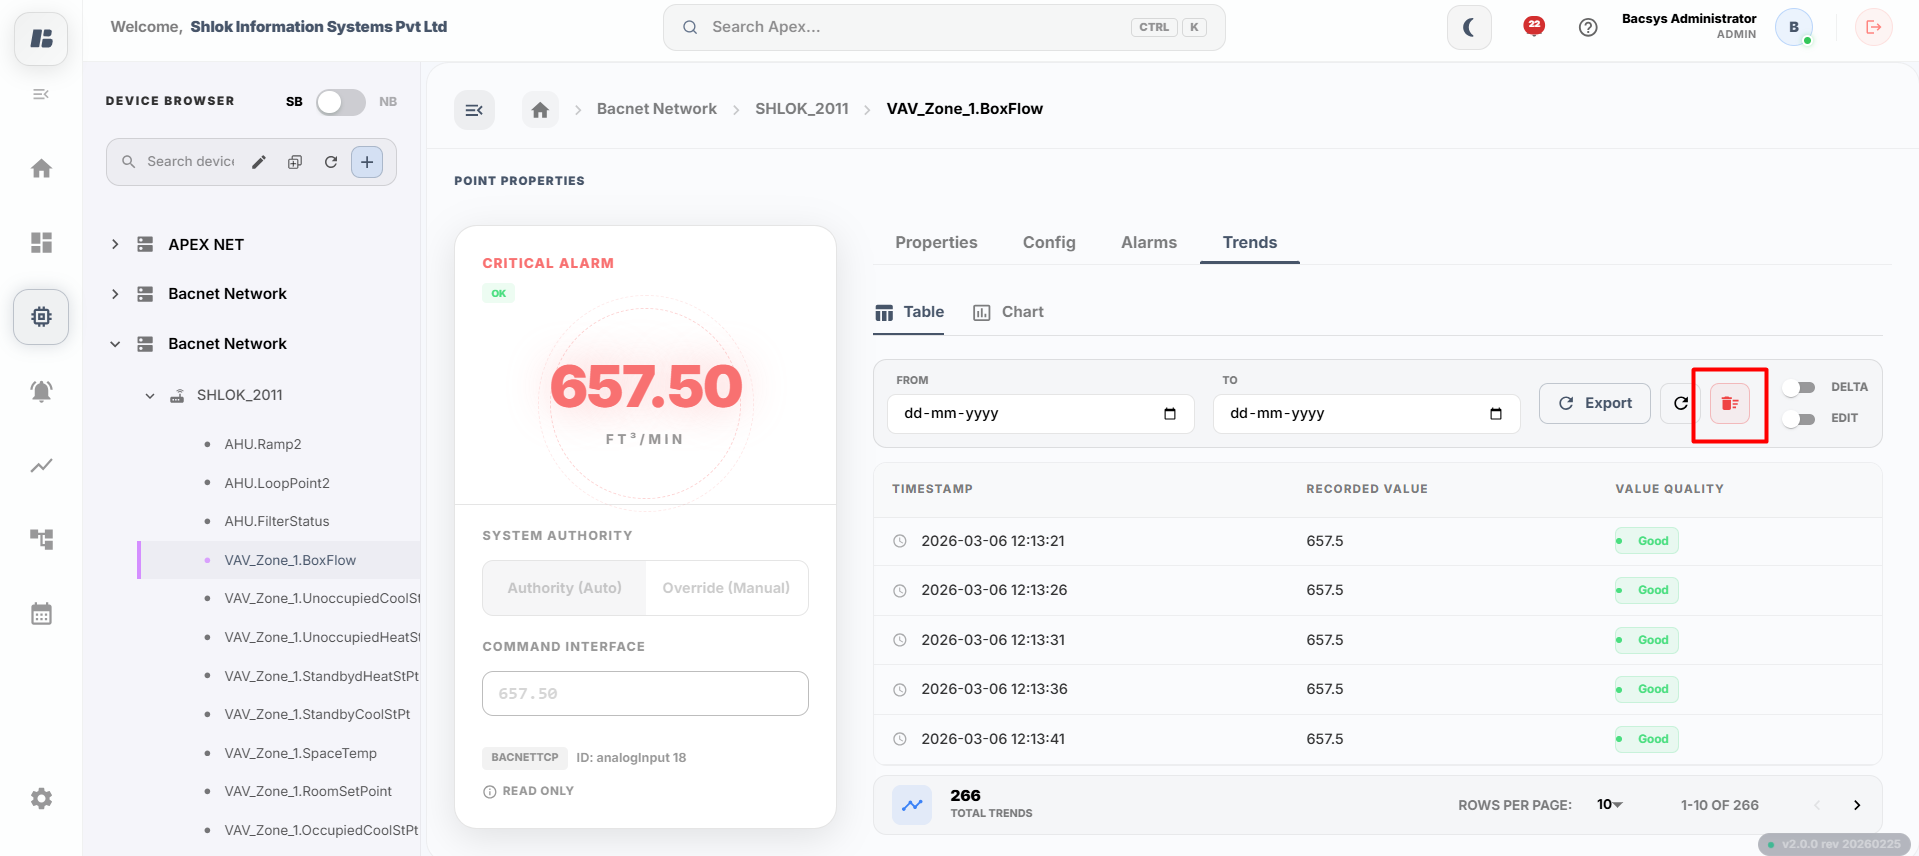
Delete Button
- Removes the selected trend or chart.
Delta Toggle
A switch to control how values are displayed:
- ON → Shows Recorded Values
- OFF → Shows Delta (Change) Values
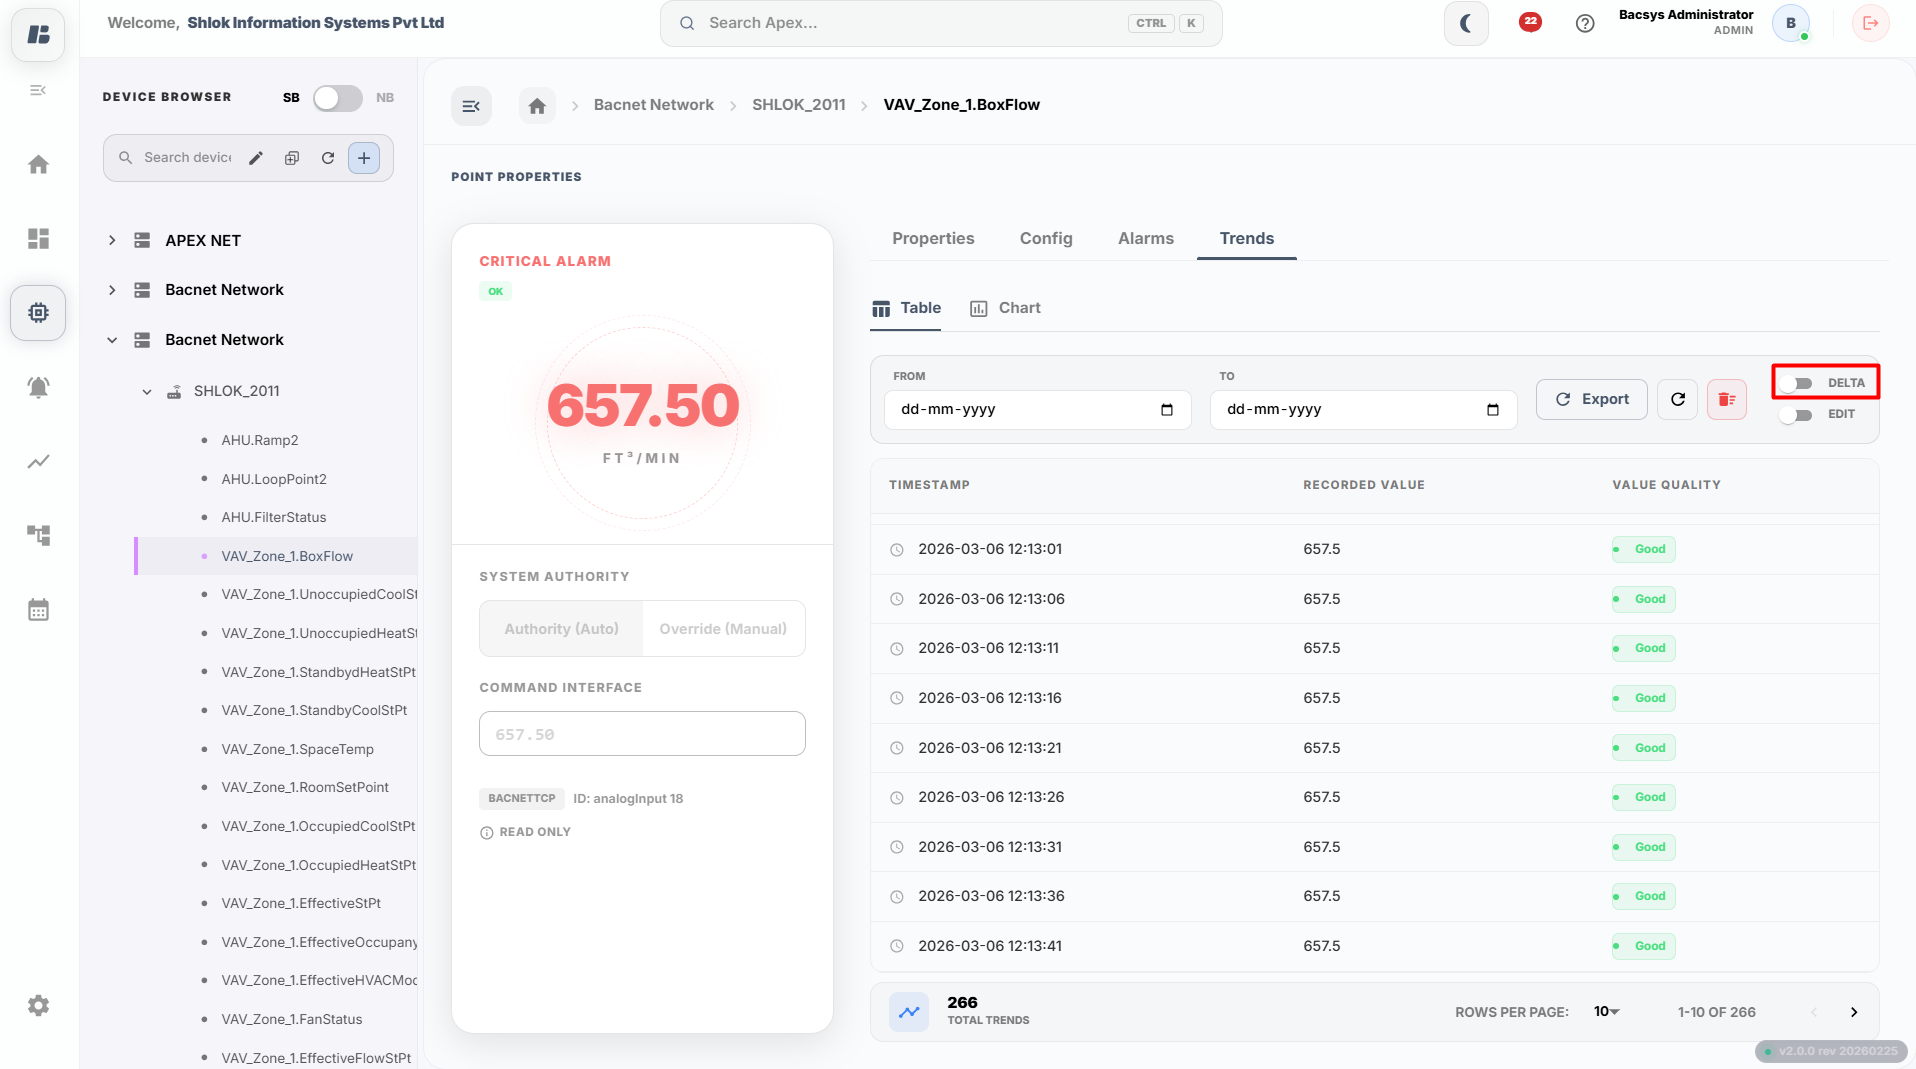
Edit Option
- Allows modification of the existing trend or chart settings.