

Dashboard
The Dashboard provides a centralized overview of the entire Wages application. It displays key metrics, billing information, revenue details, and tena...
The Dashboard provides a centralized overview of the entire Wages application. It displays key metrics, billing information, revenue details, and tenant-related insights in a single view. Users can monitor the overall performance of the property, review utility collections, and analyze billing trends without navigating to multiple pages.
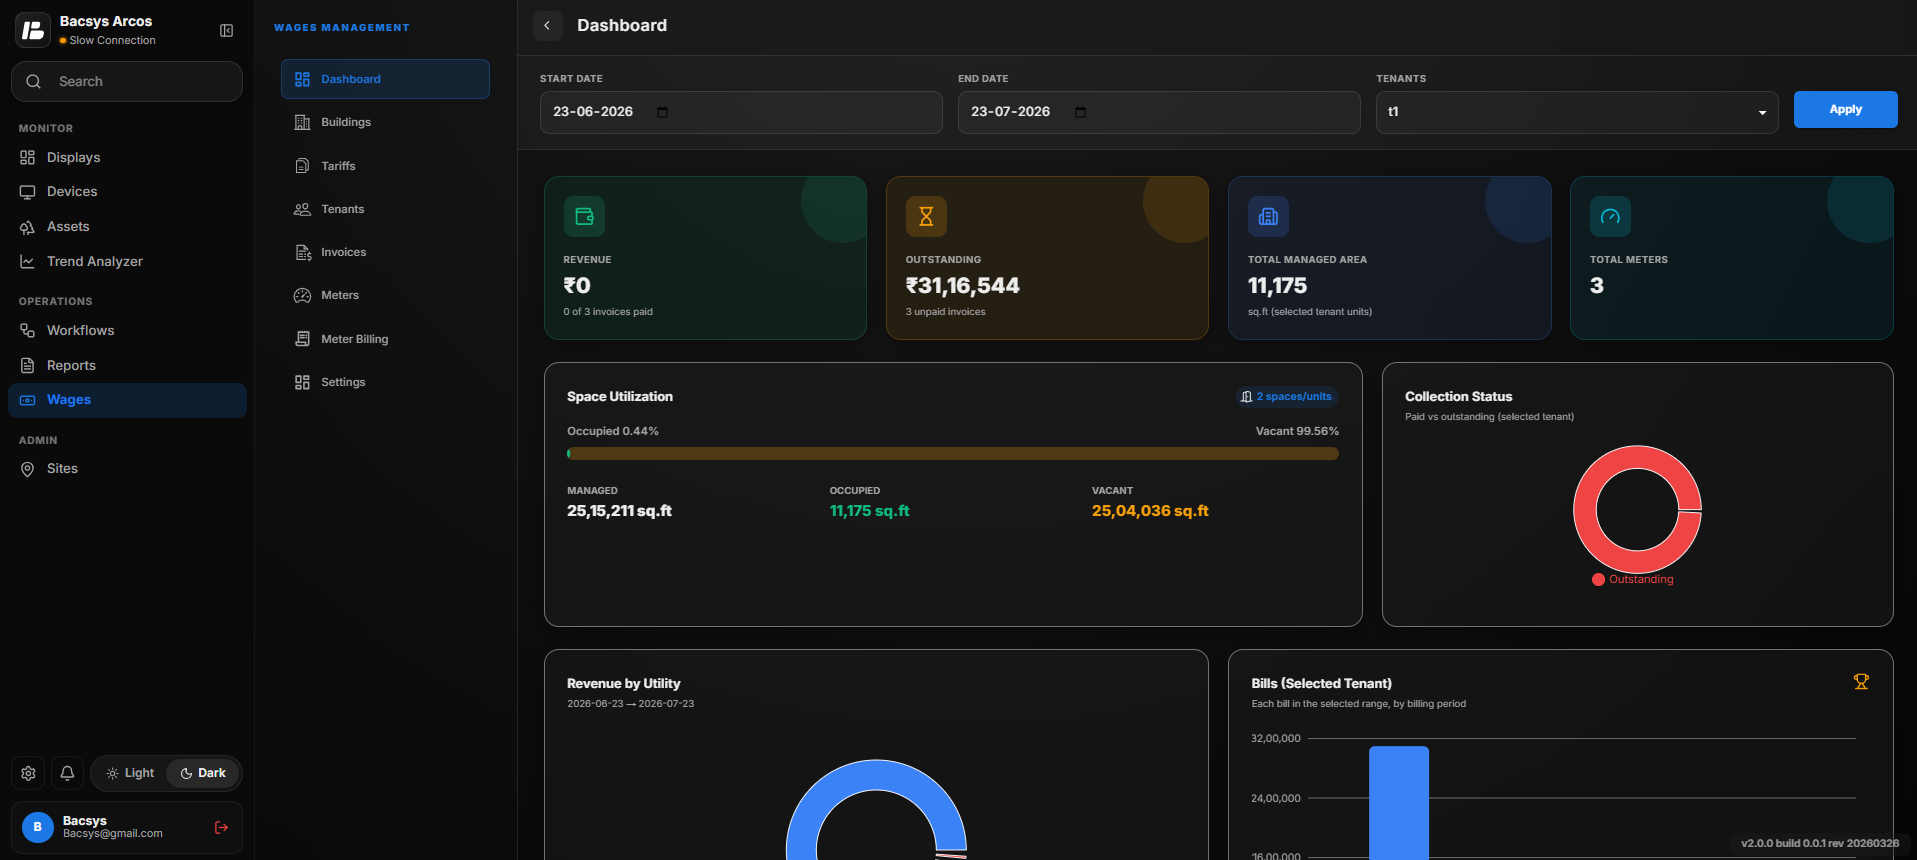
Accessing the Dashboard
- Log in to the Wages application.
- From the left navigation menu, click Dashboard.
- The Dashboard page opens with the latest available data.
Filter Dashboard Data
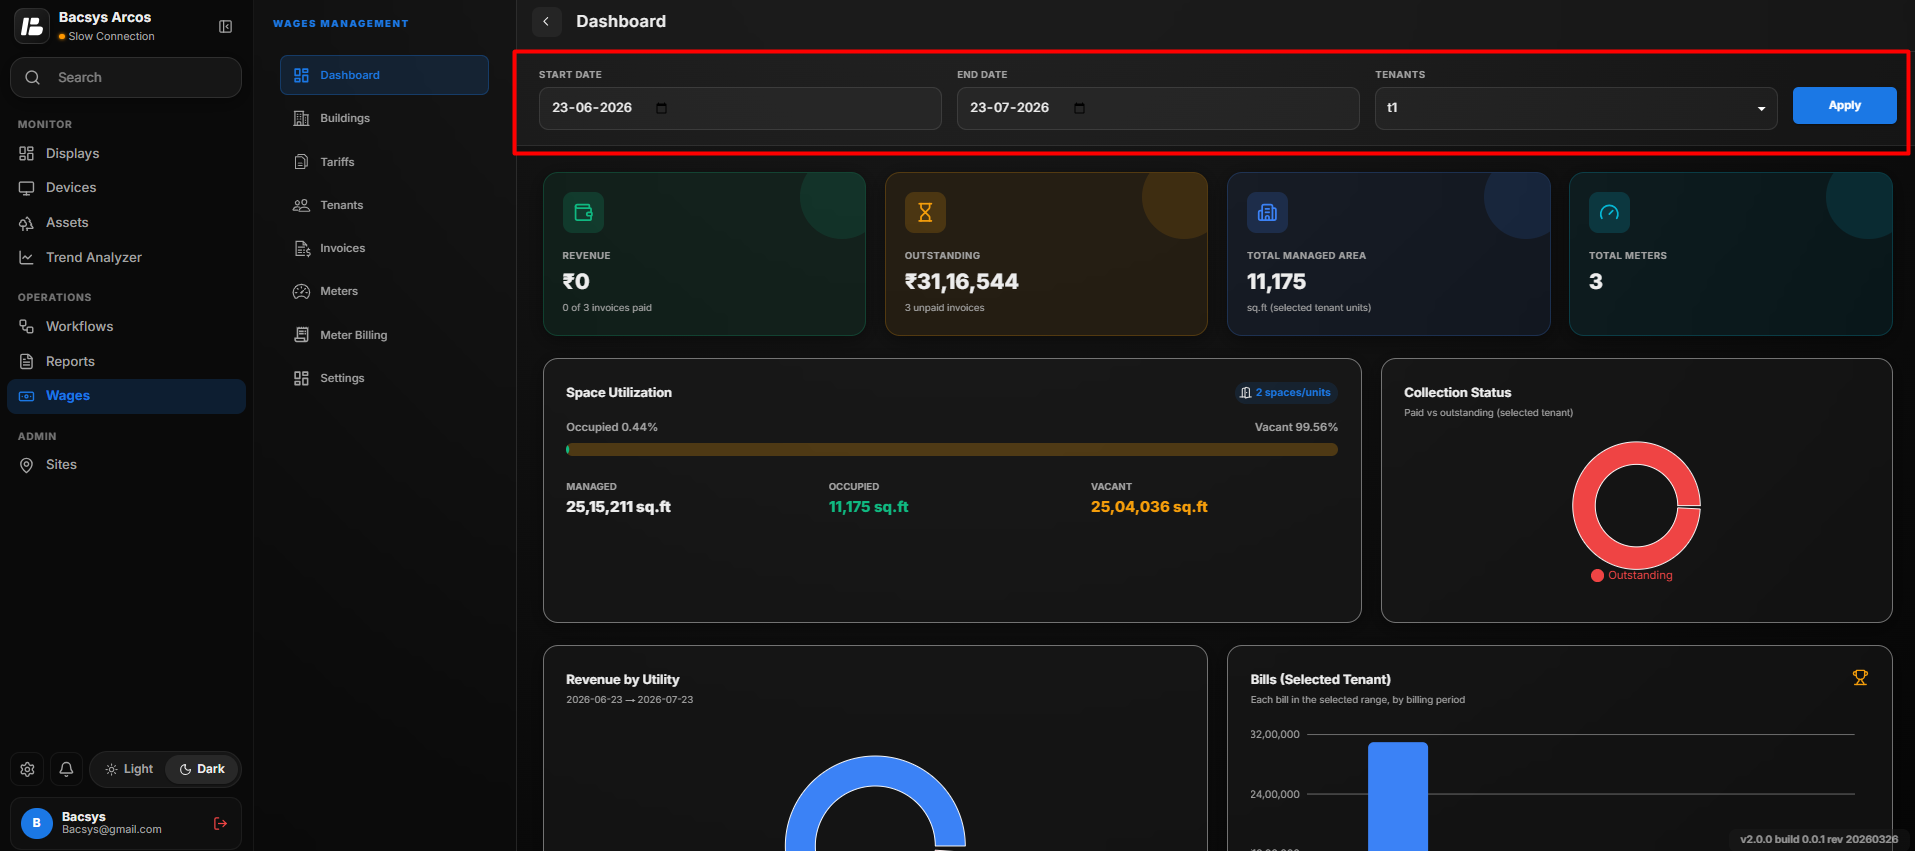
The dashboard allows users to filter data for a specific period.
Steps
- Locate the Start Date field.
- Select the beginning date for the required reporting period.
- Locate the End Date field.
- Select the ending date.
- Click Apply.
After clicking Apply, all dashboard widgets, charts, and summary cards are refreshed to display data only for the selected date range.
Dashboard Summary Cards
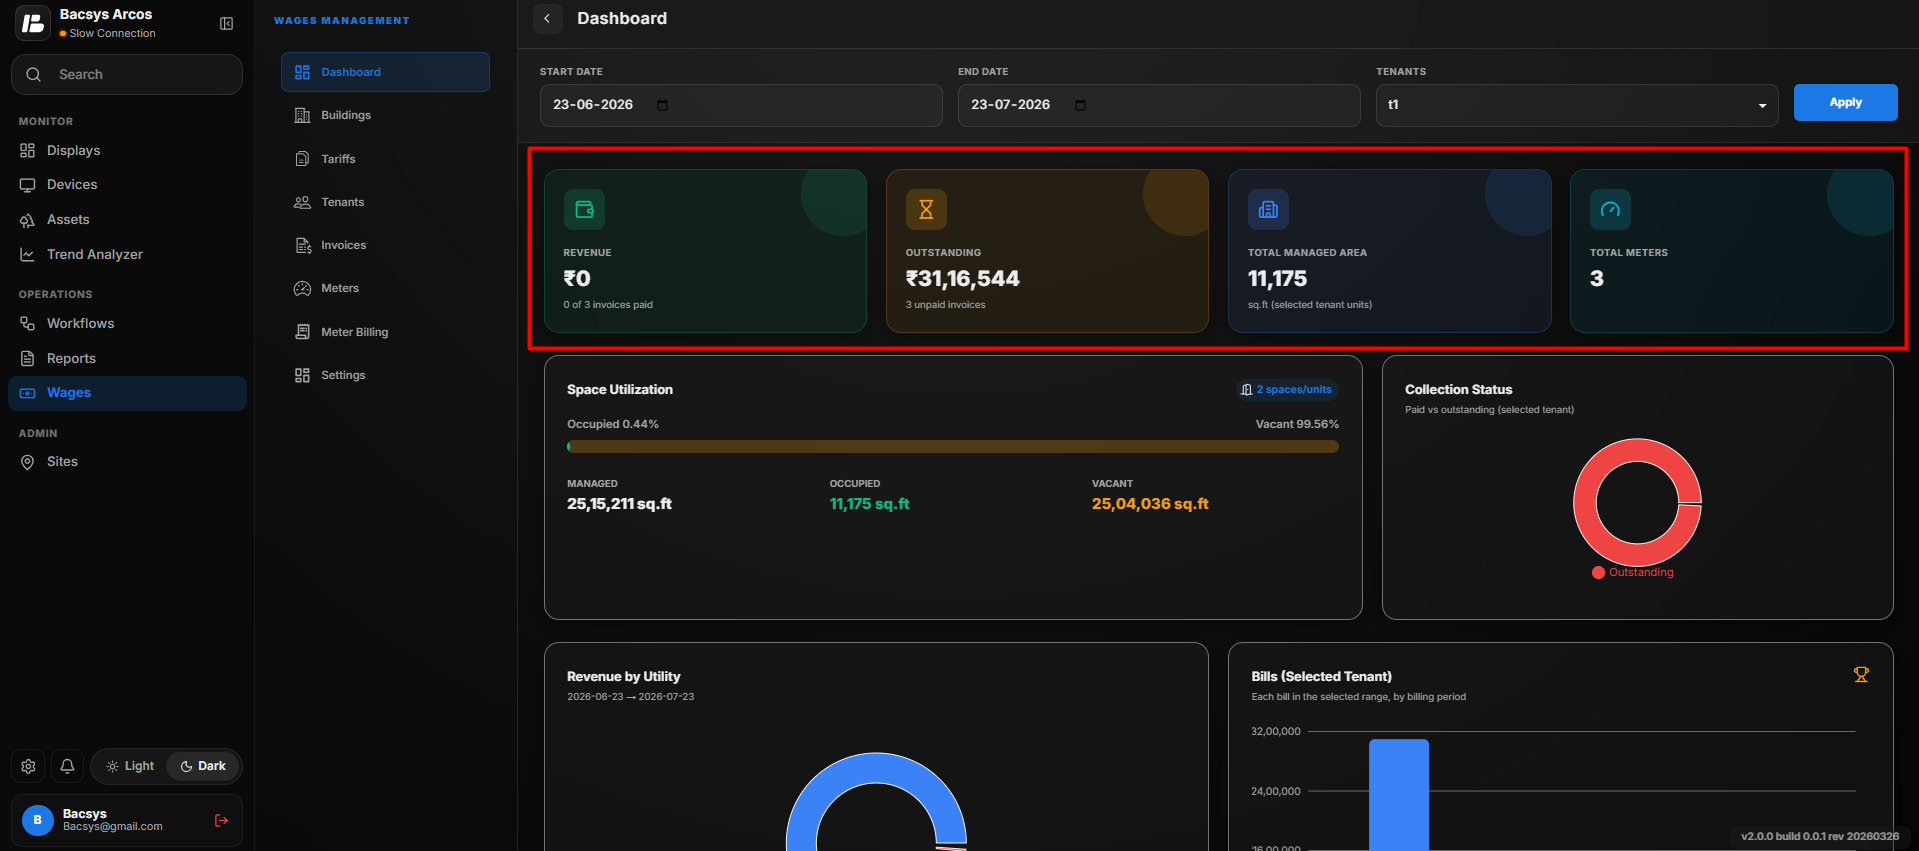
The top section of the dashboard displays summary cards that provide a quick overview of important business information.
Revenue
Displays the total revenue generated during the selected date range.
Purpose
- Monitor total income.
- Compare revenue over different periods.
Outstanding
Displays the total outstanding amount that is yet to be collected from tenants.
Purpose
- Track pending payments.
- Identify overdue collections.
Total Managed Area
Displays the total area currently managed within the property.
Purpose
- View the overall managed space.
- Understand the scale of managed properties.
Total Meters
Displays the total number of utility meters configured in the system.
Purpose
- Verify the number of active utility meters.
- Monitor connected metering devices.
Space Utilization
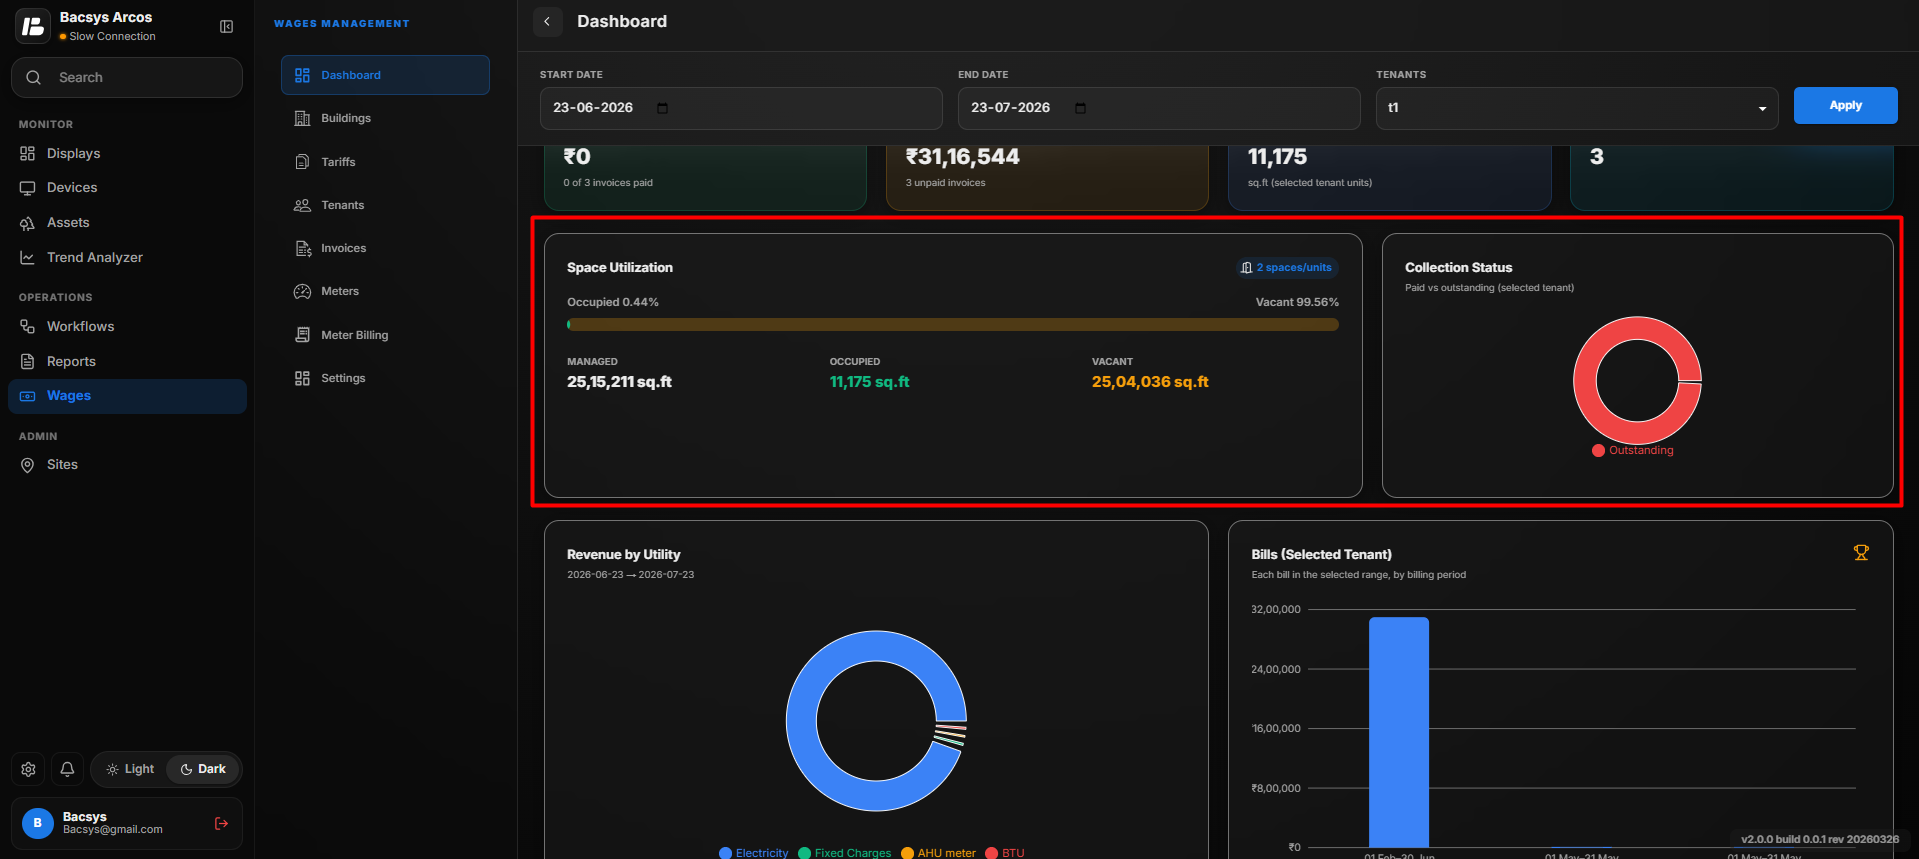
The Space Utilization section displays how the available property space is currently being utilized.
Users can quickly understand:
- Occupied space
- Available space
- Overall utilization percentage
This helps property managers monitor occupancy levels and optimize space allocation.
Collection Status
The Collection Status section provides an overview of payment collections.
It helps users understand:
- Amount collected
- Pending collections
- Overall collection progress
This enables finance teams to monitor payment performance and identify pending dues.
Revenue by Utility
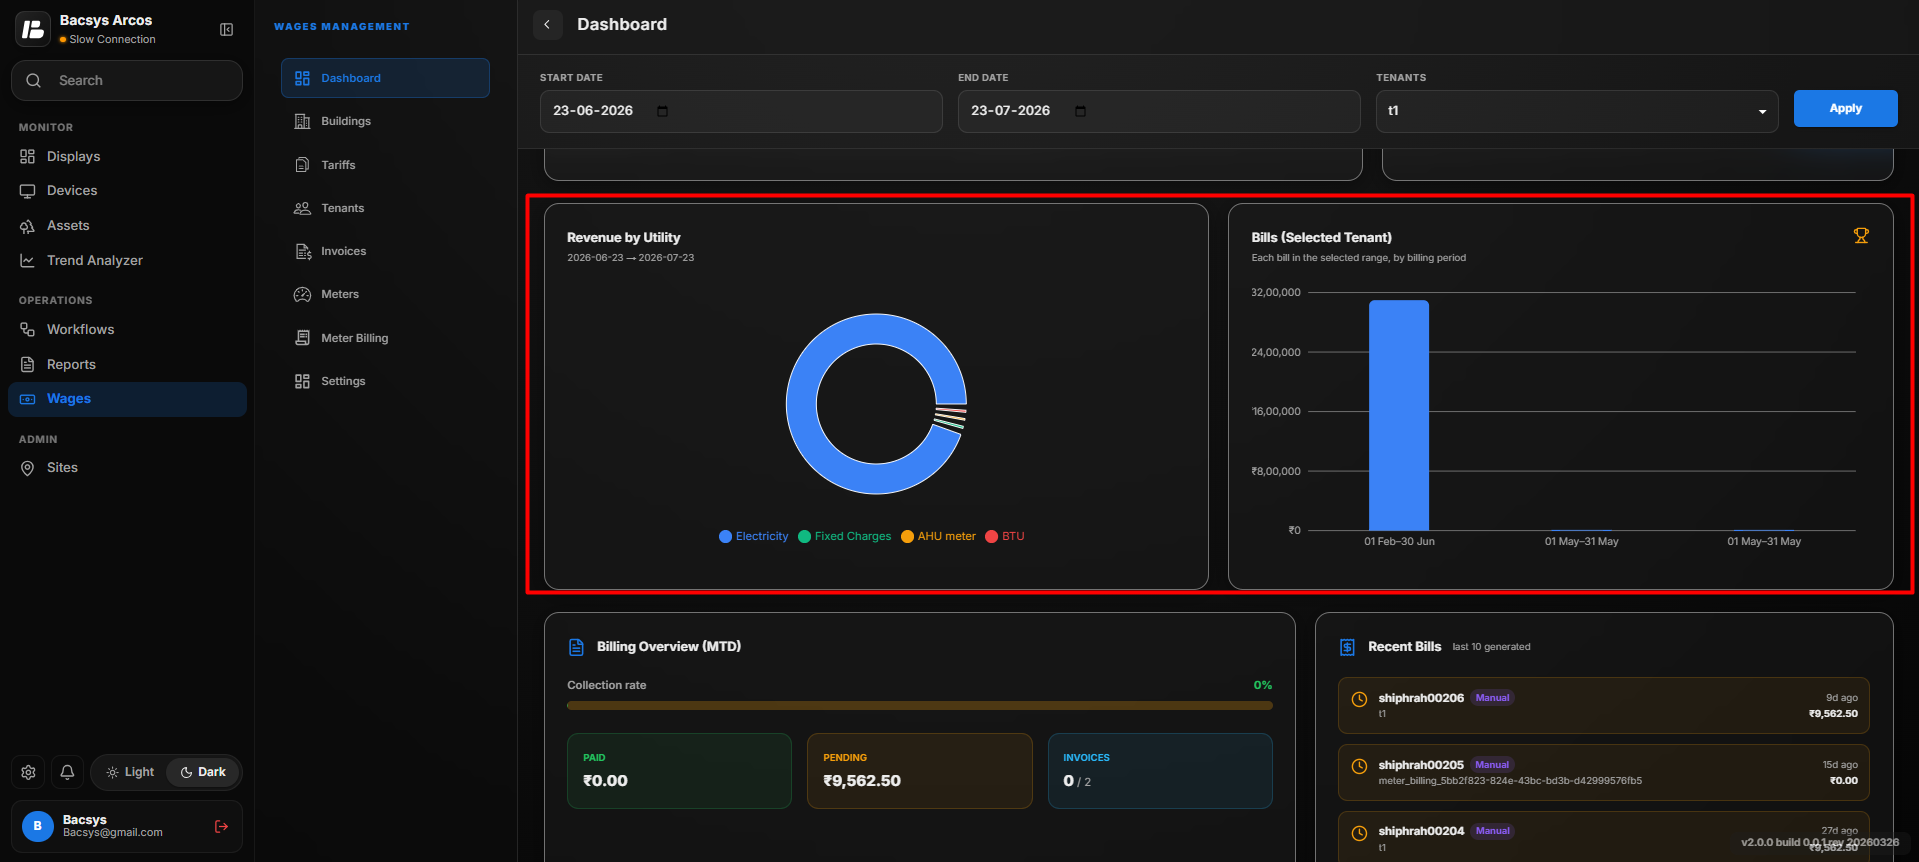
The Revenue by Utility section displays the revenue generated from different utilities.
Examples include:
- Electricity
- Water
- Gas
- Other configured utilities
This helps users analyze which utility contributes the most revenue.
Bills
The Bills section provides a quick summary of billing information.
Users can review:
- Total bills generated
- Billing status
- Overall billing activity
This section provides an overview of the current billing cycle.
Billing Overview
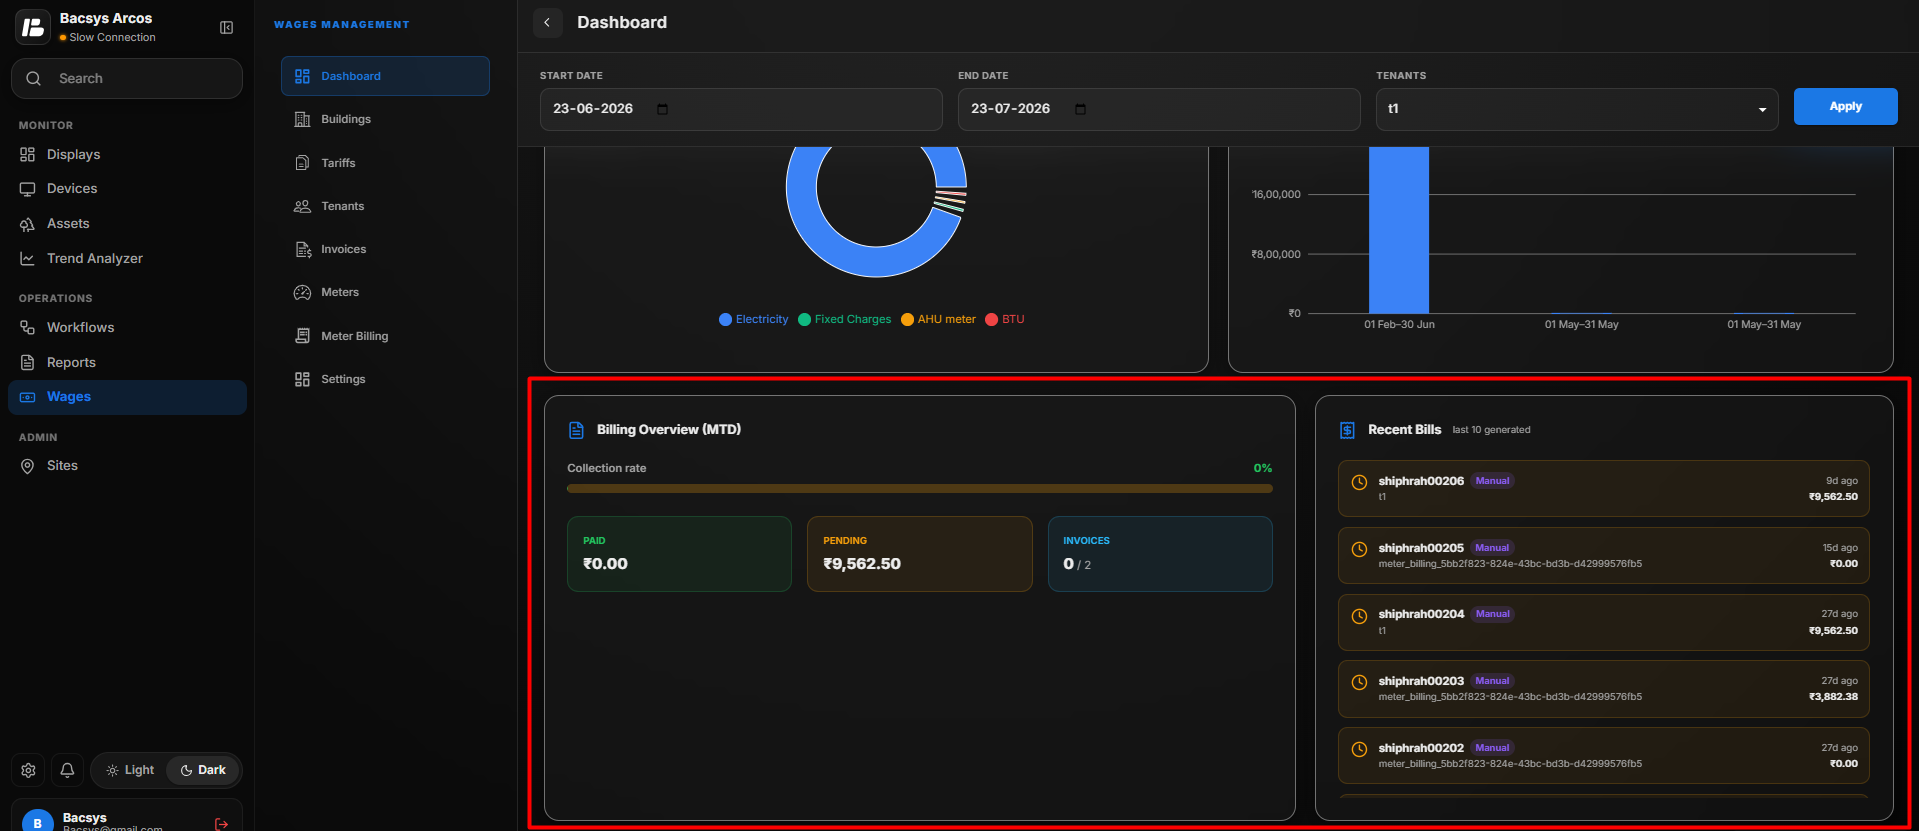 The Billing Overview section presents billing statistics in graphical form.
It helps users analyze:
- Billing trends
- Revenue trends
- Collection performance
- Billing distribution
The graphical representation makes it easier to compare billing performance across different periods.
Recent Bills
The Recent Bills section displays the latest bills generated in the system.
Users can quickly review information such as:
- Tenant
- Bill Number
- Bill Date
- Amount
- Bill Status
This section allows users to monitor the most recent billing activities without navigating to the Billing module.
Dashboard Refresh
Whenever a new date range is selected and Apply is clicked:
- All summary cards are updated.
- Charts are refreshed.
- Revenue values are recalculated.
- Billing information is updated.
- Collection data is refreshed.
- Recent bills are filtered based on the selected period.
This ensures that every dashboard component displays data only for the selected reporting period.
Benefits of the Dashboard
The Dashboard helps users to:
- Monitor overall property performance.
- Track tenant revenue.
- Review outstanding payments.
- Analyze utility-wise revenue.
- Monitor billing activities.
- View recent bills.
- Understand space utilization.
- Make informed business decisions using real-time information.