

Reports
Reports Module
The Reports module provides different report views for monitoring work volume, maintenance performance, preventive maintenance, SLA performance, maintenance costs, and backlog.
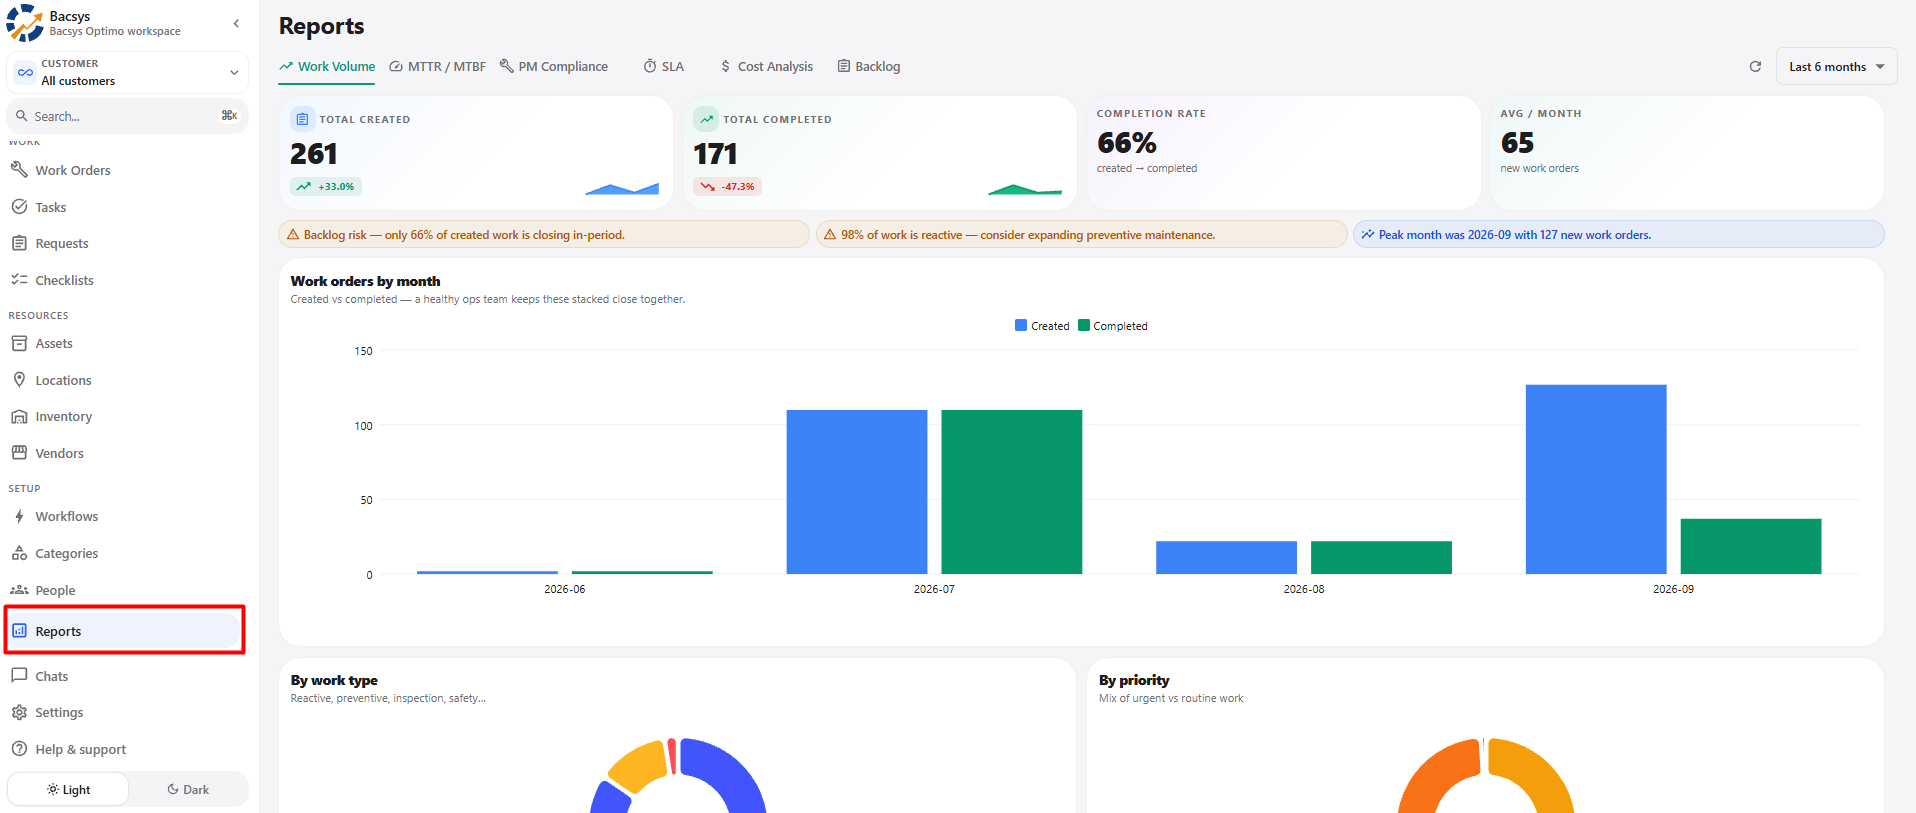
1. Reports Overview
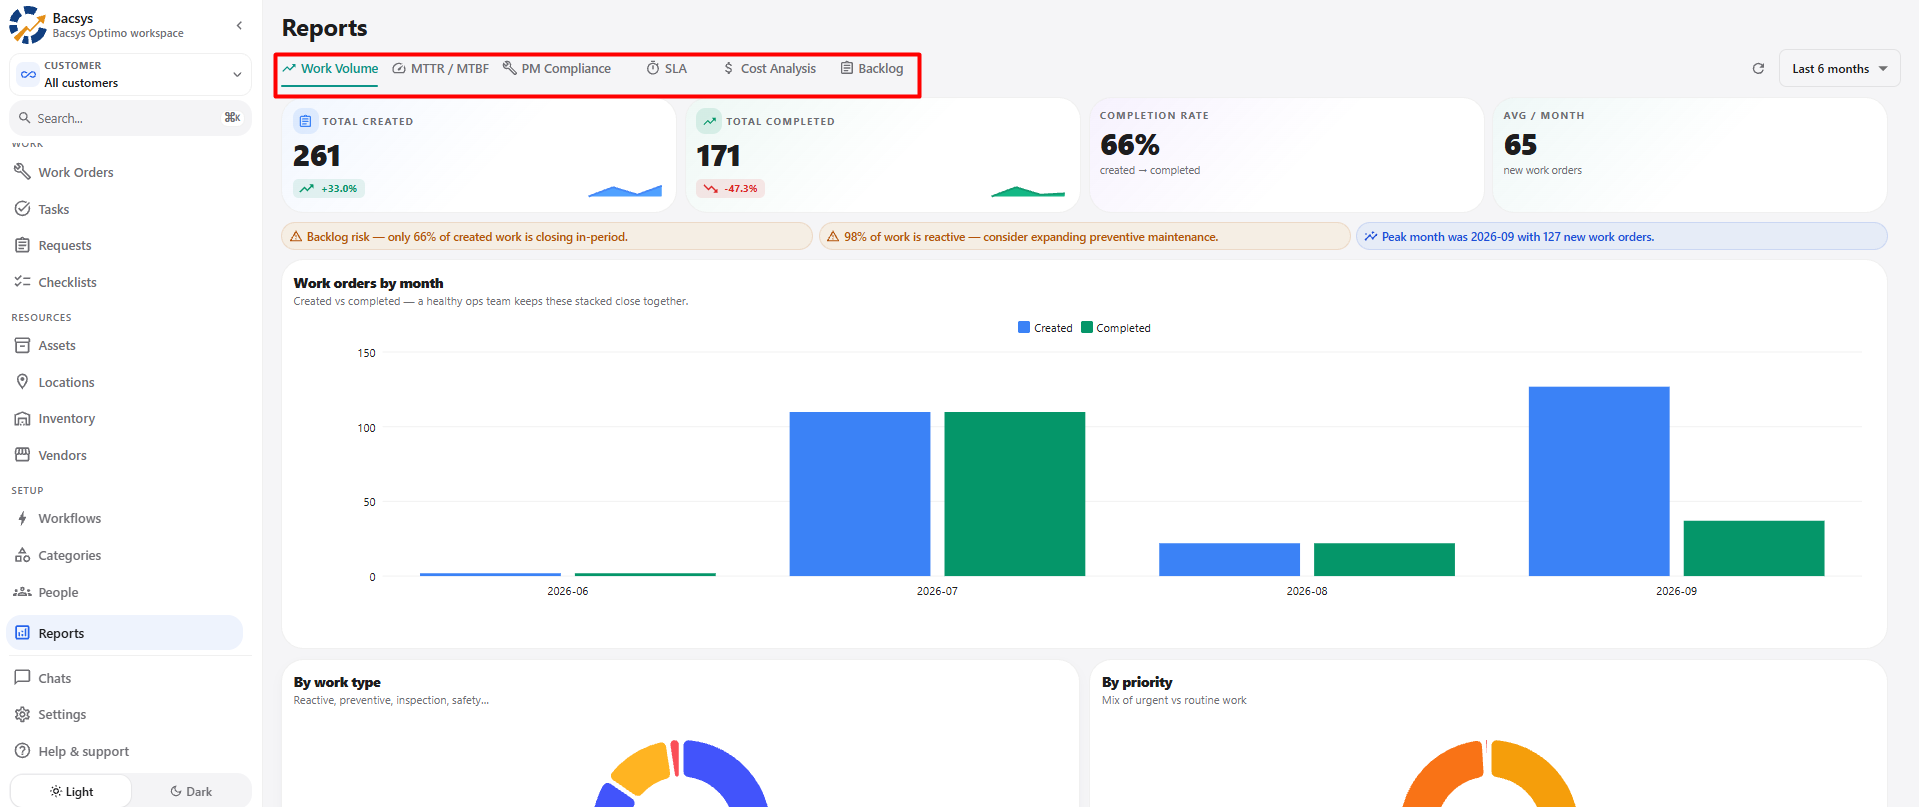
| Section / Option | Description |
|---|---|
| Reports | Opens the Reports module. |
| Work Volume | Displays work order creation, completion, completion rate, work type, priority, and site information. |
| MTTR / MTBF | Displays Mean Time to Repair and Mean Time Between Failures information. |
| PM Compliance | Displays preventive maintenance compliance and overdue information. |
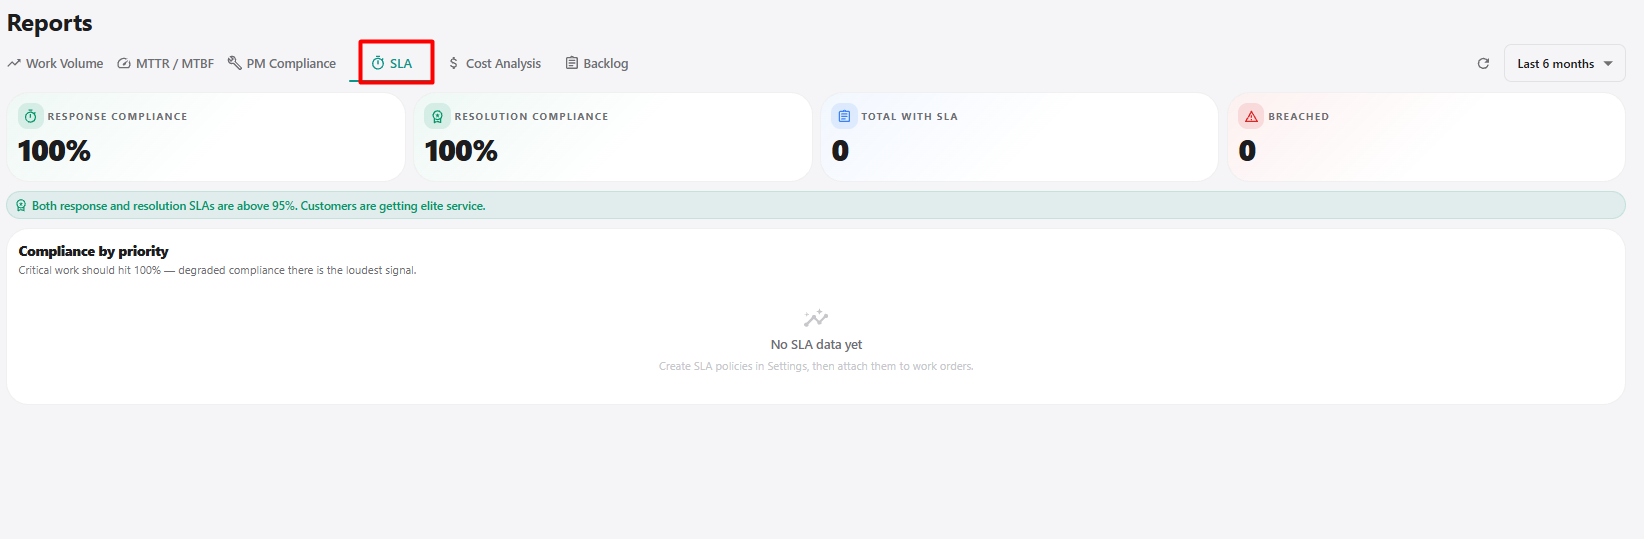
| SLA | Displays response and resolution SLA performance. |
| Cost Analysis | Displays maintenance spending, parts cost, labour cost, and cost by category. |
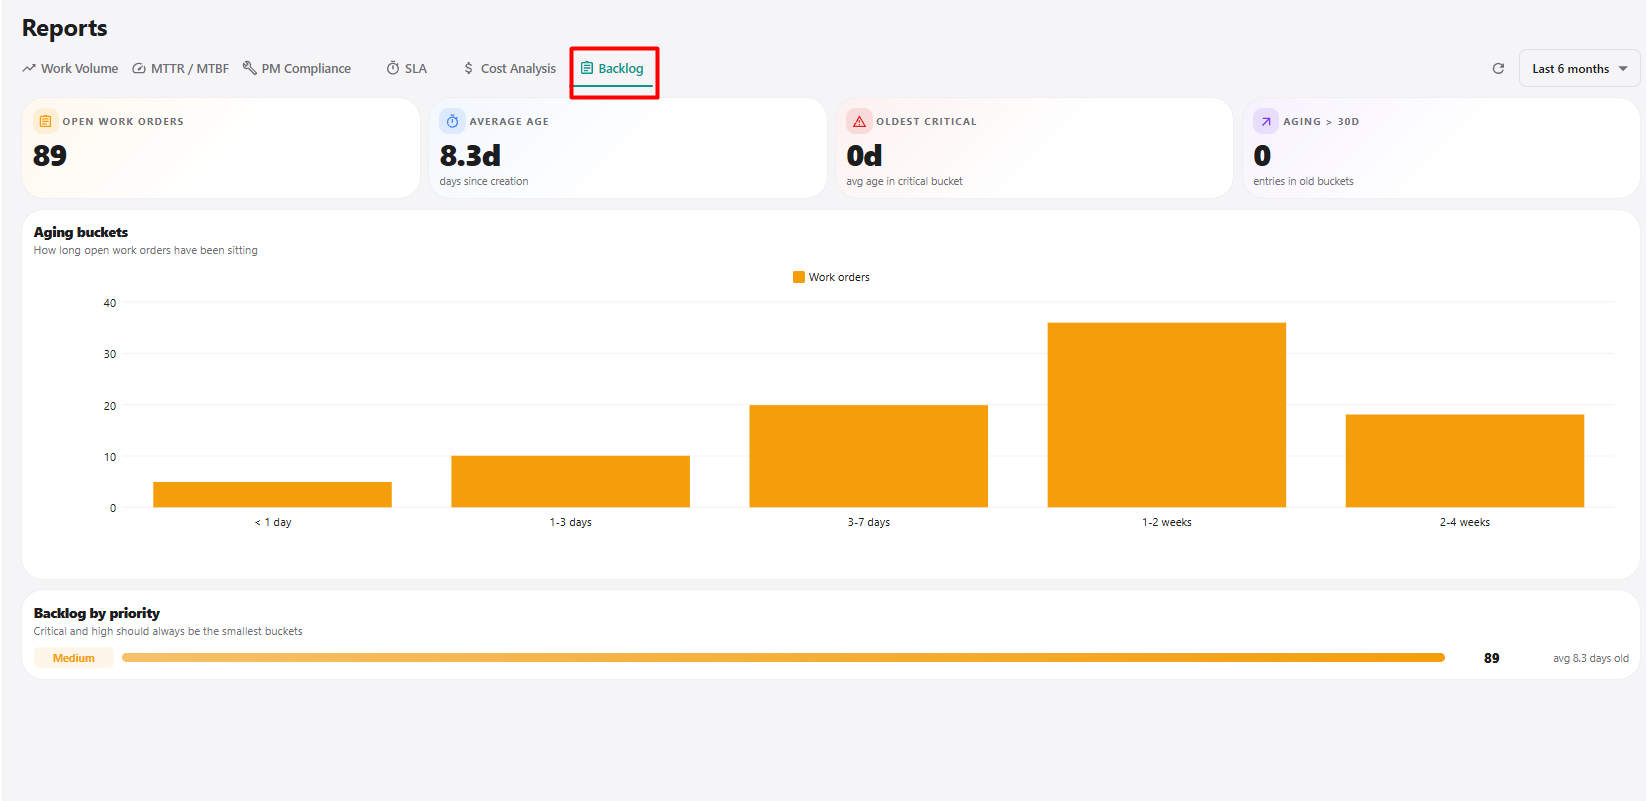
| Backlog | Displays open work orders and their aging information. |
| Refresh | Refreshes the report data. |
| Date Range | Allows the reporting period to be selected. |
| Last 3 months | Displays report data for the previous 3 months. |
| Last 6 months | Displays report data for the previous 6 months. |
| Last 12 months | Displays report data for the previous 12 months. |
2. Work Volume
The Work Volume report provides an overview of work orders created and completed during the selected reporting period.
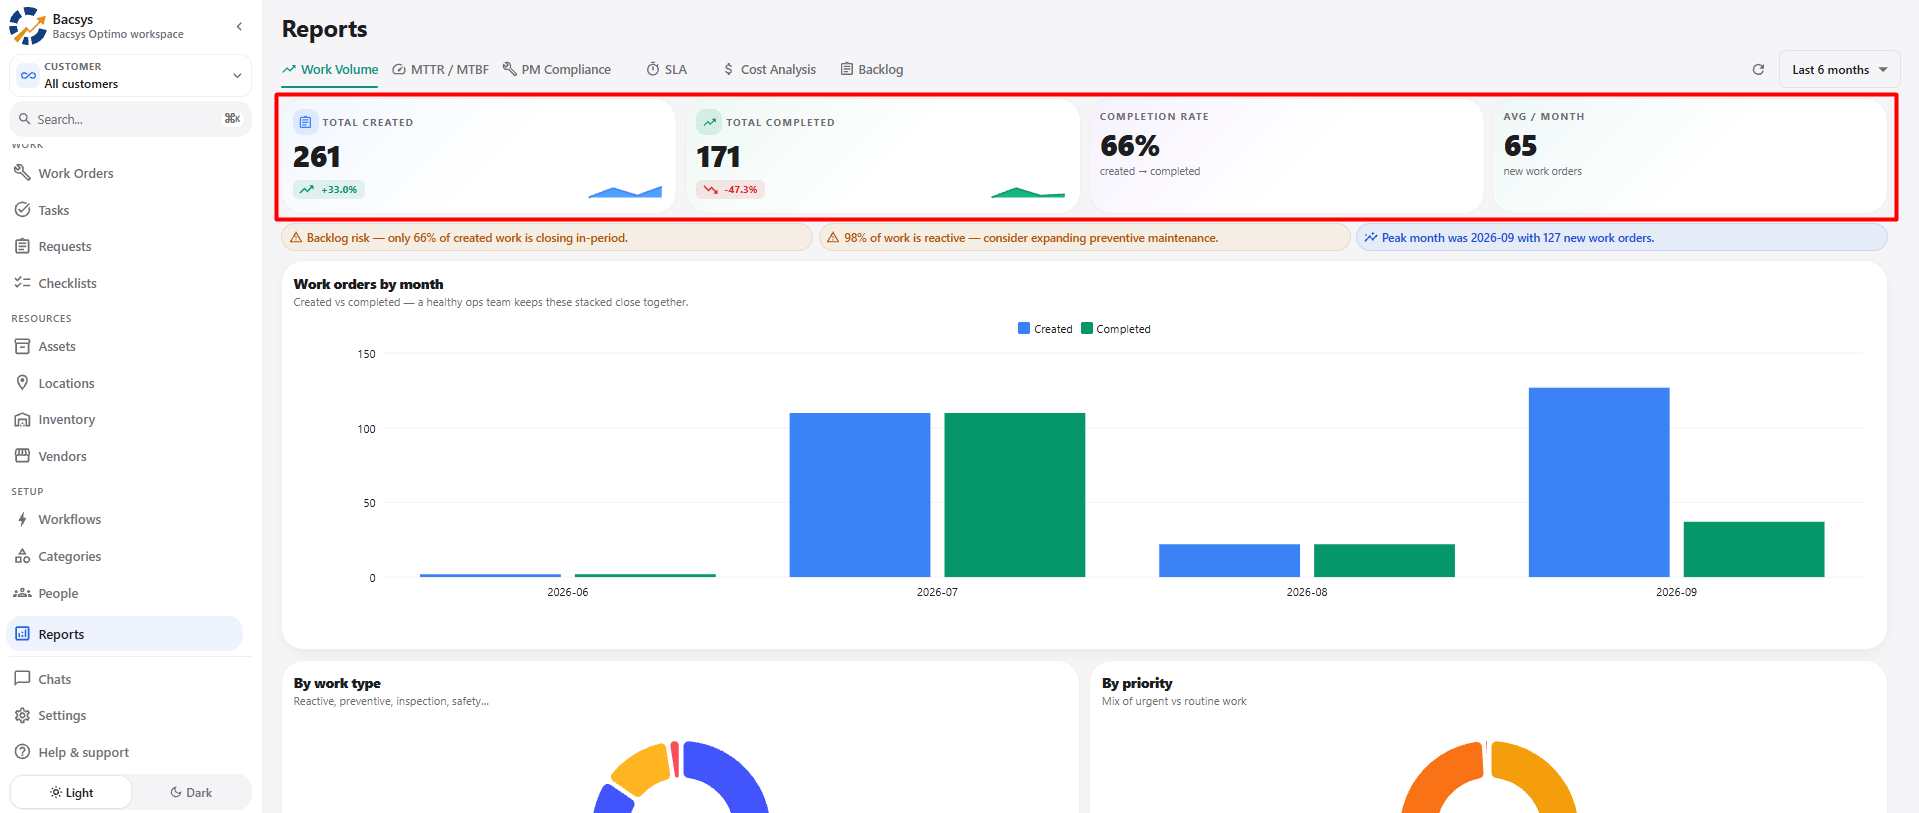
2.1 Work Volume Summary
| Metric | Description |
|---|---|
| Total Created | Displays the total number of work orders created during the selected period. |
| Total Completed | Displays the total number of work orders completed during the selected period. |
| Completion Rate | Displays the percentage of created work orders that have been completed. |
| Avg / Month | Displays the average number of new work orders created per month during the selected period. |
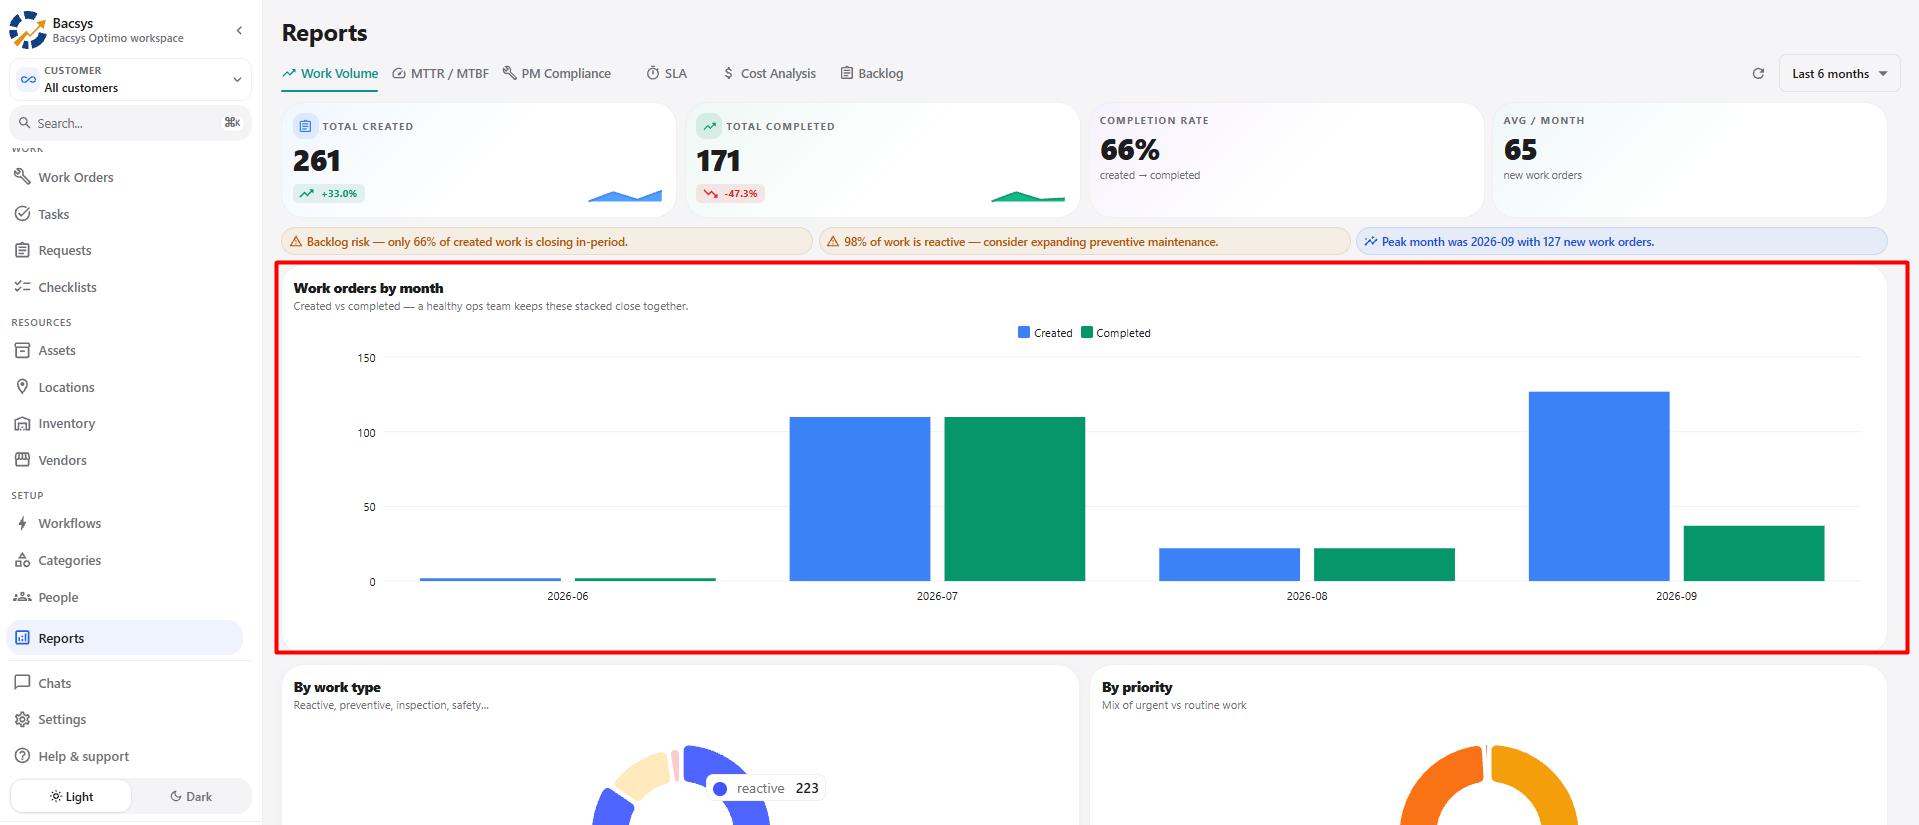
2.2 Work Orders by Month
| Section | Description |
|---|---|
| Work orders by month | Displays work order volume for each month. |
| Created | Represents work orders created during each month. |
| Completed | Represents work orders completed during each month. |
| Monthly comparison | Allows created and completed work orders to be compared across months. |
2.3 Work Orders by Work Type
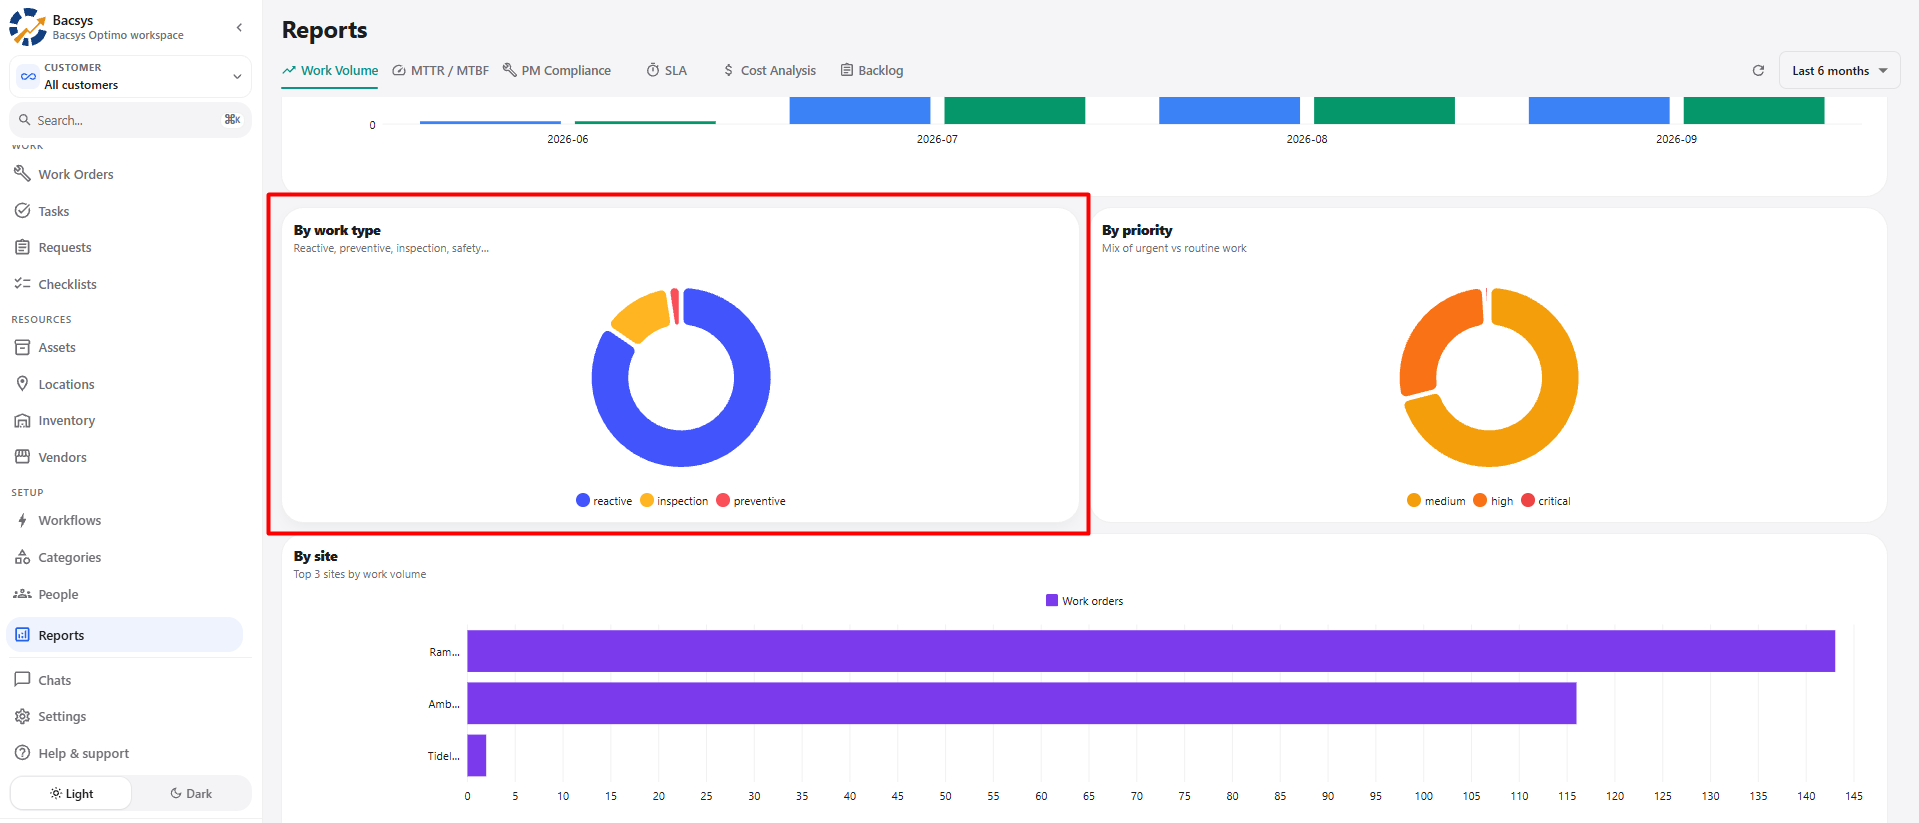
| Section | Description |
|---|---|
| By work type | Displays the distribution of work orders based on their work type. |
| Reactive | Displays reactive work orders. |
| Inspection | Displays inspection-related work orders. |
| Preventive | Displays preventive maintenance work orders. |
2.4 Work Orders by Priority
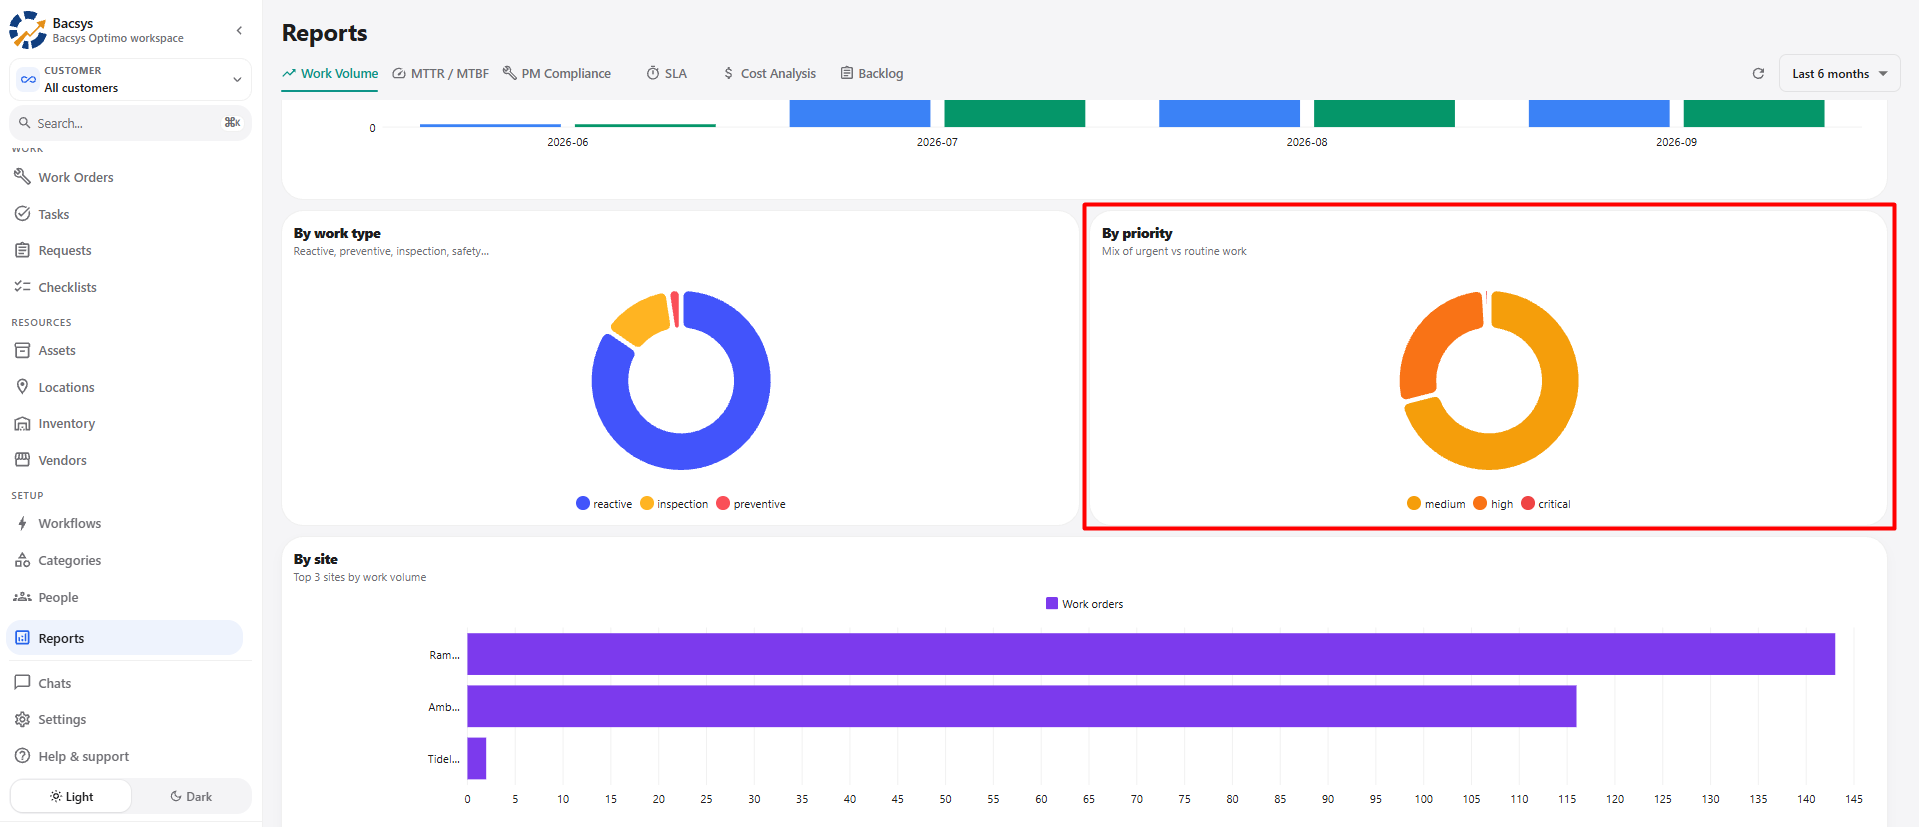
| Section | Description |
|---|---|
| By priority | Displays the distribution of work orders according to priority. |
| Medium | Displays medium-priority work orders. |
| High | Displays high-priority work orders. |
| Critical | Displays critical-priority work orders. |
2.5 Work Orders by Site
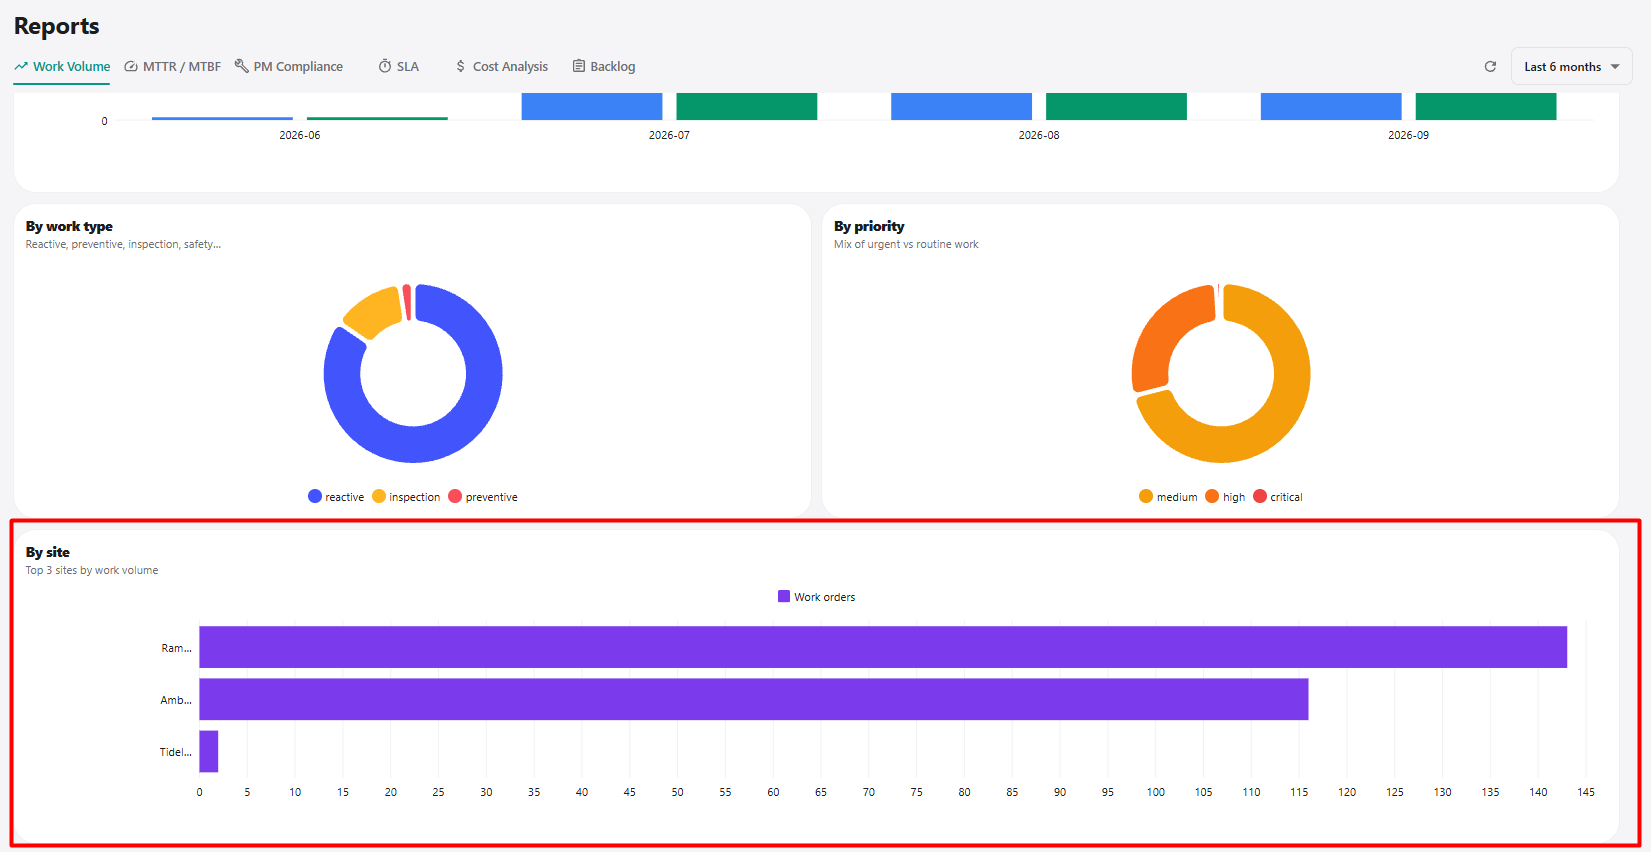
| Section | Description |
|---|---|
| By site | Displays work order volume by site. |
| Work orders | Represents the number of work orders associated with each site. |
| Top sites | Displays the sites with the highest work order volume. |
3. MTTR / MTBF
The MTTR / MTBF report provides maintenance performance information related to repair time and equipment failure frequency.
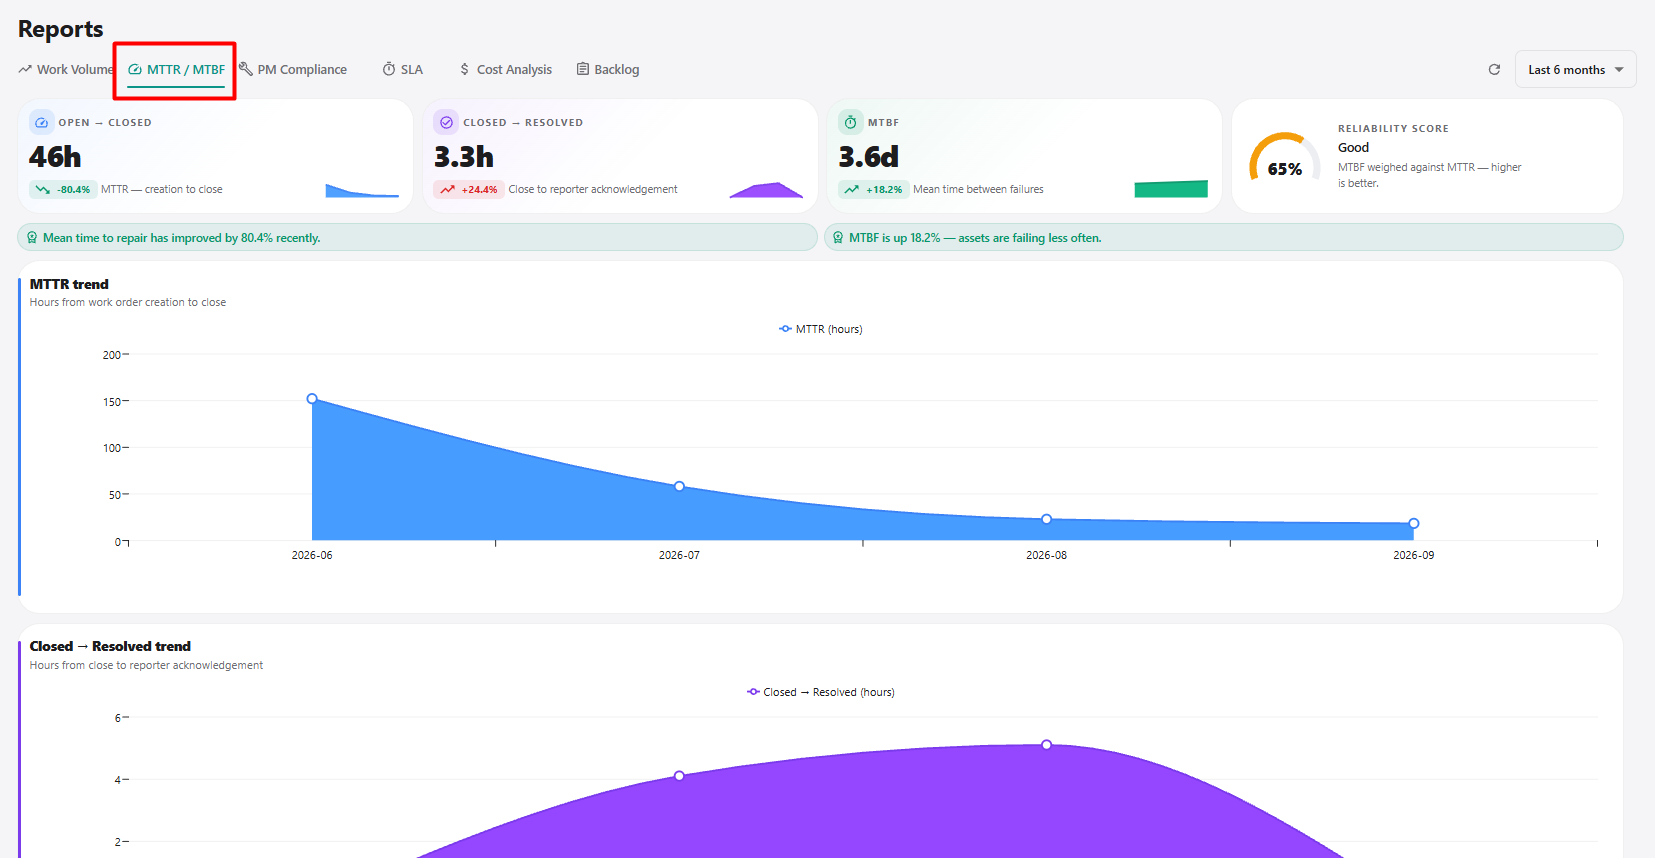
3.1 MTTR / MTBF Summary
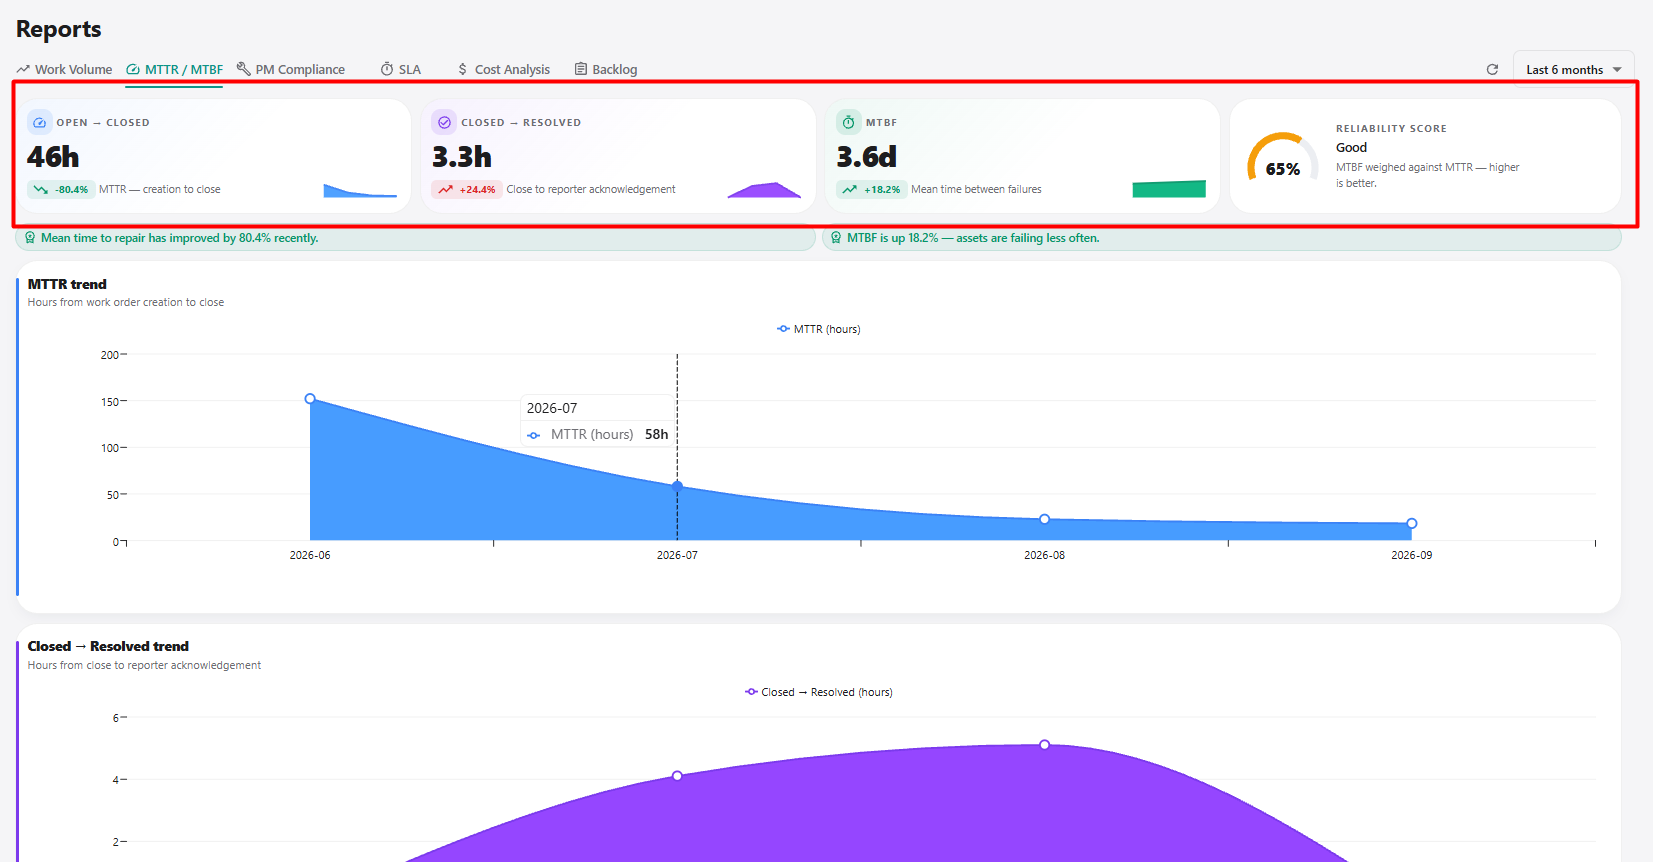
| Metric | Description |
|---|---|
| Open → Closed | Displays the average time taken from work order creation/opening until the work order is closed. |
| Closed → Resolved | Displays the average time from work order closure until reporter acknowledgement or resolution. |
| MTBF | Displays the Mean Time Between Failures for assets. |
| Reliability Score | Displays the calculated reliability indicator based on the available maintenance data. |
3.2 MTTR Trend
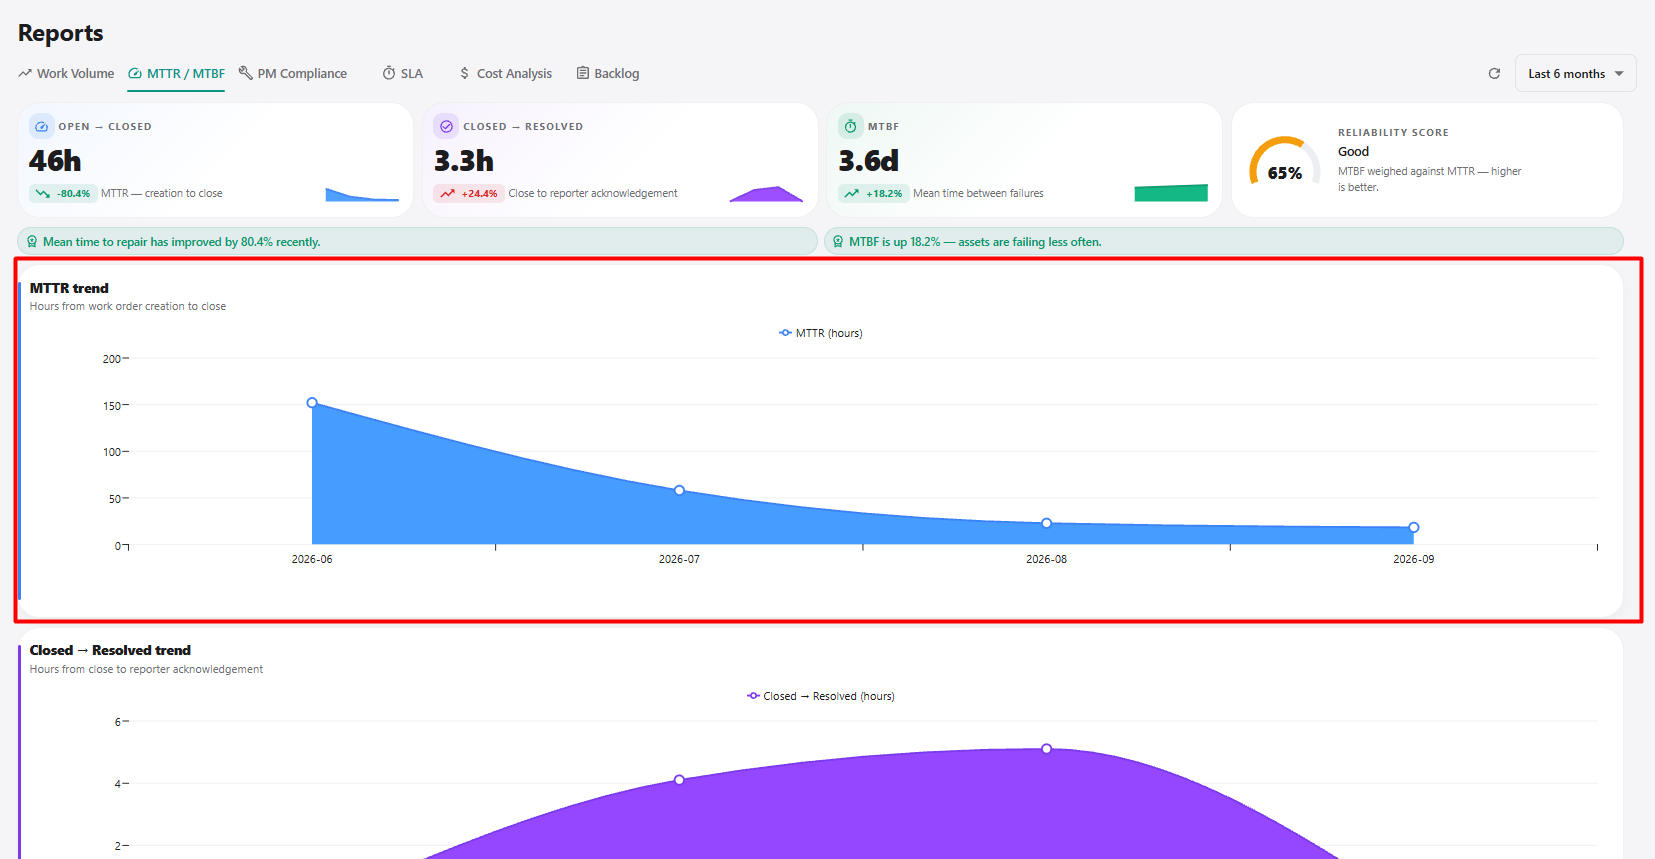
| Section | Description |
|---|---|
| MTTR trend | Displays the change in Mean Time to Repair over the selected period. |
| MTTR (hours) | Represents the repair time measured in hours. |
| Monthly trend | Allows MTTR performance to be compared across months. |
3.3 Closed → Resolved Trend
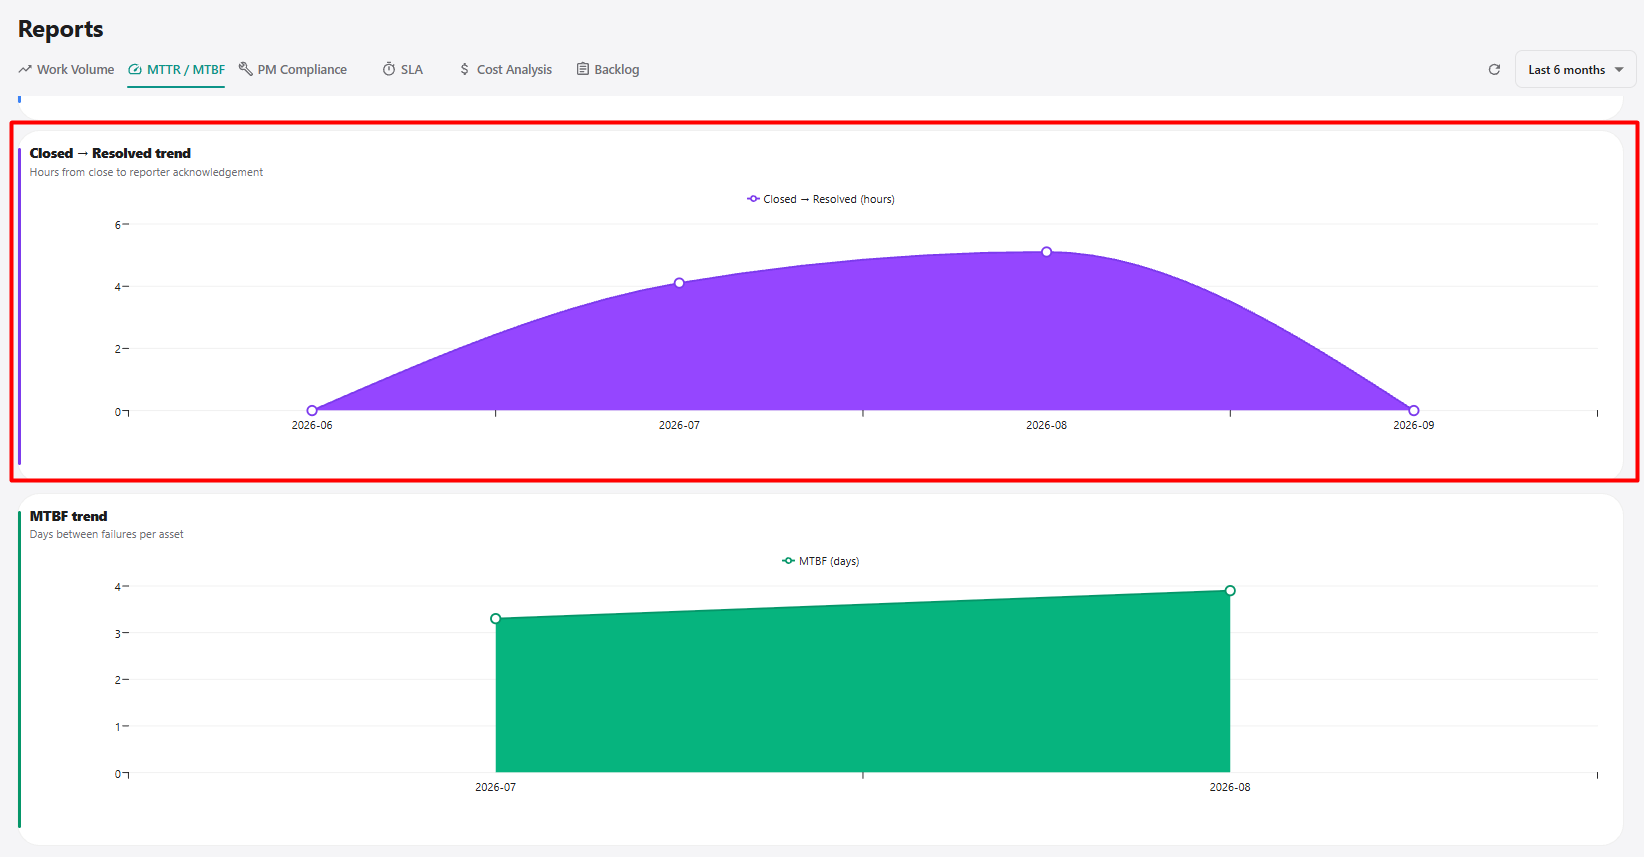
| Section | Description |
|---|---|
| Closed → Resolved trend | Displays the time taken from work order closure to reporter acknowledgement or resolution. |
| Closed → Resolved (hours) | Represents the duration in hours. |
| Monthly trend | Displays how the resolution time changes over the selected period. |
3.4 MTBF Trend
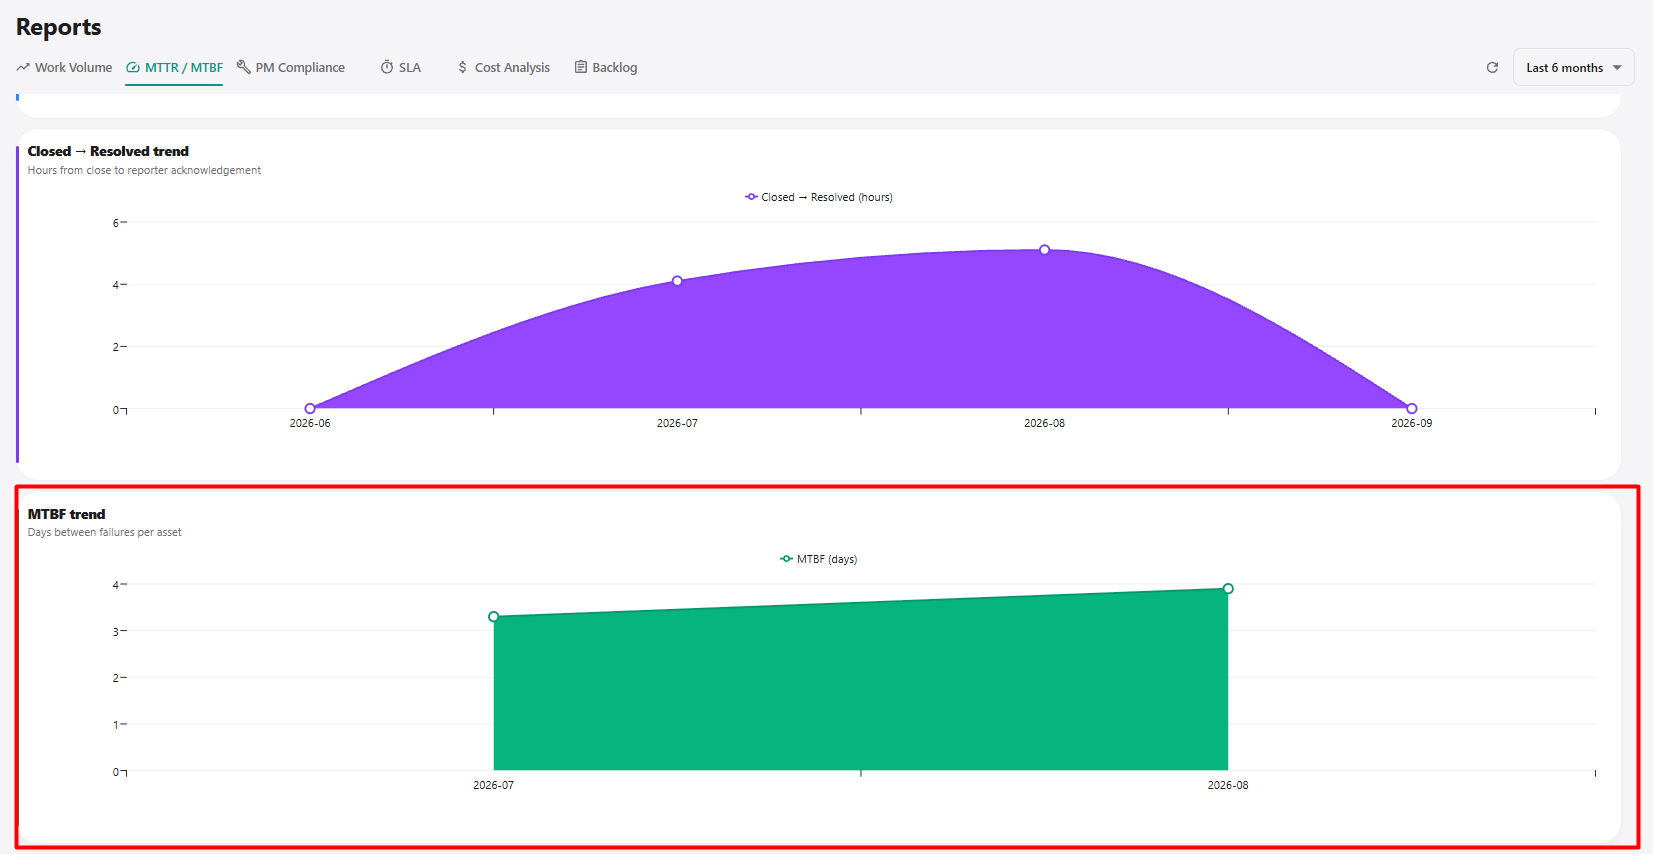
| Section | Description |
|---|---|
| MTBF trend | Displays the change in Mean Time Between Failures. |
| MTBF (days) | Represents the average number of days between failures. |
| Asset reliability | Provides an indication of how frequently assets are experiencing failures. |
4. PM Compliance
The PM Compliance report provides information about preventive maintenance work orders and whether they are completed on time.
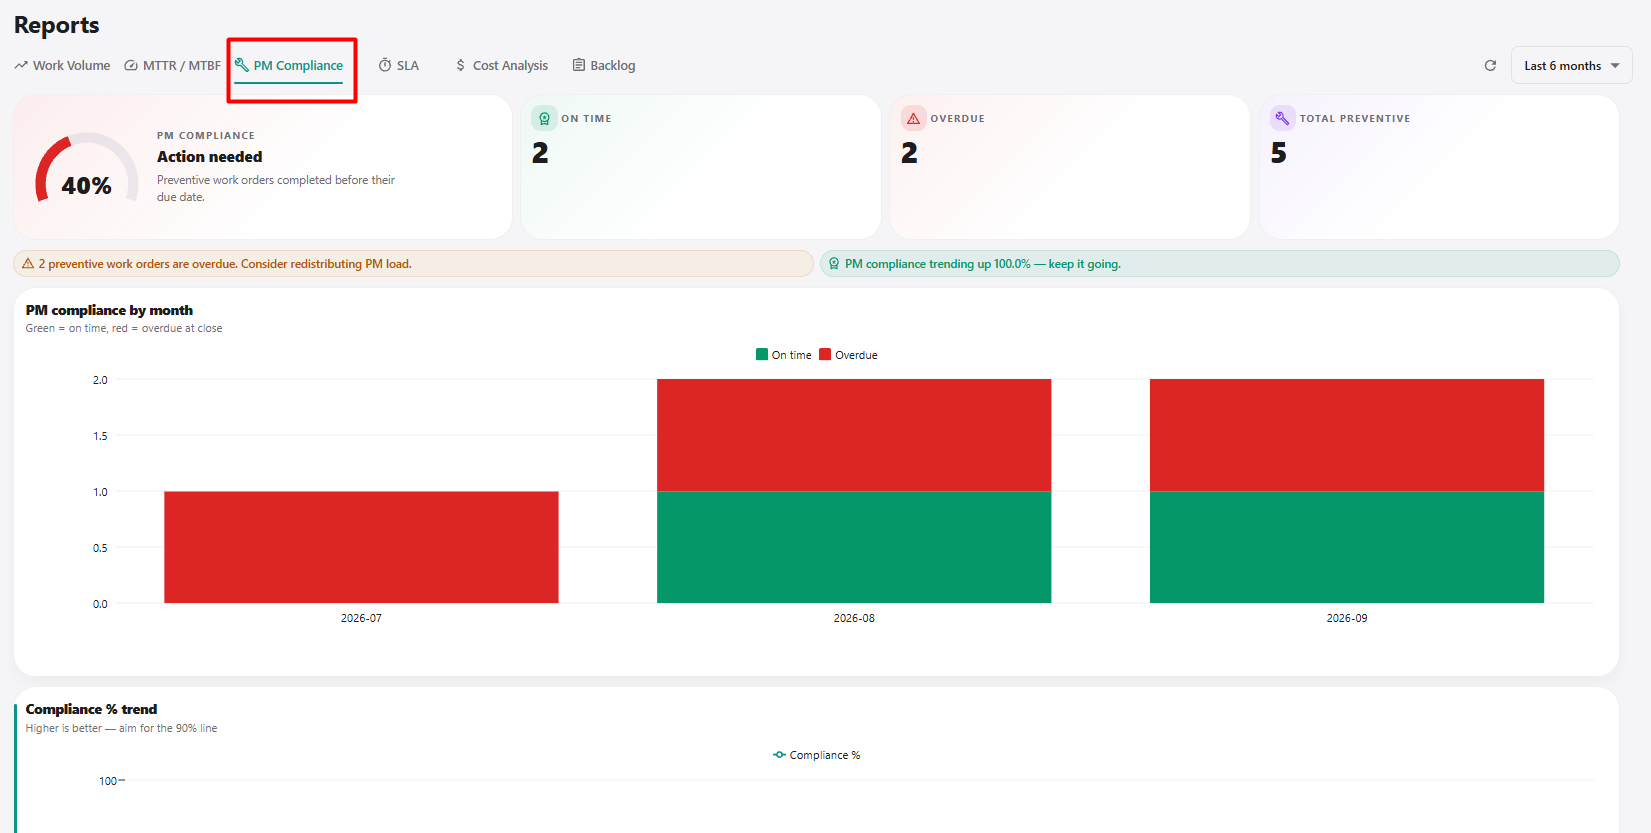
4.1 PM Compliance Summary
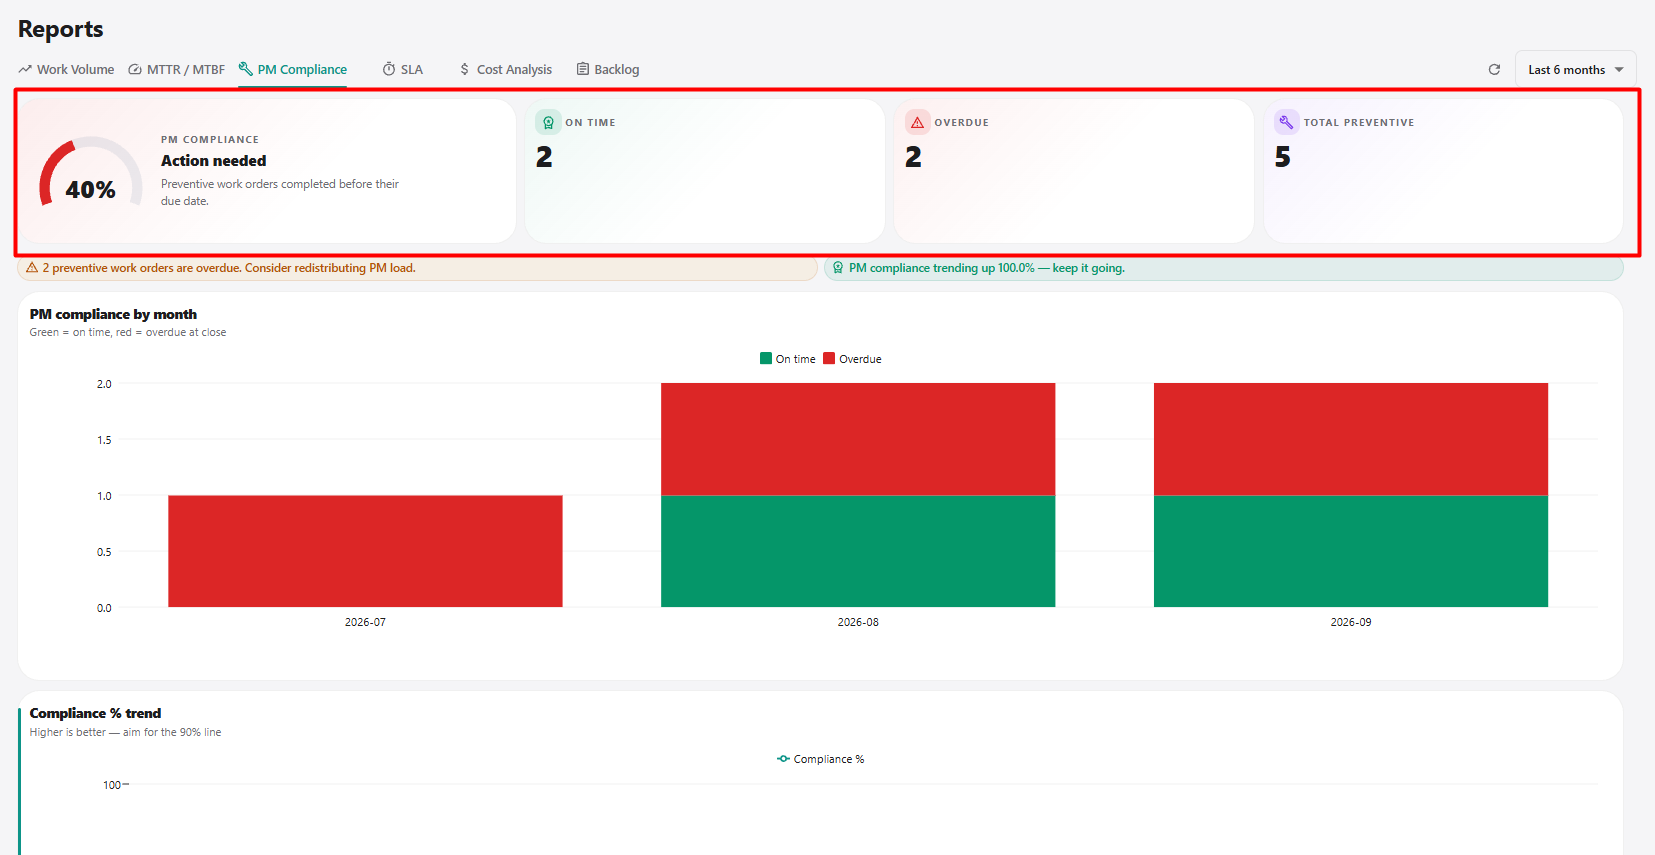
| Metric | Description |
|---|---|
| PM Compliance | Displays the overall preventive maintenance compliance percentage. |
| On Time | Displays the number of preventive work orders completed on time. |
| Overdue | Displays the number of preventive work orders that are overdue. |
| Total Preventive | Displays the total number of preventive maintenance work orders. |
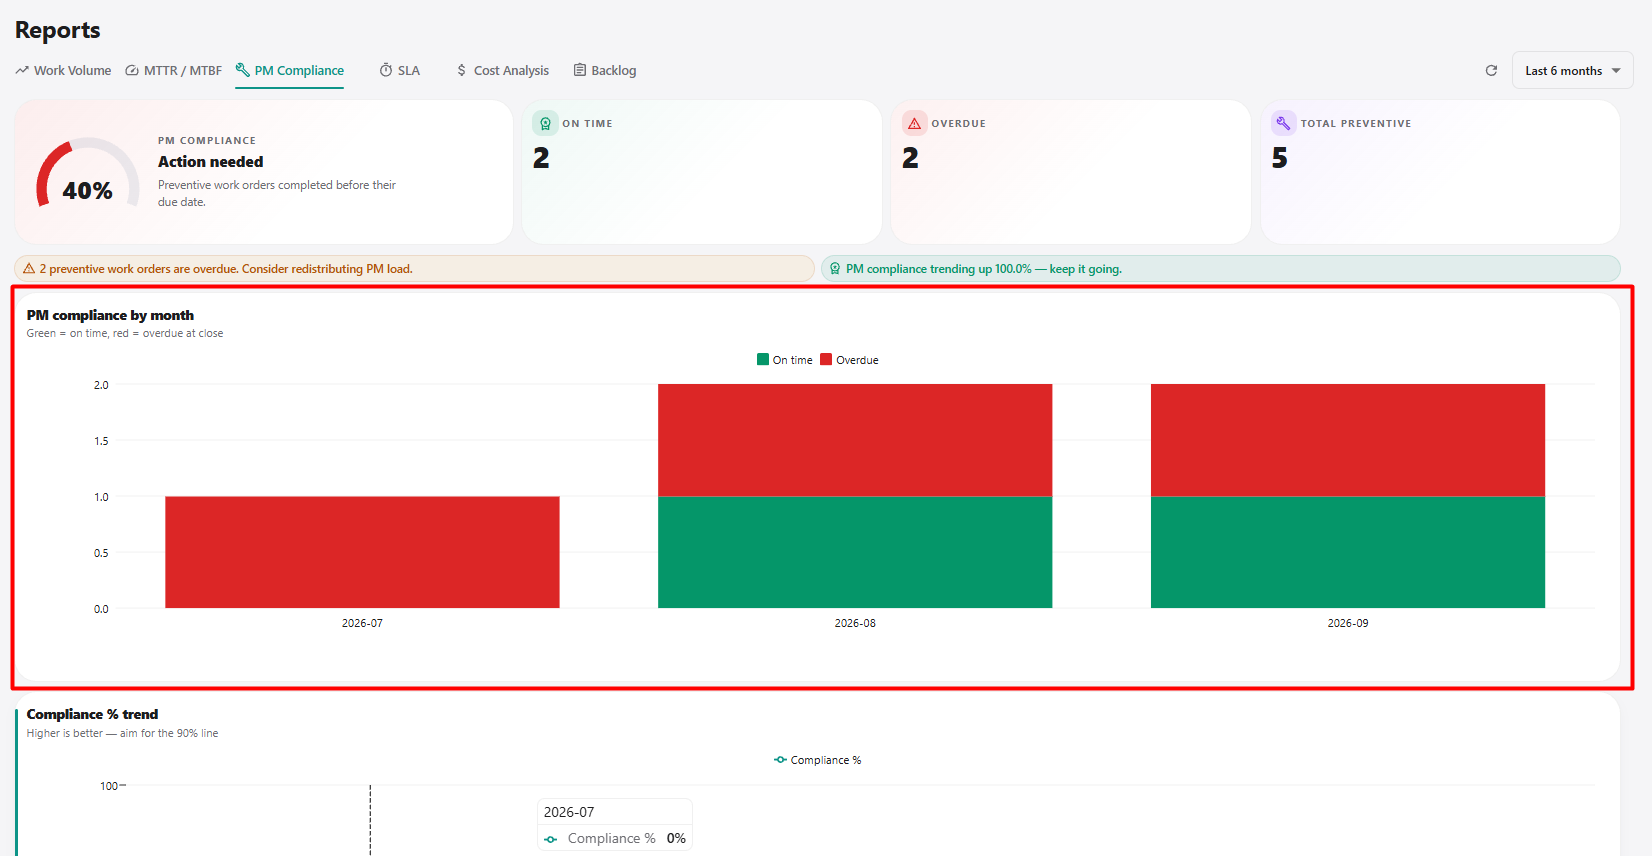
4.2 PM Compliance by Month
| Section | Description |
|---|---|
| PM compliance by month | Displays preventive maintenance performance for each month. |
| On time | Represents preventive work orders completed by their due date. |
| Overdue | Represents preventive work orders completed after their due date or remaining overdue. |
| Monthly comparison | Allows on-time and overdue preventive work to be compared across months. |
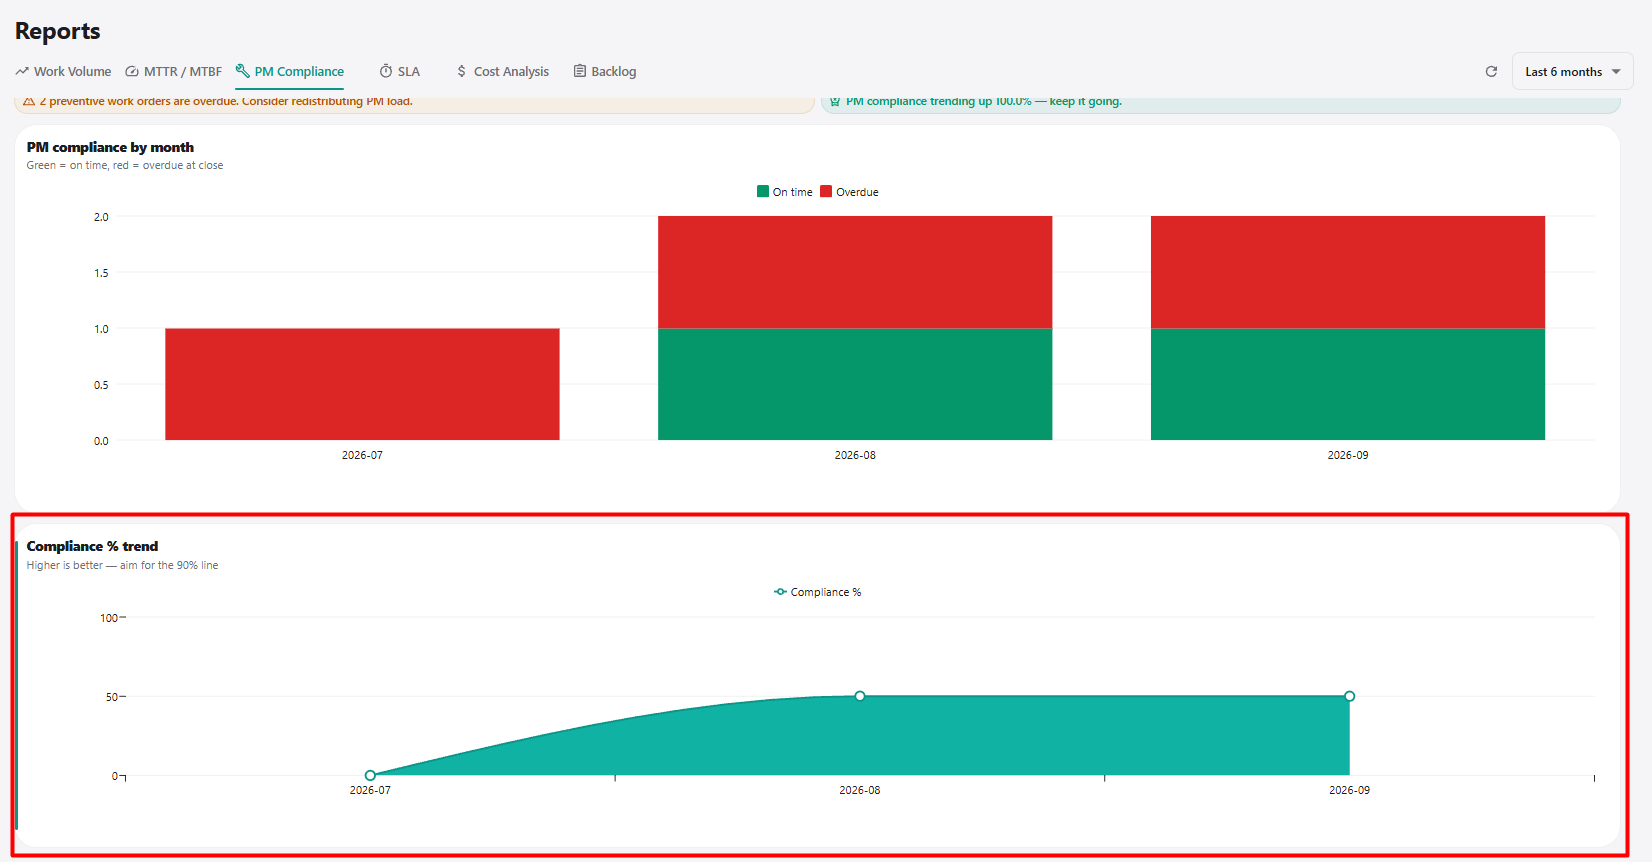
4.3 Compliance % Trend
| Section | Description |
|---|---|
| Compliance % trend | Displays the preventive maintenance compliance percentage over time. |
| Compliance % | Represents the percentage of preventive maintenance work completed according to the expected schedule. |
| Trend | Shows how PM compliance changes during the selected reporting period. |
5. SLA
The SLA report provides information about response and resolution performance against configured Service Level Agreements.
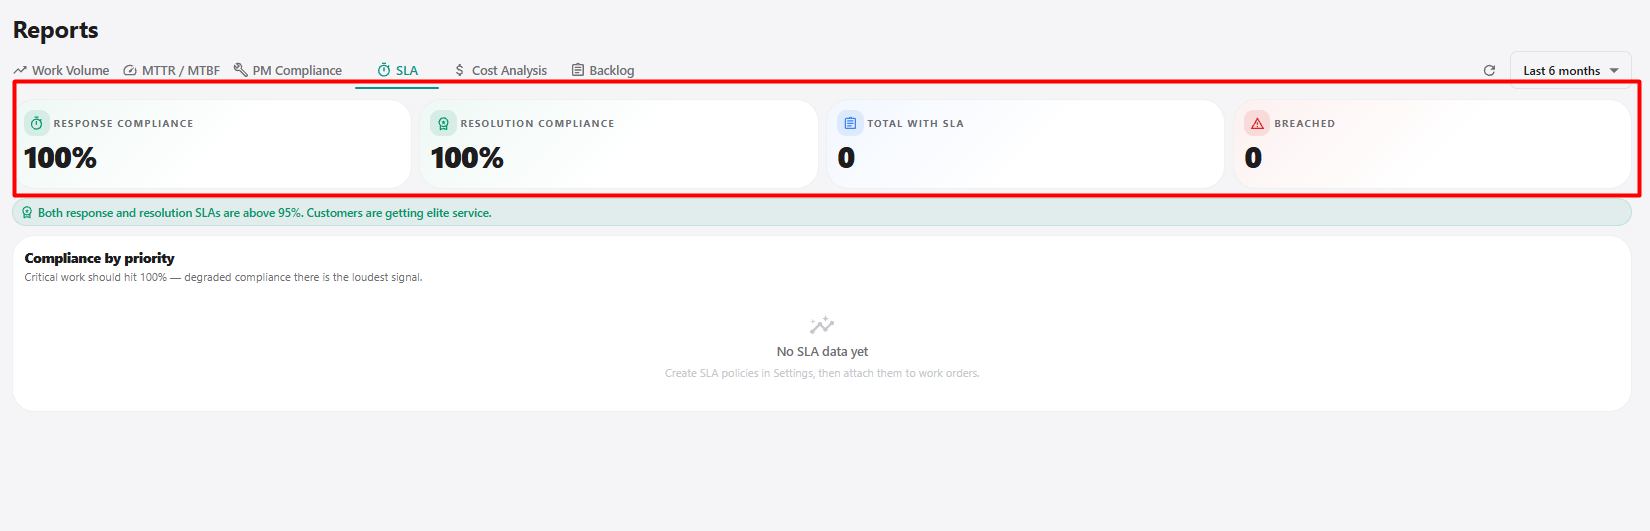
5.1 SLA Summary
| Metric | Description |
|---|---|
| Response Compliance | Displays the percentage of work orders meeting the configured response SLA. |
| Resolution Compliance | Displays the percentage of work orders meeting the configured resolution SLA. |
| Total with SLA | Displays the total number of work orders associated with an SLA. |
| Breached | Displays the number of work orders that exceeded the configured SLA. |
5.2 Compliance by Priority
| Section | Description |
|---|---|
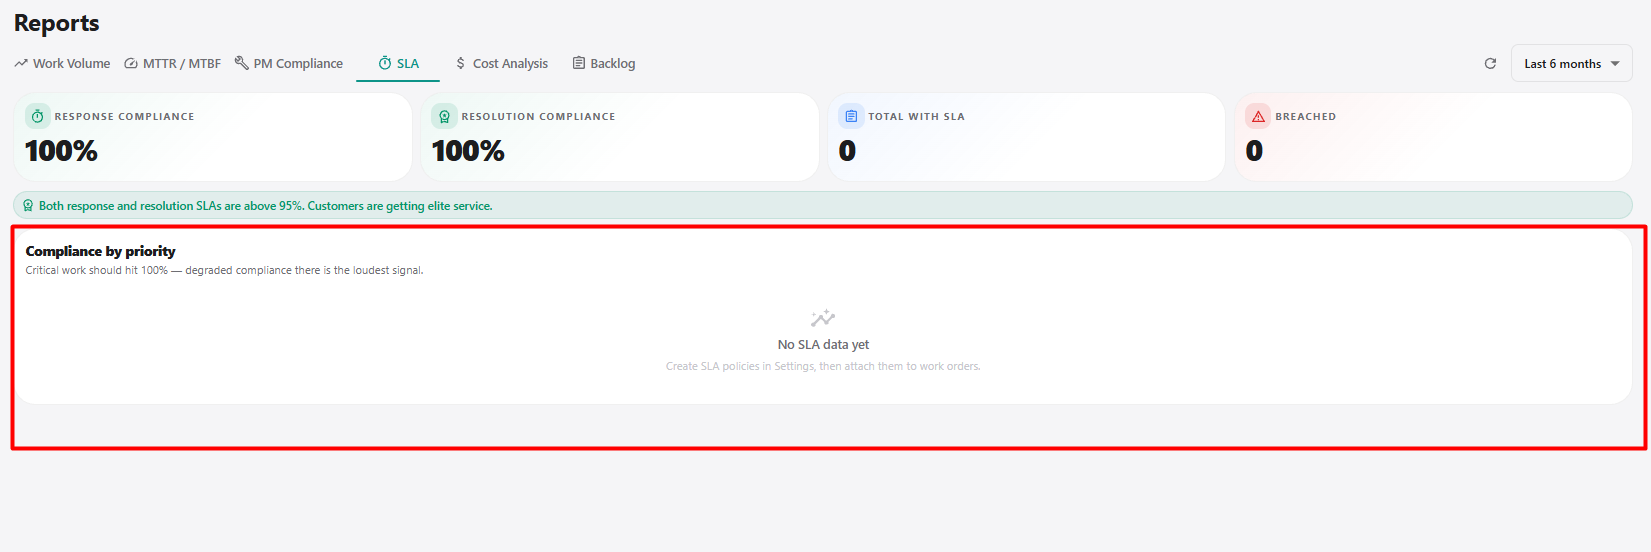
| Compliance by priority | Displays SLA compliance according to work order priority. |
| Critical | Displays SLA information for critical-priority work. |
| High | Displays SLA information for high-priority work. |
| Medium | Displays SLA information for medium-priority work. |
| No SLA data | Indicates that there is no applicable SLA data available for the selected period or priority. |
6. Cost Analysis
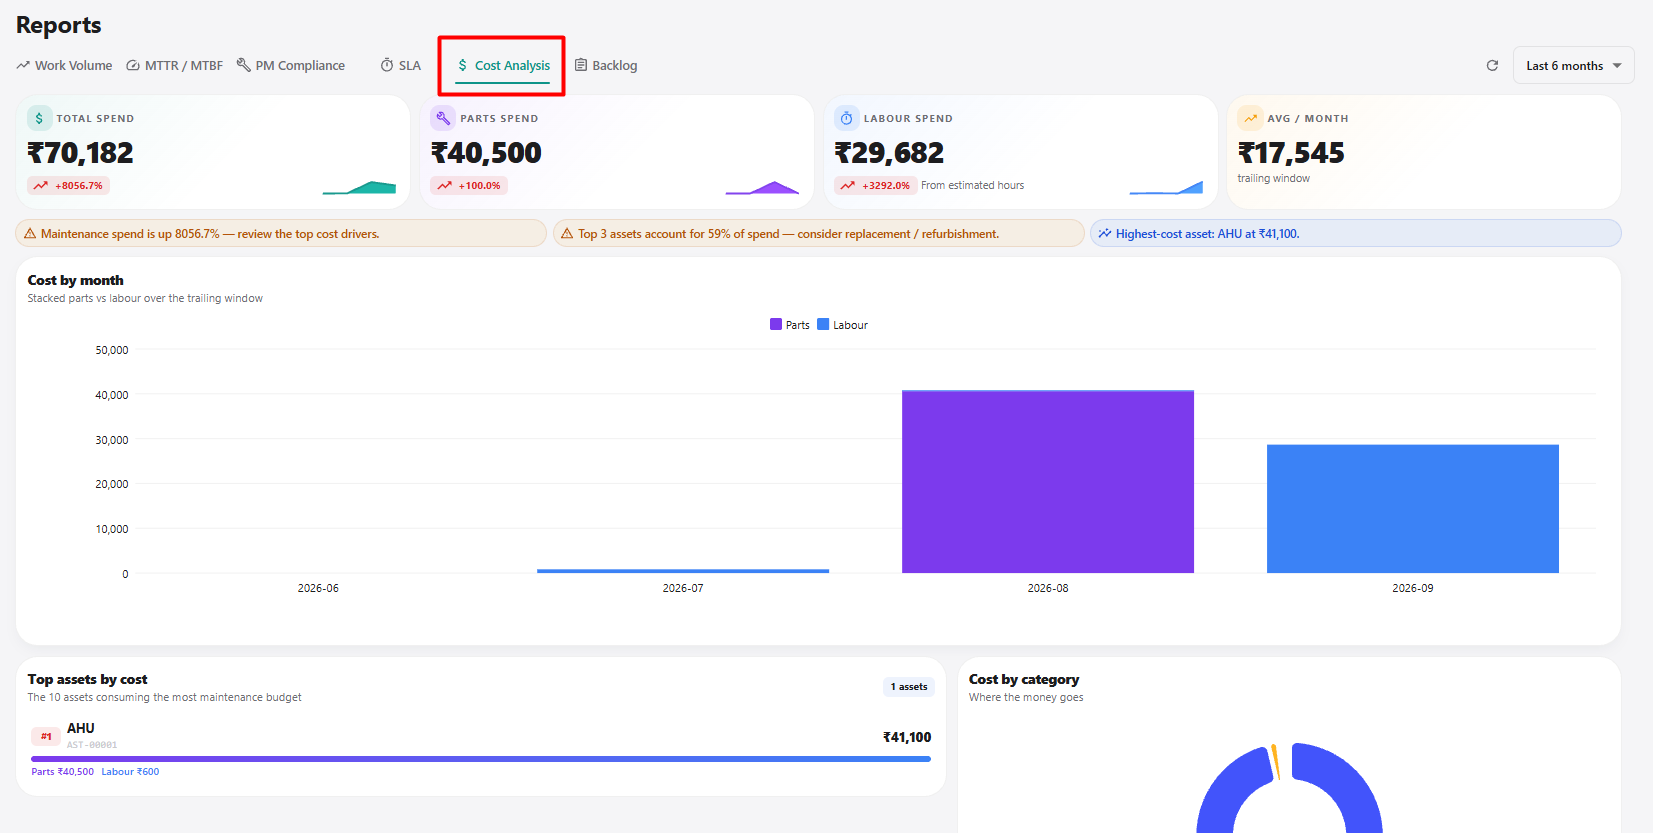
The Cost Analysis report provides an overview of maintenance spending and cost distribution.
6.1 Cost Summary
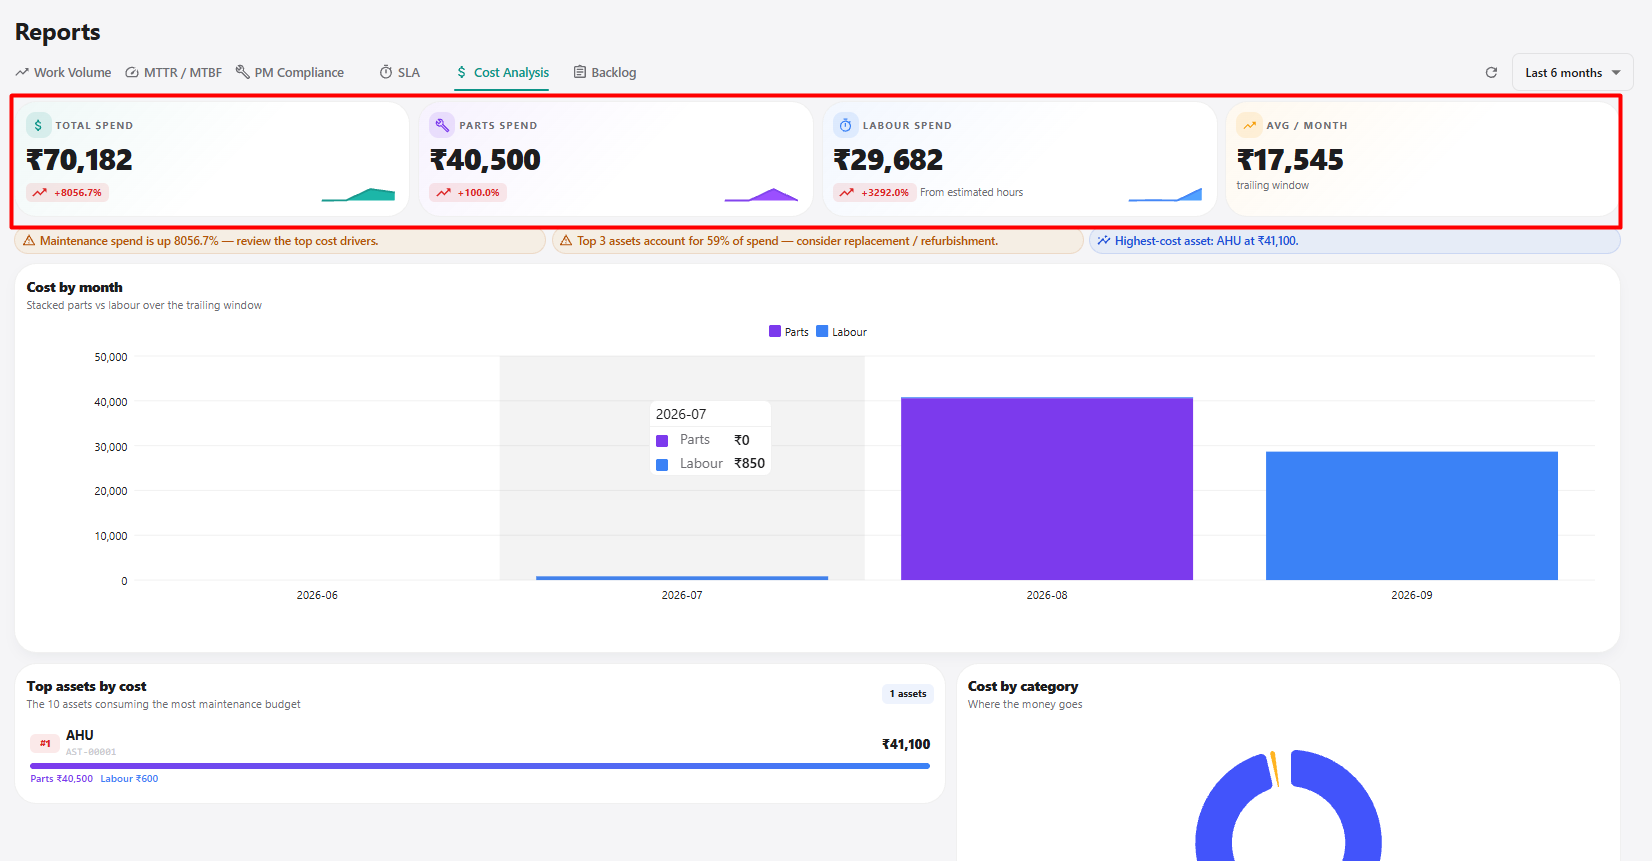
| Metric | Description |
|---|---|
| Total Spend | Displays the total maintenance spending during the selected period. |
| Parts Spend | Displays the amount spent on maintenance parts. |
| Labour Spend | Displays the labour cost associated with maintenance activities. |
| Avg / Month | Displays the average maintenance spending per month for the selected reporting period. |
6.2 Cost Insights
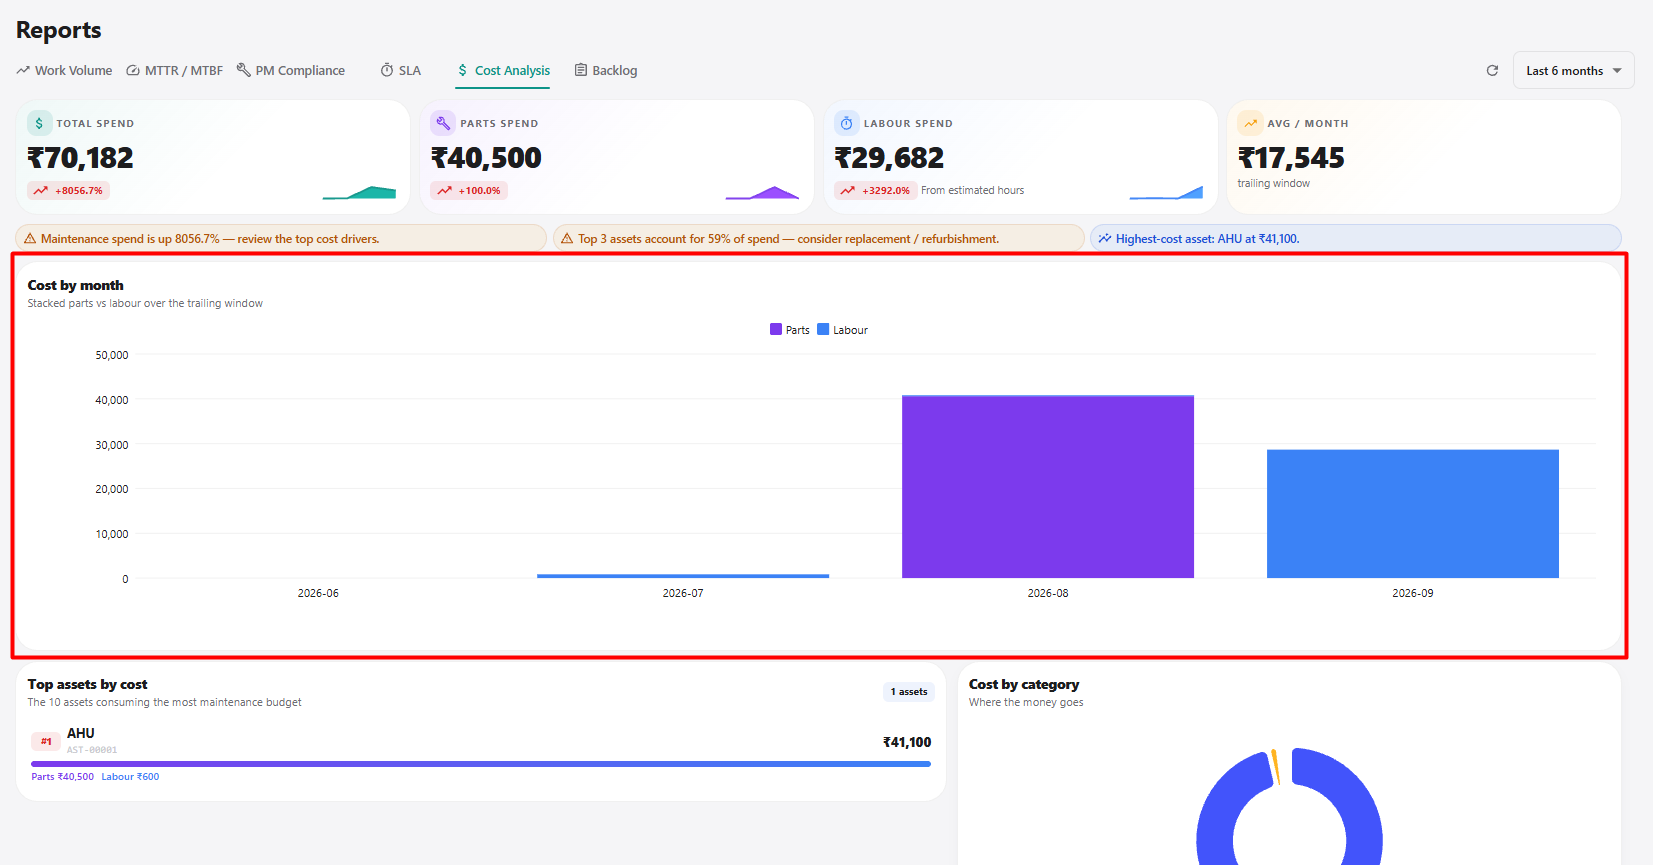
| Section | Description |
|---|---|
| Maintenance spend | Highlights changes or significant increases in maintenance spending. |
| Top assets by spend | Identifies assets contributing the highest maintenance cost. |
| Highest-cost asset | Displays the asset with the highest recorded maintenance cost. |
6.3 Cost by Month
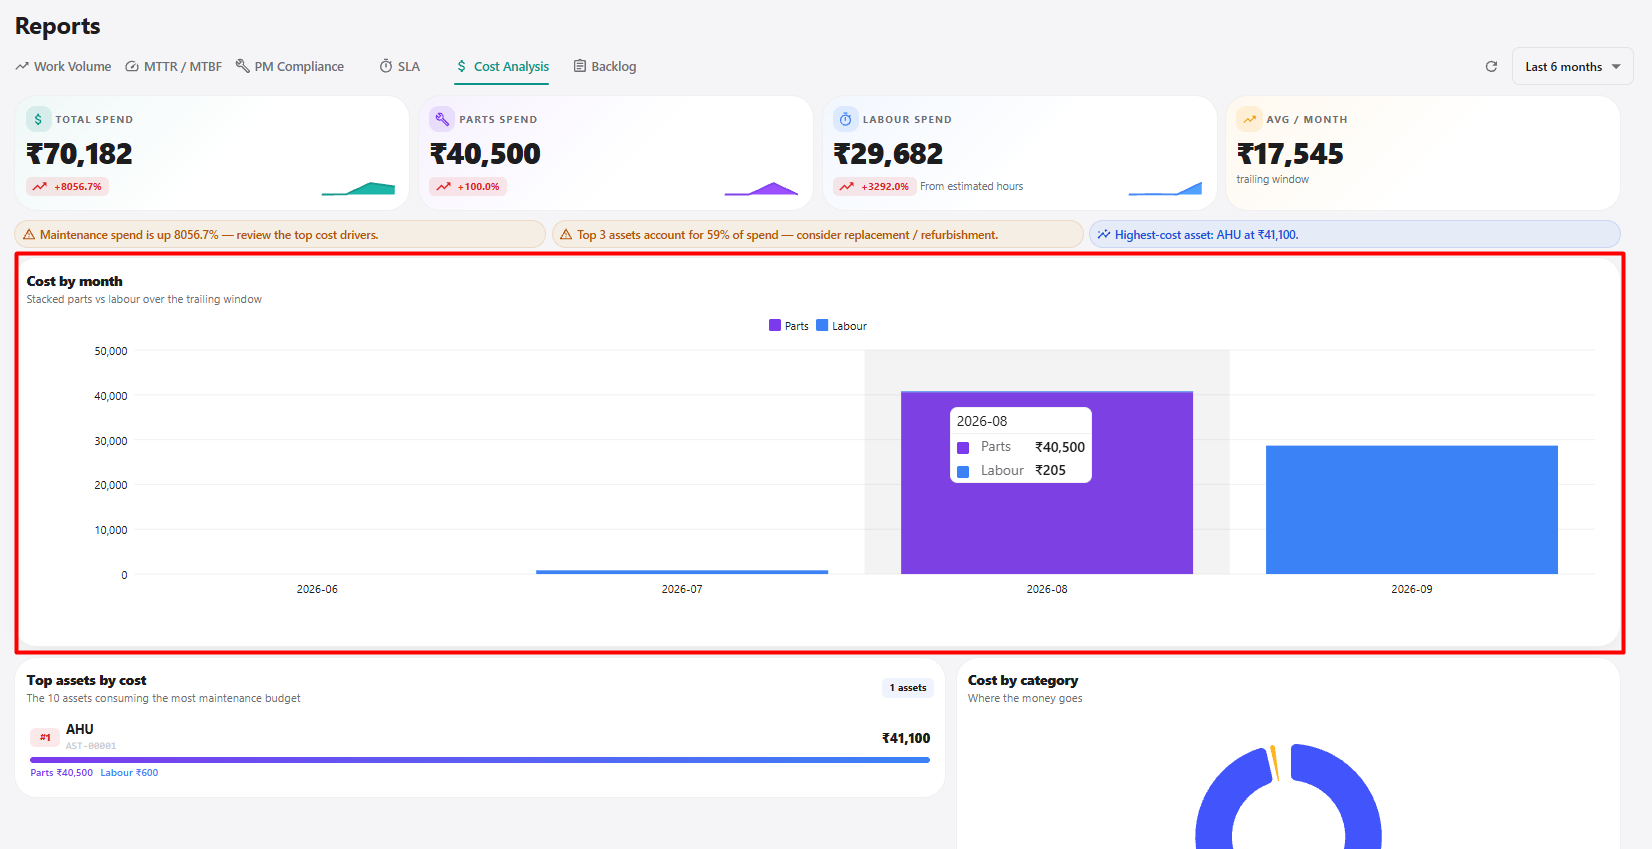
| Section | Description |
|---|---|
| Cost by month | Displays maintenance spending for each month. |
| Parts | Represents parts-related maintenance costs. |
| Labour | Represents labour-related maintenance costs. |
| Monthly comparison | Allows parts and labour spending to be compared across months. |
6.4 Top Assets by Cost
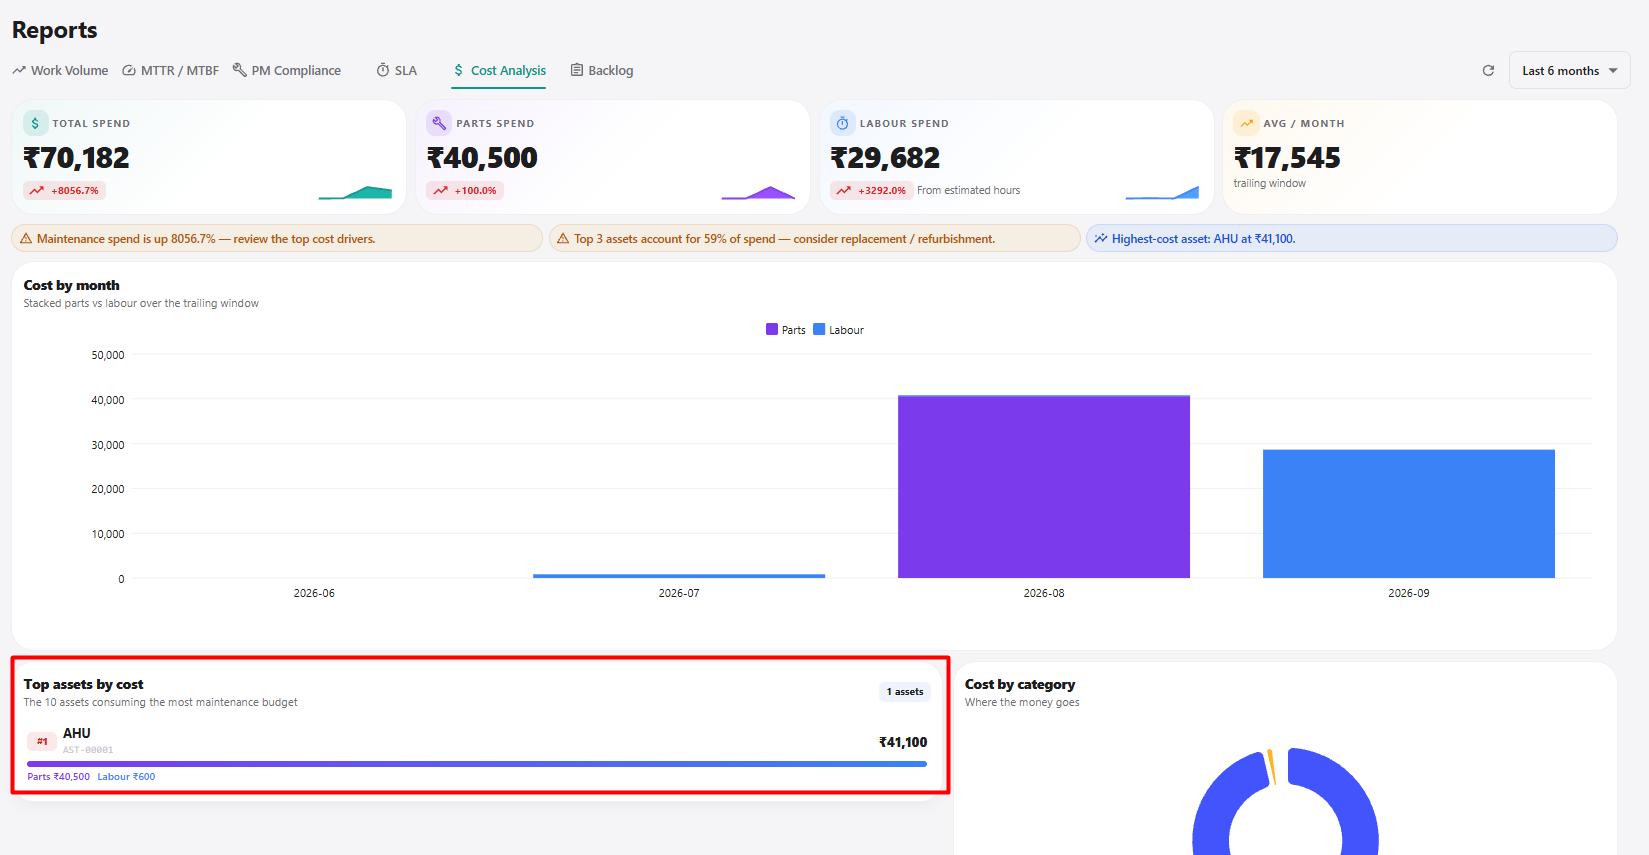
| Section | Description |
|---|---|
| Top assets by cost | Displays the assets with the highest maintenance spending. |
| Asset | Displays the asset contributing to the maintenance cost. |
| Parts | Displays the parts cost associated with the asset. |
| Labour | Displays the labour cost associated with the asset. |
| Total cost | Displays the combined maintenance cost for the asset. |
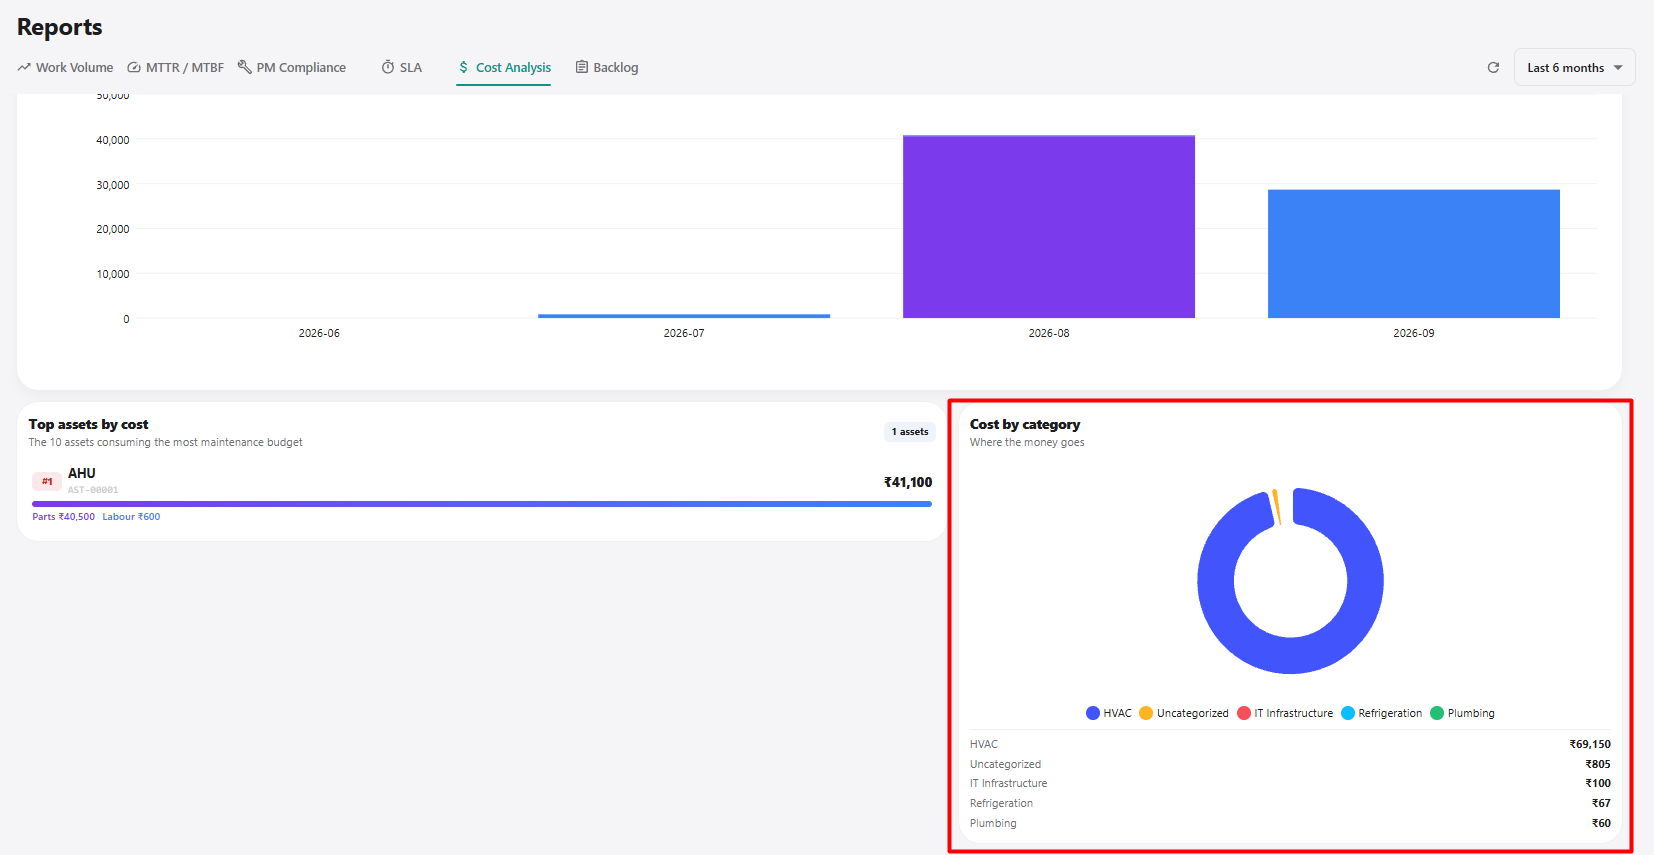
6.5 Cost by Category
| Section | Description |
|---|---|
| Cost by category | Displays maintenance spending according to asset category. |
| Category | Displays the category associated with the maintenance cost. |
| Category spend | Displays the total maintenance cost for the category. |
7. Backlog
The Backlog report provides information about open work orders and how long they have remained unresolved.
7.1 Backlog Summary
| Metric | Description |
|---|---|
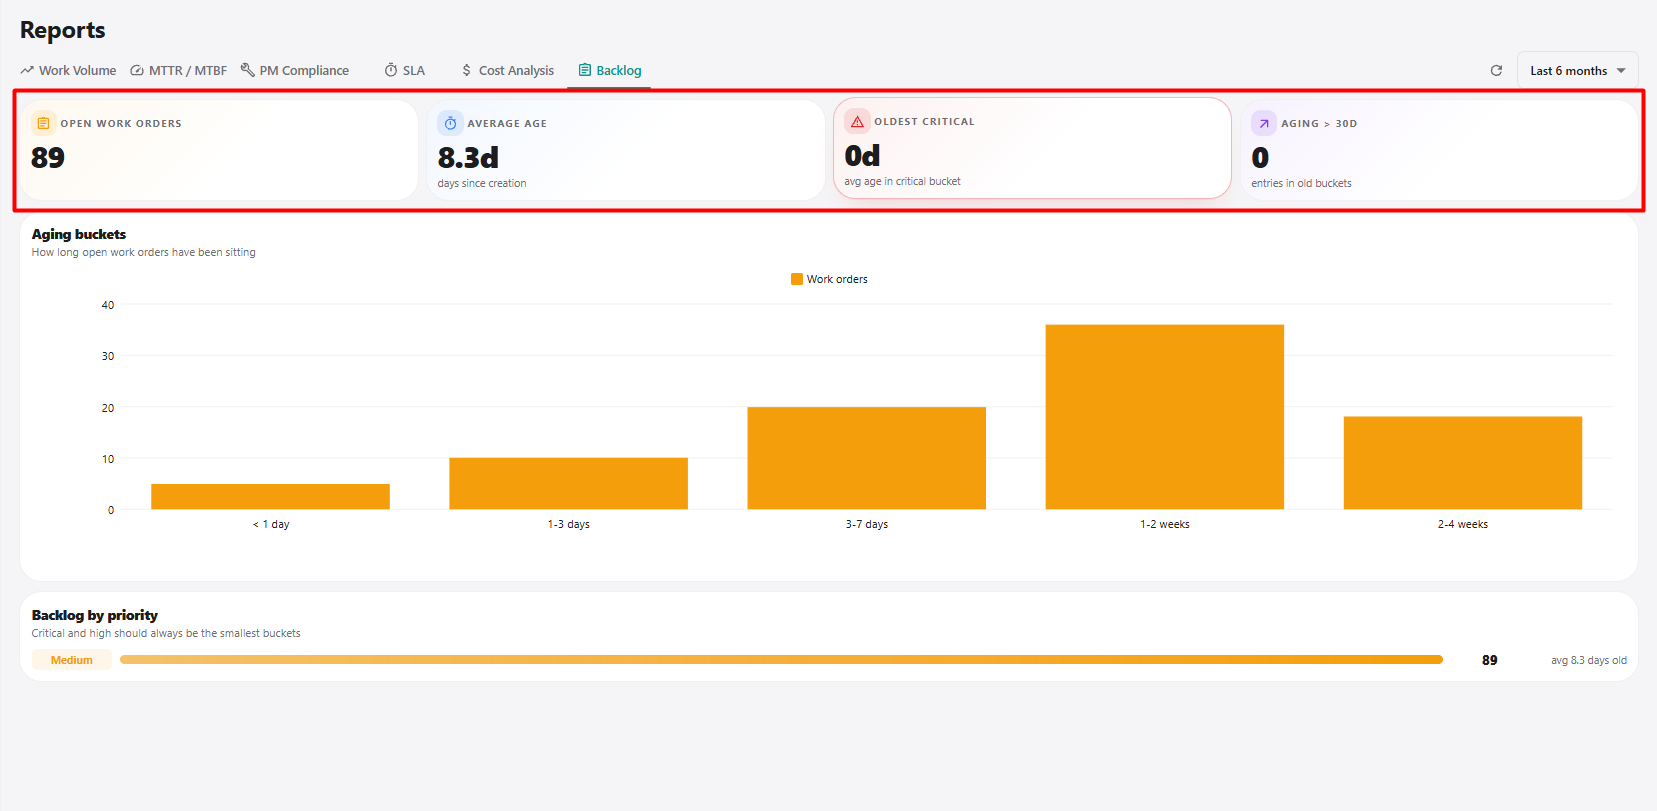
| Open Work Orders | Displays the total number of currently open work orders. |
| Average Age | Displays the average number of days since the open work orders were created. |
| Oldest Critical | Displays the age of the oldest critical work order in the backlog. |
| Aging > 30d | Displays the number of work orders that have remained open for more than 30 days. |
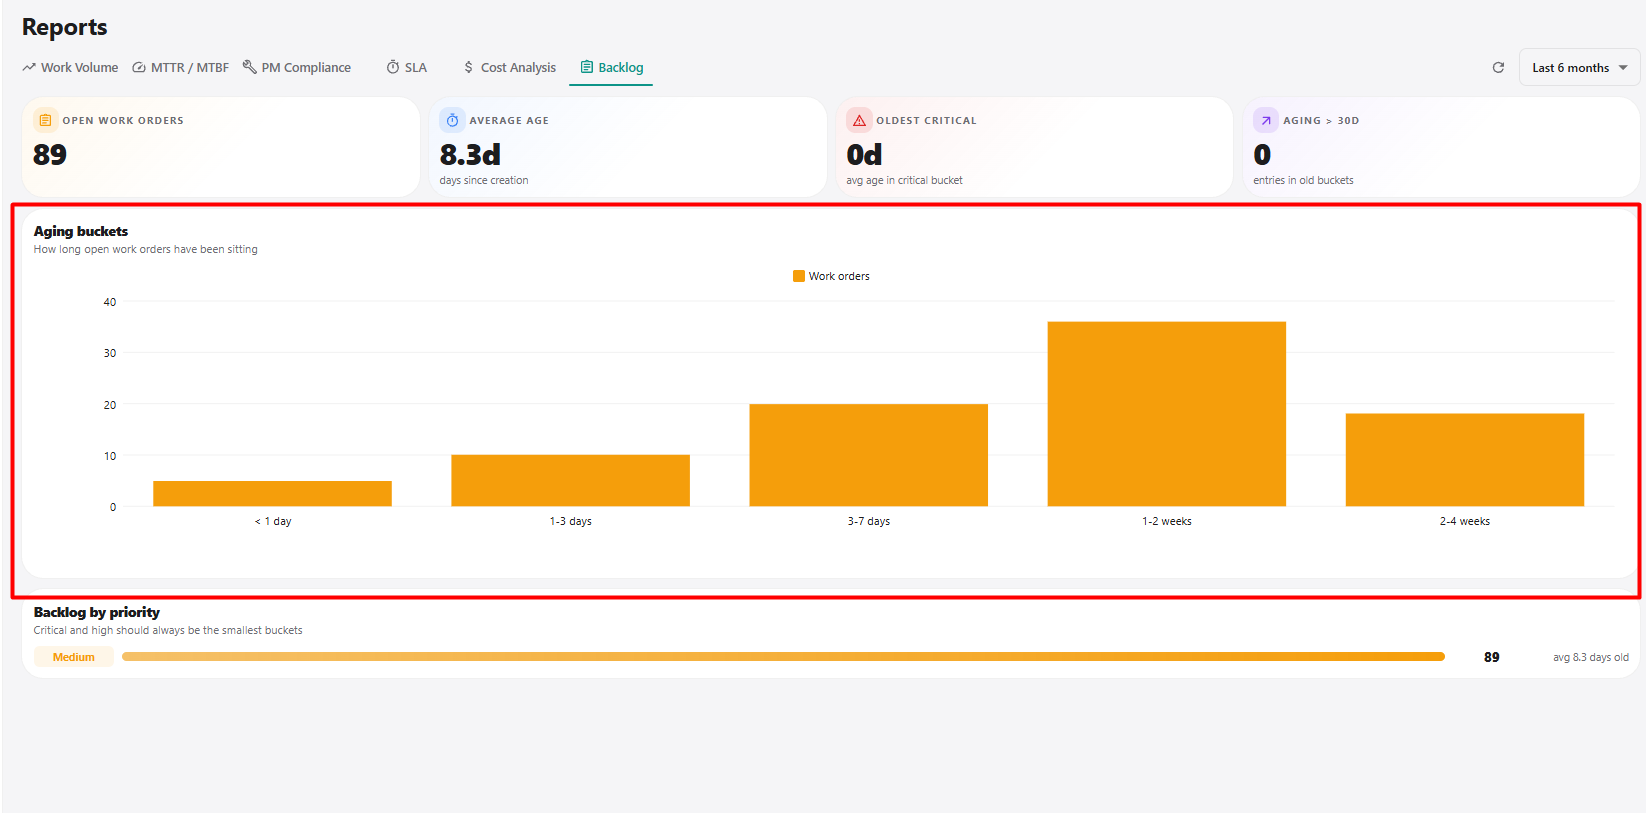
7.2 Aging Buckets
| Aging Bucket | Description |
|---|---|
| < 1 day | Work orders that have been open for less than one day. |
| 1–3 days | Work orders that have been open between one and three days. |
| 3–7 days | Work orders that have been open between three and seven days. |
| 1–2 weeks | Work orders that have been open between one and two weeks. |
| 2–4 weeks | Work orders that have been open between two and four weeks. |
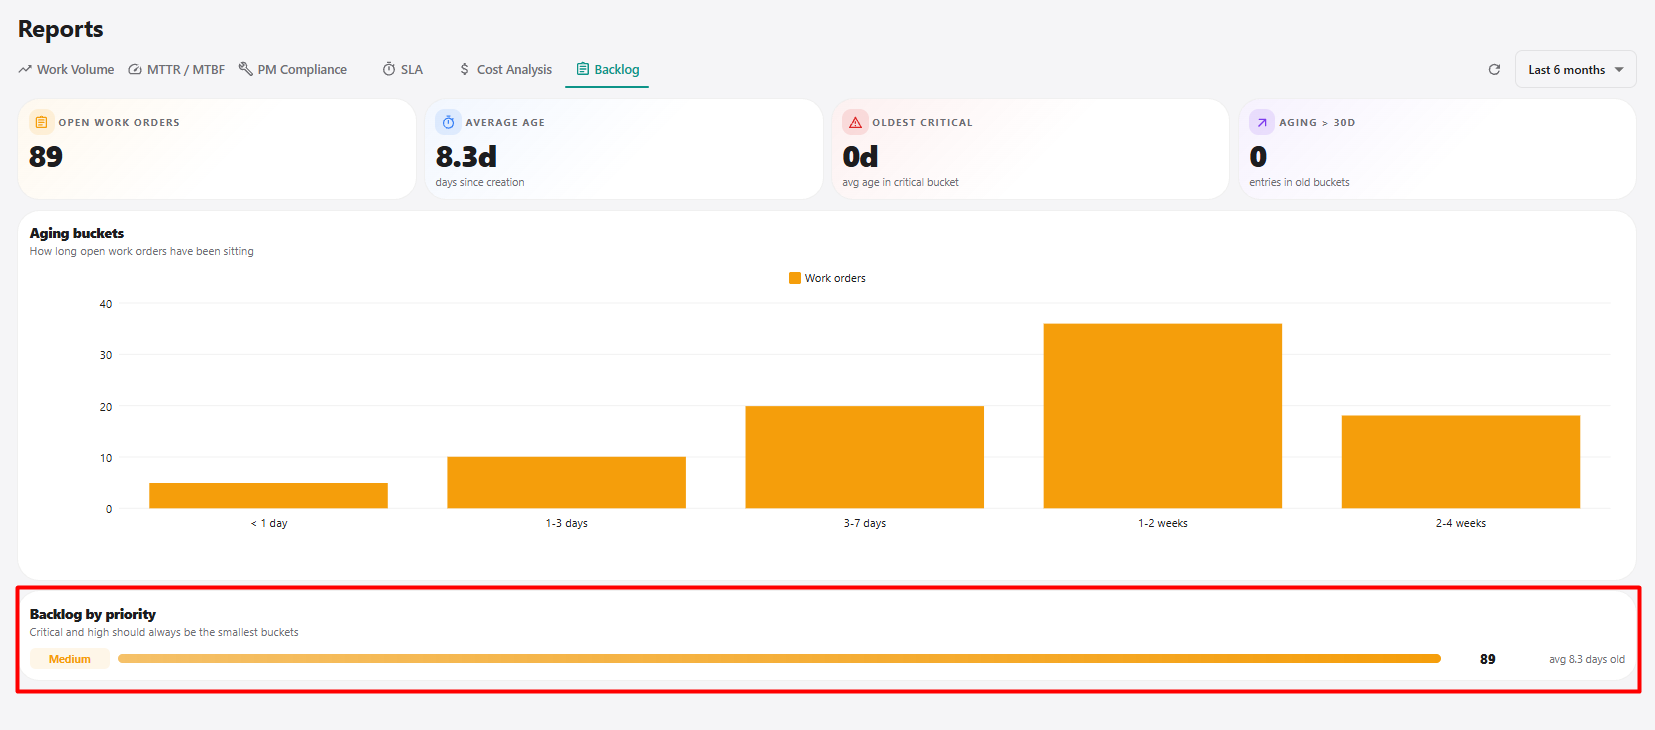
7.3 Backlog by Priority
| Section | Description |
|---|---|
| Backlog by priority | Displays open work orders according to their priority. |
| Priority | Displays the priority assigned to the open work orders. |
| Work orders | Displays the number of open work orders for the selected priority. |
| Average age | Displays the average age of work orders within the priority group. |
8. Report Controls
| Control | Description |
|---|---|
| Refresh | Refreshes the displayed report data. |
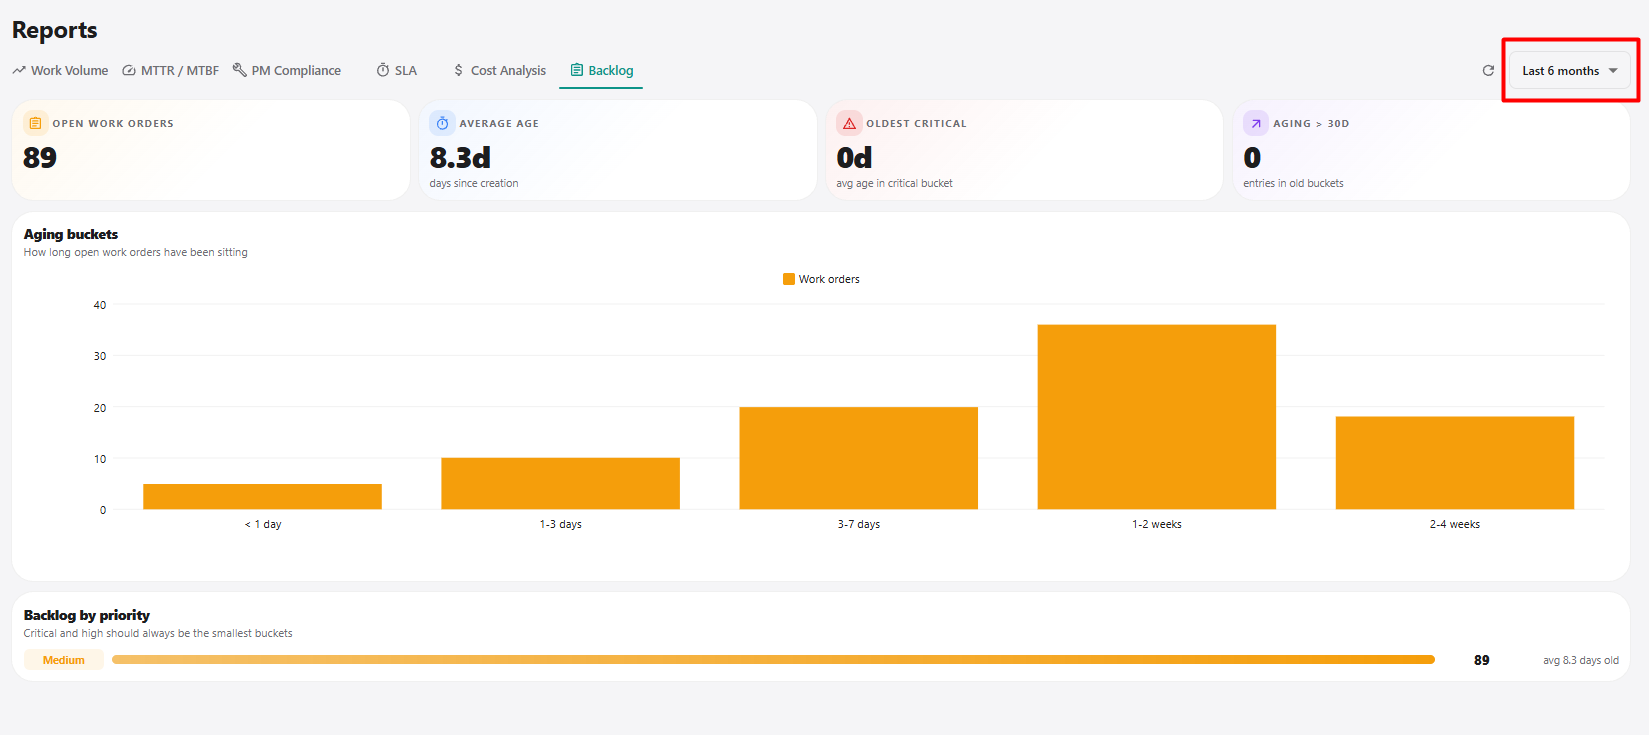
| Last 3 months | Filters the report data to the previous 3 months. |
| Last 6 months | Filters the report data to the previous 6 months. |
| Last 12 months | Filters the report data to the previous 12 months. |
9. Reports Navigation Workflow
| Step | Action |
|---|---|
| 1 | Open the Reports module. |
| 2 | Select the required report category. |
| 3 | Select the required reporting period: Last 3 months, Last 6 months, or Last 12 months. |
| 4 | Review the summary metrics. |
| 5 | Review the available charts and report sections. |
| 6 | Use Refresh when the latest report data is required. |
| 7 | Select another report category when additional maintenance information is required. |