

Configuring BACnet MSTP
The BACnet MSTP network allows the platform to communicate with BACnet MSTP devices over an RS-485 serial communication network.
Creating a BACnet MSTP Network
-
Navigate to the Devices module from the sidebar.
-
Click the + (Add) icon.
-
Drag and drop BACnet MSTP into the Create Network window.
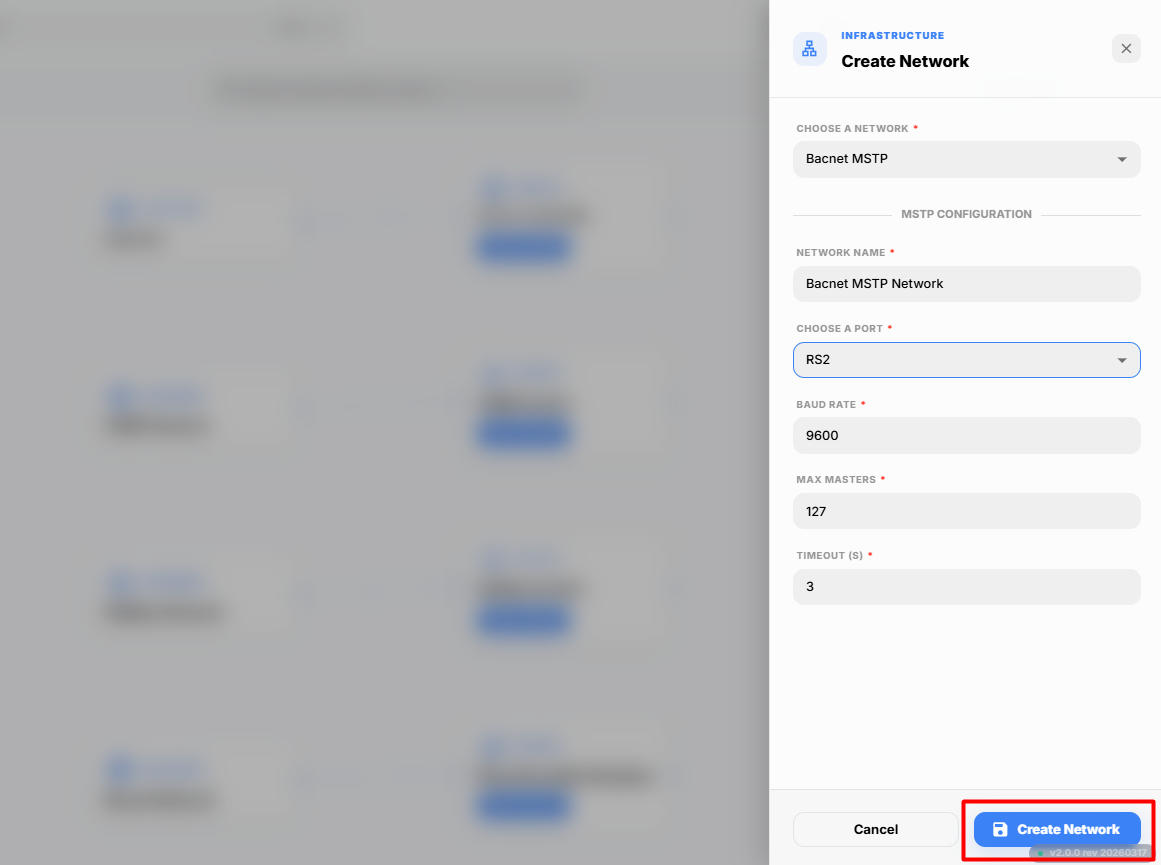
The Create Network dialog box appears.
-
Enter the required network details.
Field Description Network Name Enter a unique name to identify the BACnet MSTP network. Choose a Port Select the serial communication port connected to the BACnet MSTP network. Available ports include RS1, RS2, and RS3. -
After selecting the required port, configure the communication parameters.
Field Description Baud Rate Select the communication speed used by the BACnet MSTP network. The selected baud rate must match the connected device. Max Masters Specify the maximum number of master devices that can communicate on the BACnet MSTP network. Timeout Specify the maximum time the platform waits for a response from a device before considering the request as timed out. -
Review the network configuration.
-
Click Create Network.
The BACnet MSTP network is successfully created and is displayed in the Devices module.
Adding BACnet MSTP Devices
After creating the BACnet MSTP network, you can discover and add the available BACnet MSTP devices.
-
Select the newly created BACnet MSTP network from the Devices module.
-
Click Add Device.
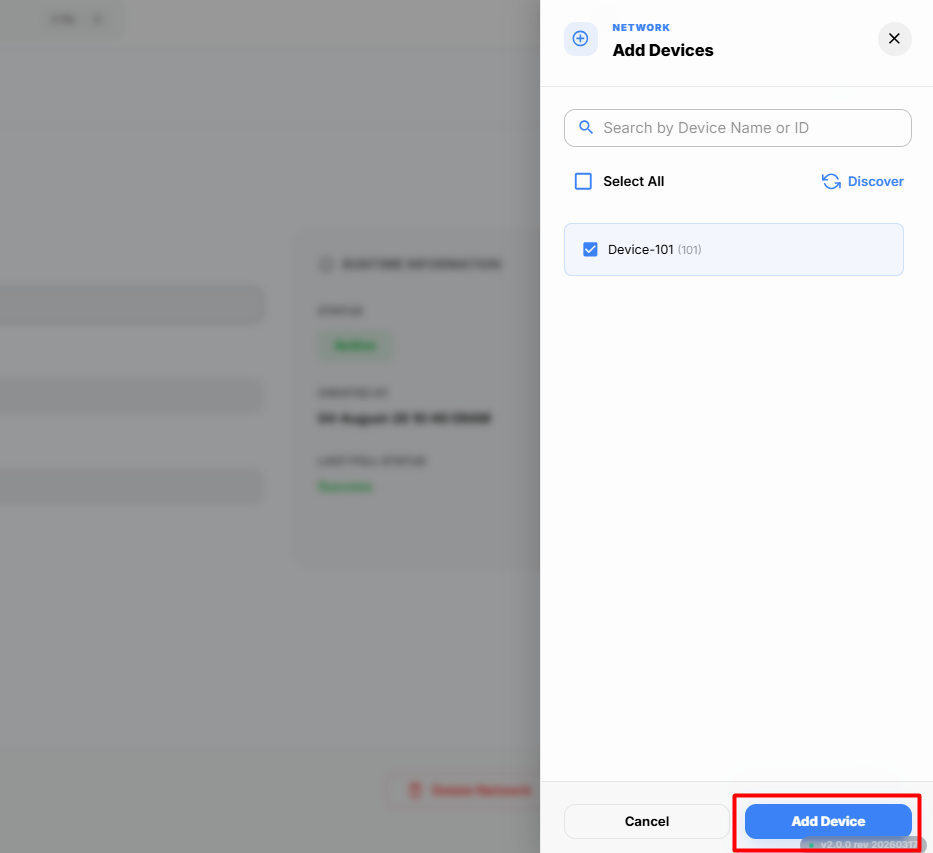
The platform scans the selected BACnet MSTP network and displays all the discovered devices.
-
Review the list of discovered devices.
The dialog box displays all the BACnet MSTP devices available on the selected network.
-
Select one or more devices that you want to add to the network.
You can add a single device or multiple devices simultaneously.
-
Click Add Device.
The selected devices are added successfully and are displayed under the BACnet MSTP Network in the Devices module.
Adding Points
After adding the BACnet MSTP device, you can add the required monitoring points from the discovered device.
-
Select the newly added BACnet MSTP Device from the Devices module.
-
Click Add Points.
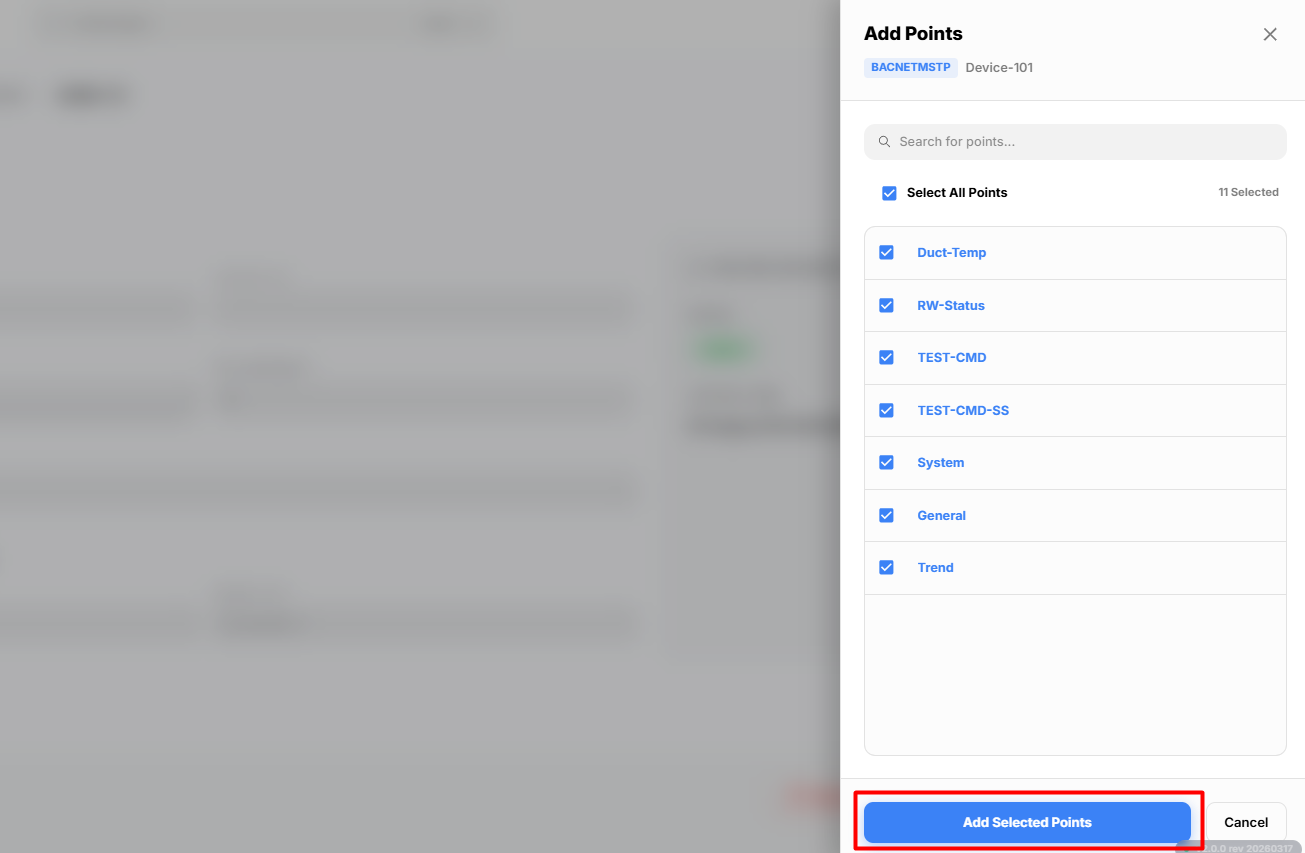
The Add Points dialog box appears, displaying all the available points discovered from the selected device.
-
Review the list of available points.
The platform displays all the points discovered from the selected BACnet MSTP device.
-
Select the required points that you want to add for monitoring.
You can select a single point or multiple points based on your requirements.
-
Click Add Points.
The selected points are added successfully and are displayed under the selected BACnet MSTP Device in the Devices module.
Viewing Point Properties
After adding the required points, select a point from the BACnet MSTP Device in the Device Browser.
The Point Properties page opens, allowing you to view the live status of the point and configure its properties.
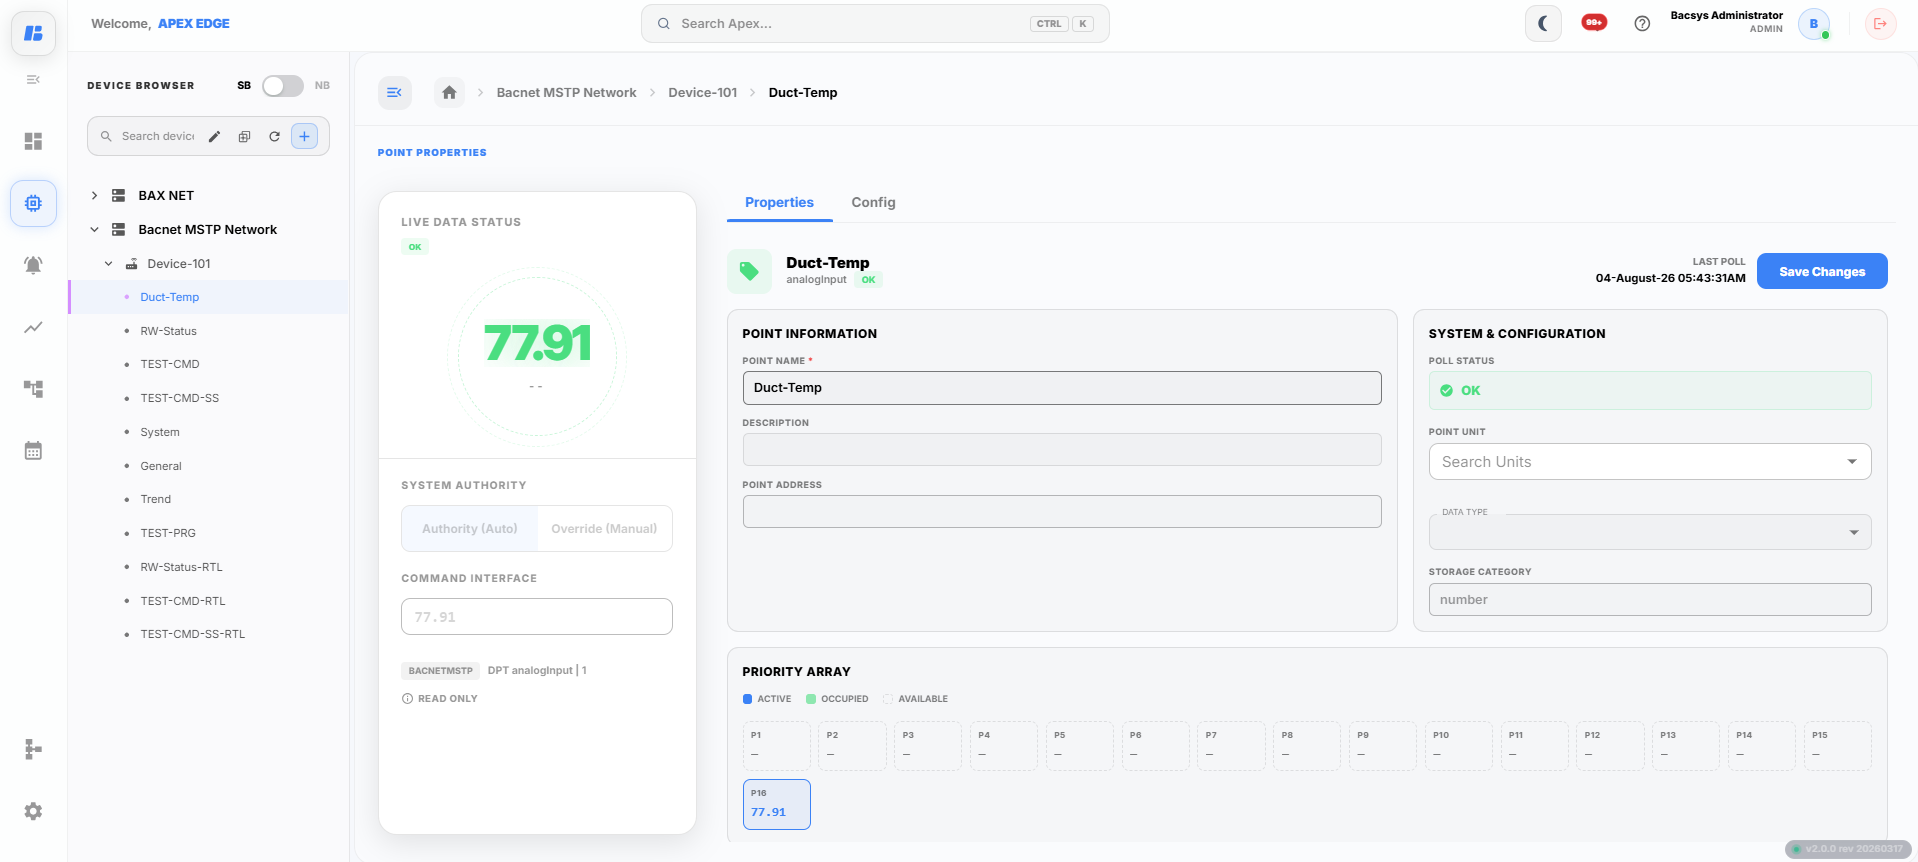
The point page contains two tabs:
- Properties
- Config
Properties
The Properties tab displays the basic information and current status of the selected point.
Live Data Status
The Live Data Status section displays:
- Current live value of the point.
- Communication status of the point.
- System authority information.
- Command interface.
Point Information
The Point Information section allows you to view or update the following details.
| Field | Description |
|---|---|
| Point Name | Displays the name of the point. You can modify the point name if required. |
| Description | Enter or update a description for the point. |
| Point Address | Displays the BACnet point address. |
System & Configuration
The System & Configuration section displays the current configuration of the selected point.
| Field | Description |
|---|---|
| Poll Status | Displays the communication status of the point. |
| Point Unit | Select the engineering unit for the point value. |
| Data Type | Displays the data type of the point. |
| Storage Category | Displays the storage category used for storing the point value. |
Priority Array
The Priority Array displays the command priorities currently assigned to the point.
The active priority is highlighted, allowing you to identify which priority level is currently controlling the point.
After making the required changes, click Save Changes to update the point configuration.
Point Configuration
After opening a point, click the Config tab to configure the operational settings of the selected point.
The Config tab contains the following sections:
- General
- Alarms
- Trends
- Tags
General
The General section allows you to configure how the point value is processed before it is displayed.
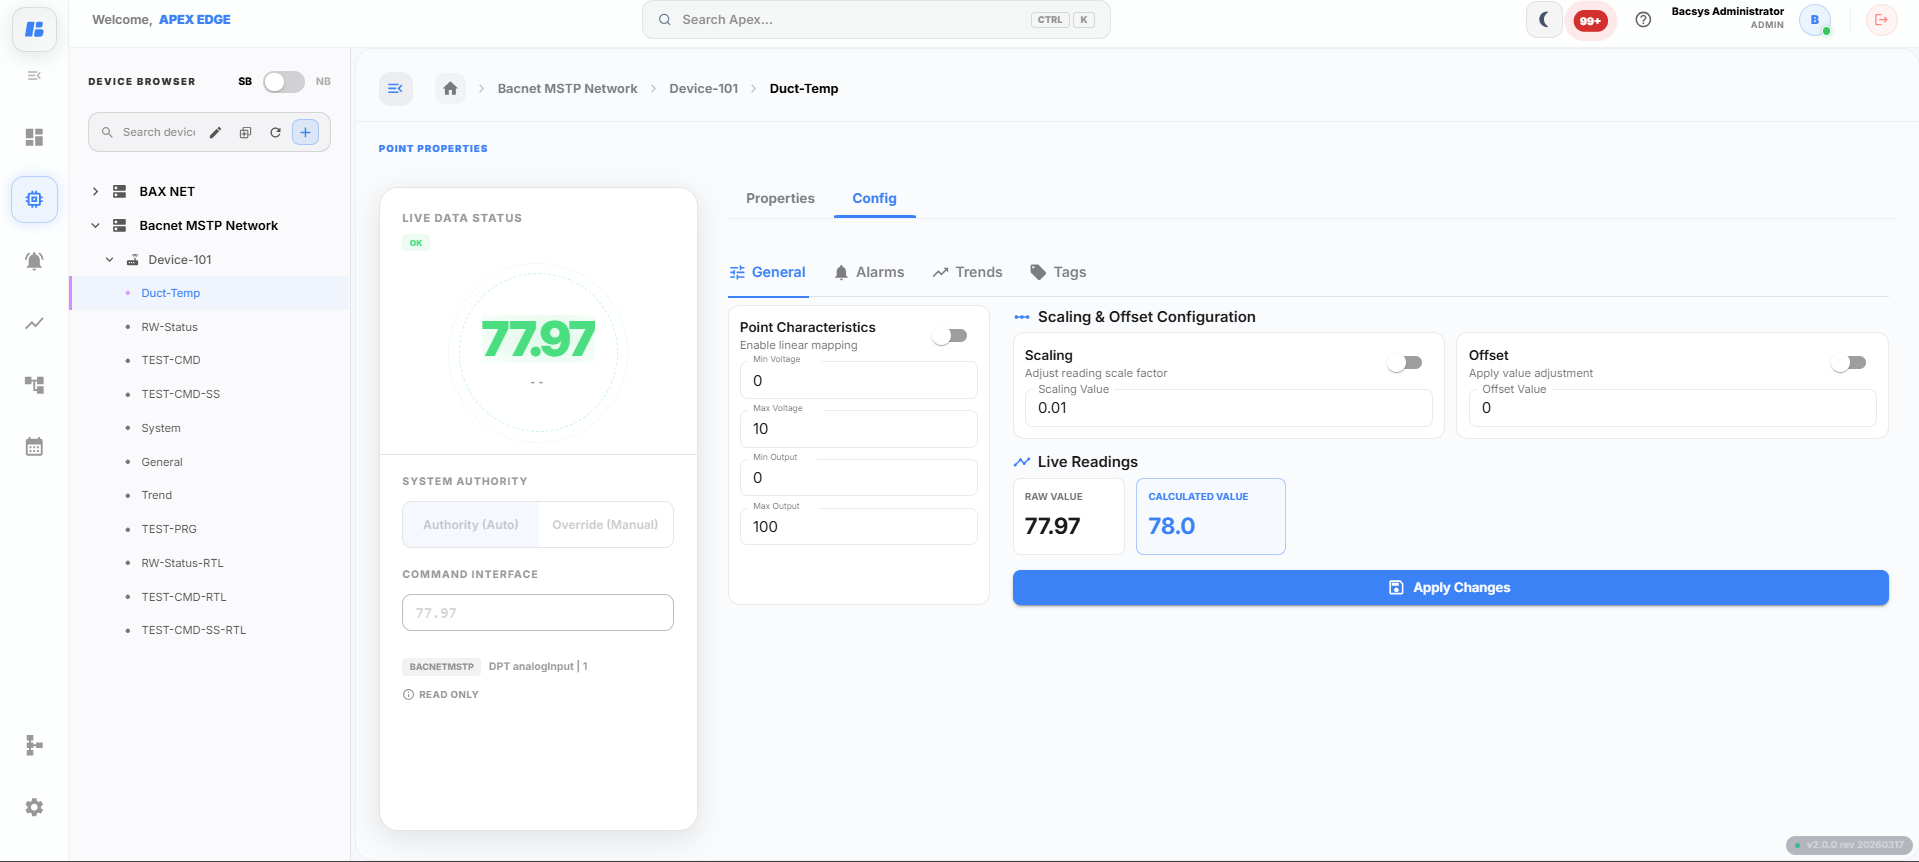
Point Characteristics
Enable Linear Mapping to convert the raw input value into the required engineering range.
Configure the following parameters:
| Field | Description |
|---|---|
| Min Voltage | Specifies the minimum input value. |
| Max Voltage | Specifies the maximum input value. |
| Min Output | Specifies the minimum mapped output value. |
| Max Output | Specifies the maximum mapped output value. |
Linear Mapping is useful when converting raw input values into engineering units.
Scaling
Enable Scaling to multiply the incoming point value by a scaling factor.
| Field | Description |
|---|---|
| Scaling Value | Specifies the multiplier applied to the point value. |
For example, if the raw value is 77.91 and the scaling factor is 0.01, the calculated value is automatically updated based on the configured scaling factor.
Offset
Enable Offset to adjust the calculated value by adding or subtracting a fixed value.
| Field | Description |
|---|---|
| Offset Value | Specifies the value added to or subtracted from the calculated value. |
Live Readings
The Live Readings section displays the current values of the selected point.
| Reading | Description |
|---|---|
| Raw Value | Displays the value received directly from the BACnet MSTP device. |
| Calculated Value | Displays the value after applying the configured scaling and offset. |
After configuring the required settings, click Apply Changes to save the configuration.
Alarms
The Alarms section allows you to configure alarm thresholds for the selected point.
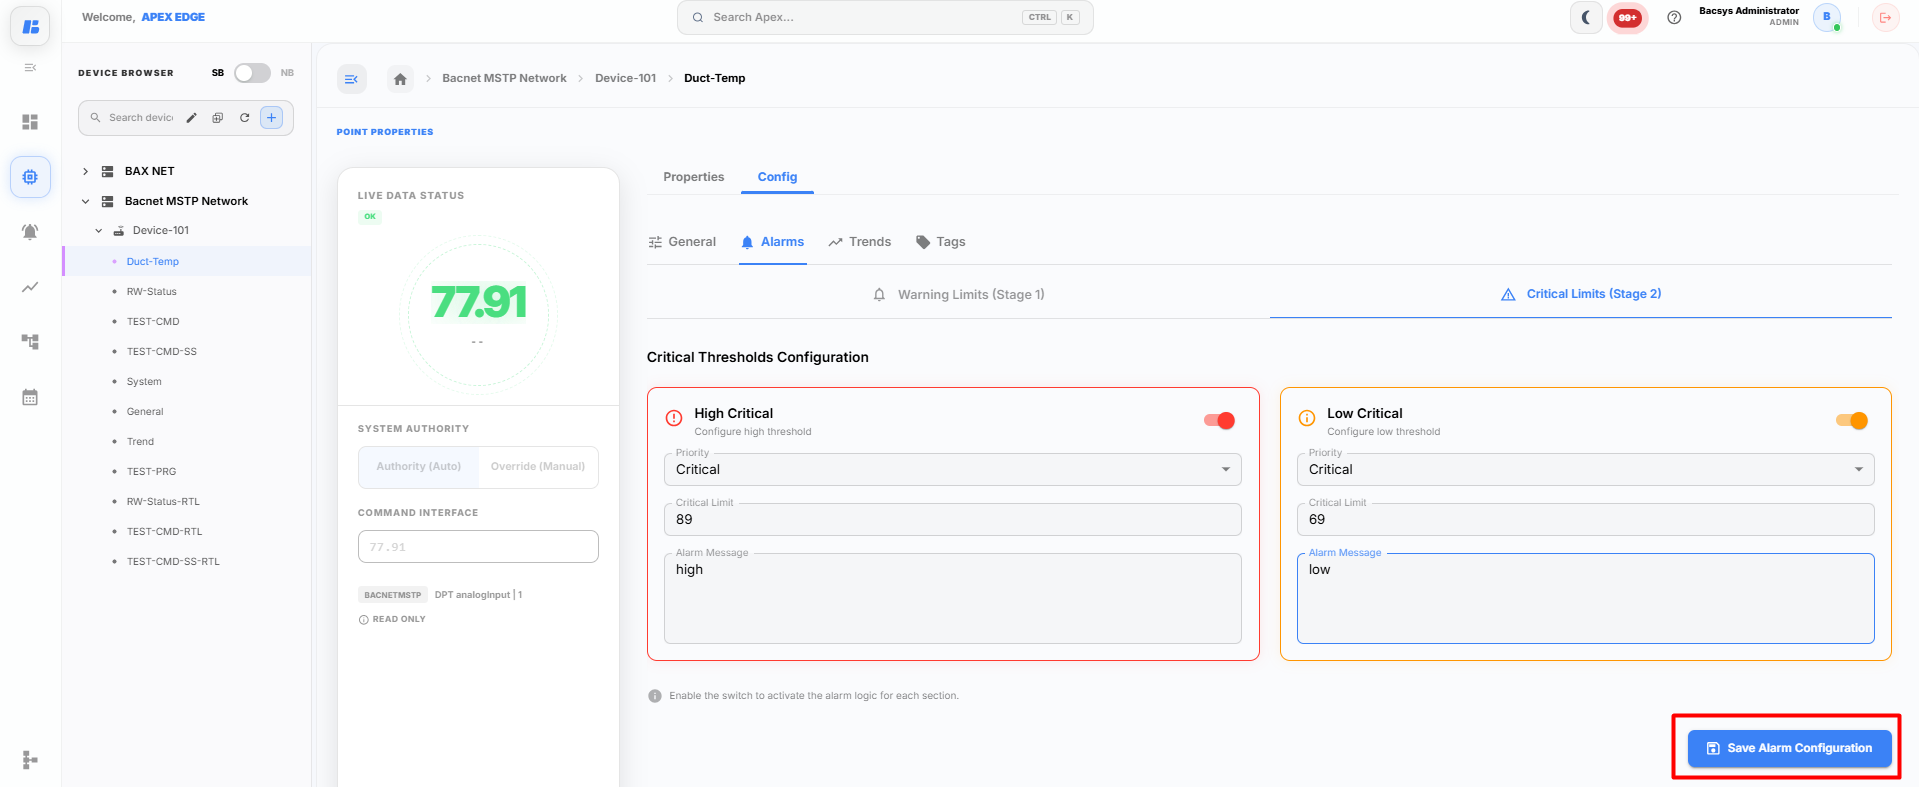
Two alarm types are available:
- High Critical
- Low Critical
For each alarm, configure the following settings:
| Field | Description |
|---|---|
| Enable | Enables or disables the alarm. |
| Priority | Specifies the alarm priority. |
| Critical Limit | Defines the threshold value that triggers the alarm. |
| Alarm Message | Enter the message displayed when the alarm is triggered. |
After configuring the alarm settings, click Save Alarm Configuration.
Trends
The Trends section allows you to configure historical data logging for the selected point.
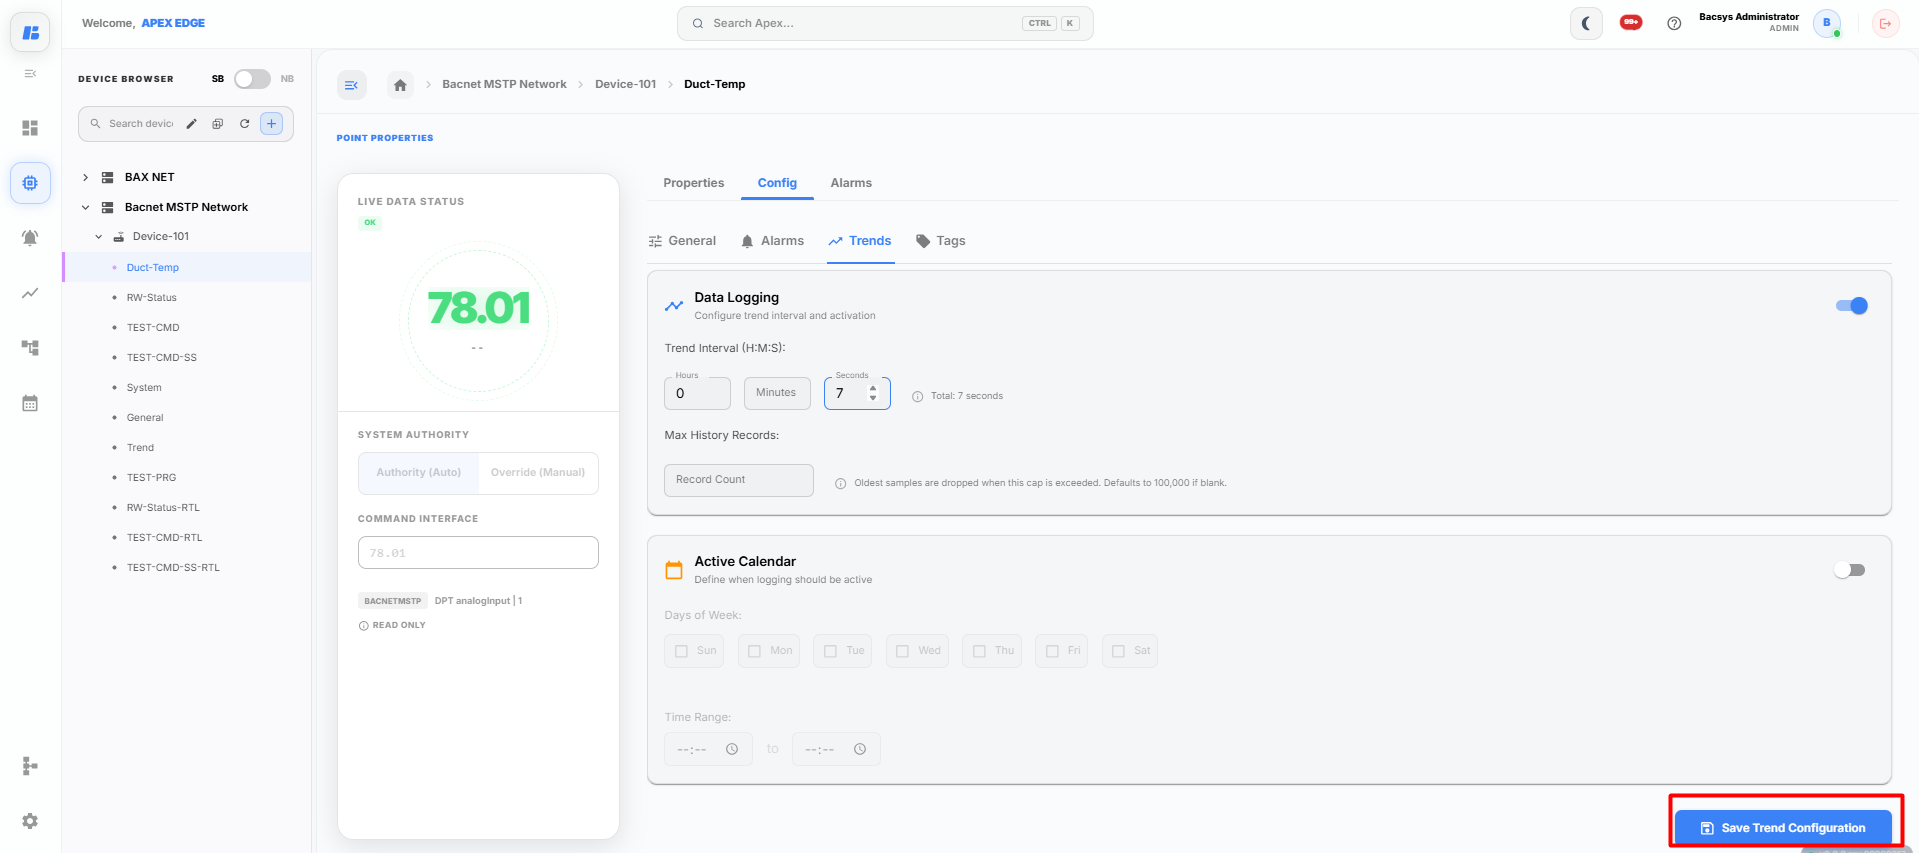
Data Logging
Enable Data Logging and configure the following settings:
| Field | Description |
|---|---|
| Trend Interval | Specifies how frequently the point value is recorded. |
| Max History Records | Specifies the maximum number of historical records to store. |
Active Calendar
The Active Calendar defines when trend logging should be enabled.
Configure:
- Days of the week
- Start Time
- End Time
After completing the configuration, click Save Trend Configuration.
Tags
The Tags section allows you to organize and categorize points using custom tags.
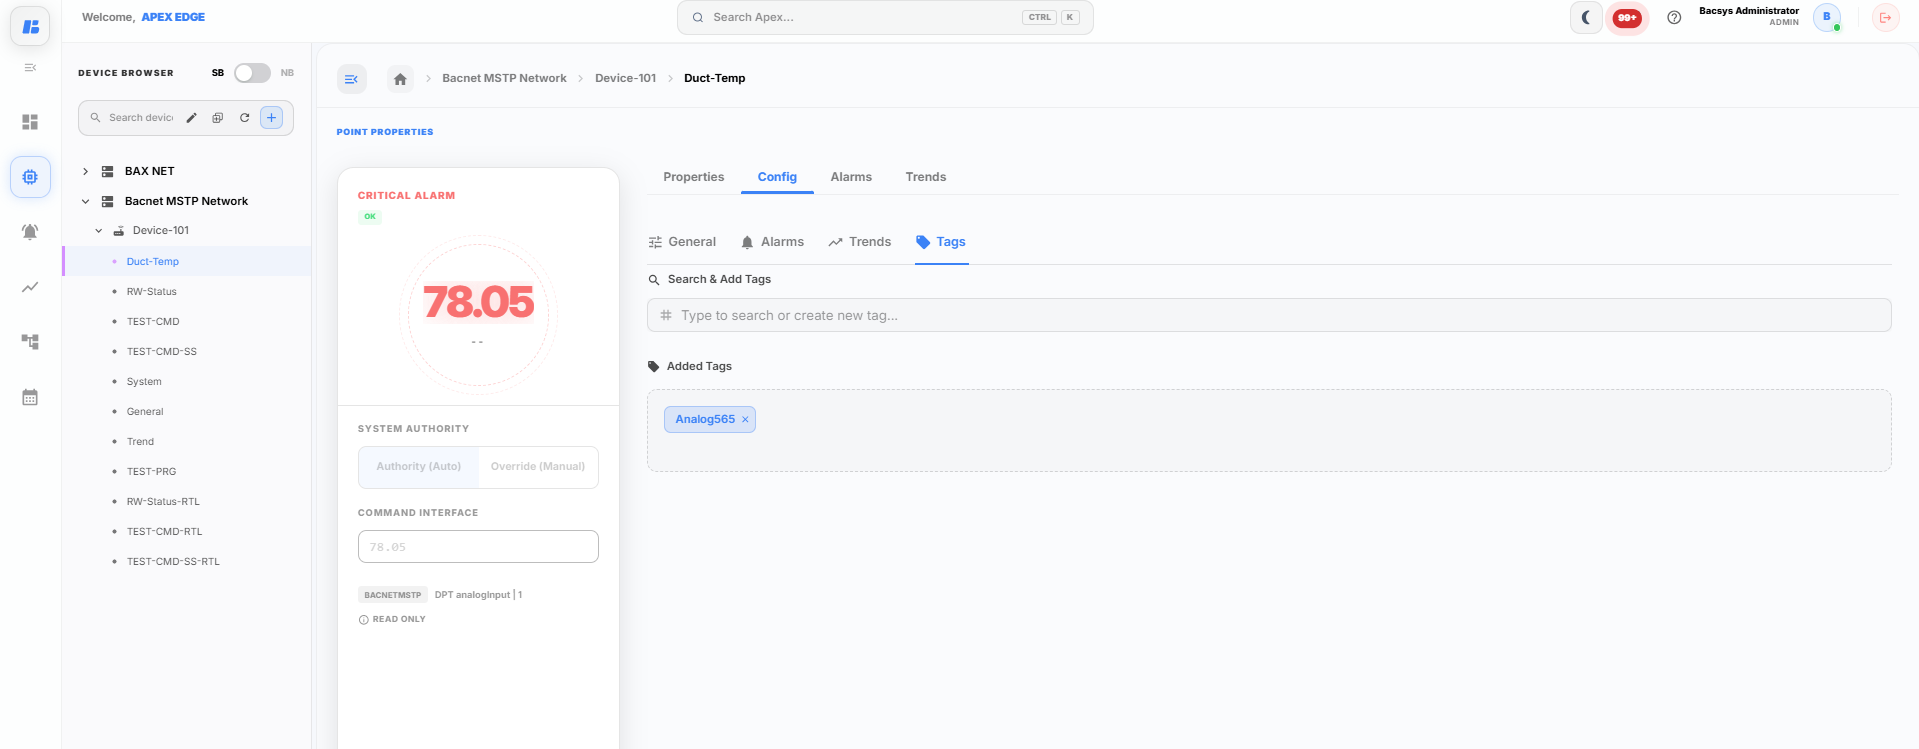
To add a tag:
- Enter the tag name in the Search & Add Tags field.
- Select an existing tag or create a new one.
- The selected tag is displayed under Added Tags.
Tags make it easier to organize, search, and filter points throughout the platform.
Alarm Status
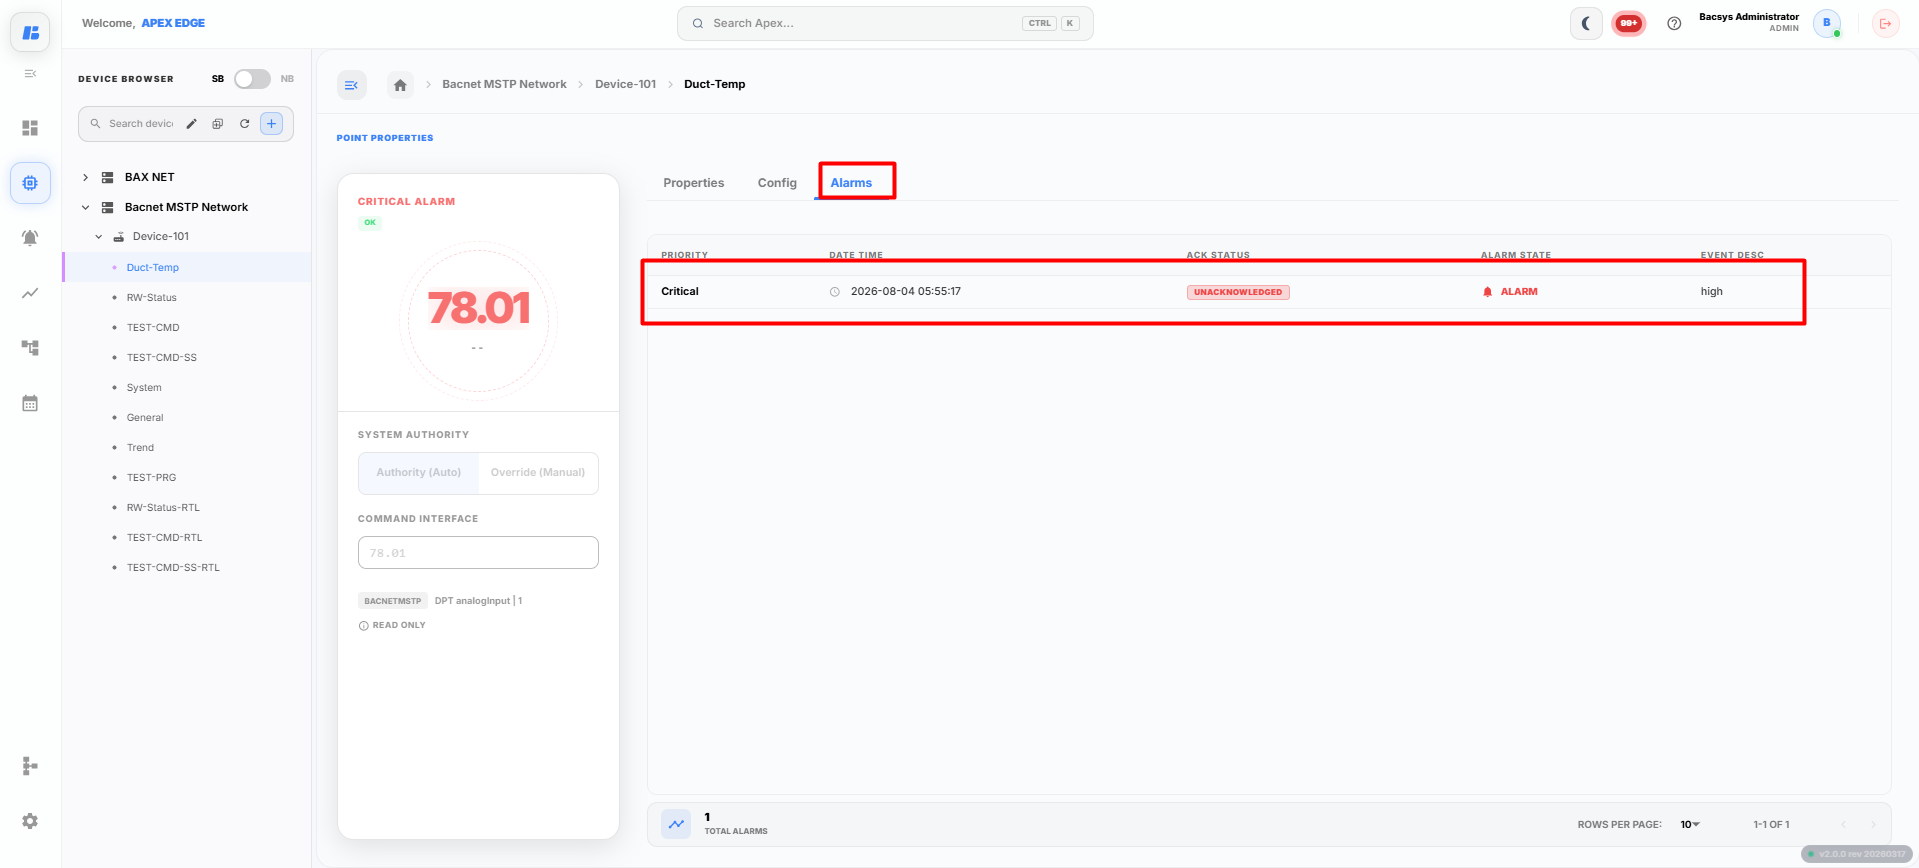
After configuring the alarm thresholds and clicking Save Alarm Configuration, the platform continuously monitors the point value against the configured limits.
When the point value reaches or exceeds the configured threshold, the corresponding alarm is generated.
To view the generated alarm:
- Navigate to the Alarms module from the sidebar.
- Select the required alarm from the alarm list.
- Open the associated point to view the alarm details and the current alarm status.
This allows you to verify whether the configured alarm has been triggered for the selected point.
Viewing Trends
After configuring and enabling trend logging, you can view the historical data recorded for the selected point.
Navigate to the Trends module and select the required point. The historical data is available in both Table View and Chart View.
Table View
The Table View displays the recorded point values in a tabular format over the selected time period.
The following options are available:
| Option | Description |
|---|---|
| Start Date | Select the start date for retrieving trend data. |
| End Date | Select the end date for retrieving trend data. |
| Export | Exports the displayed trend data as a CSV file. |
| Refresh | Reloads the trend data for the selected date range. |
| Clear | Clears the selected date range and displayed data. |
| Delta | Enables or disables delta value display. |
| Edit | Enables or disables edit mode using the toggle button. |
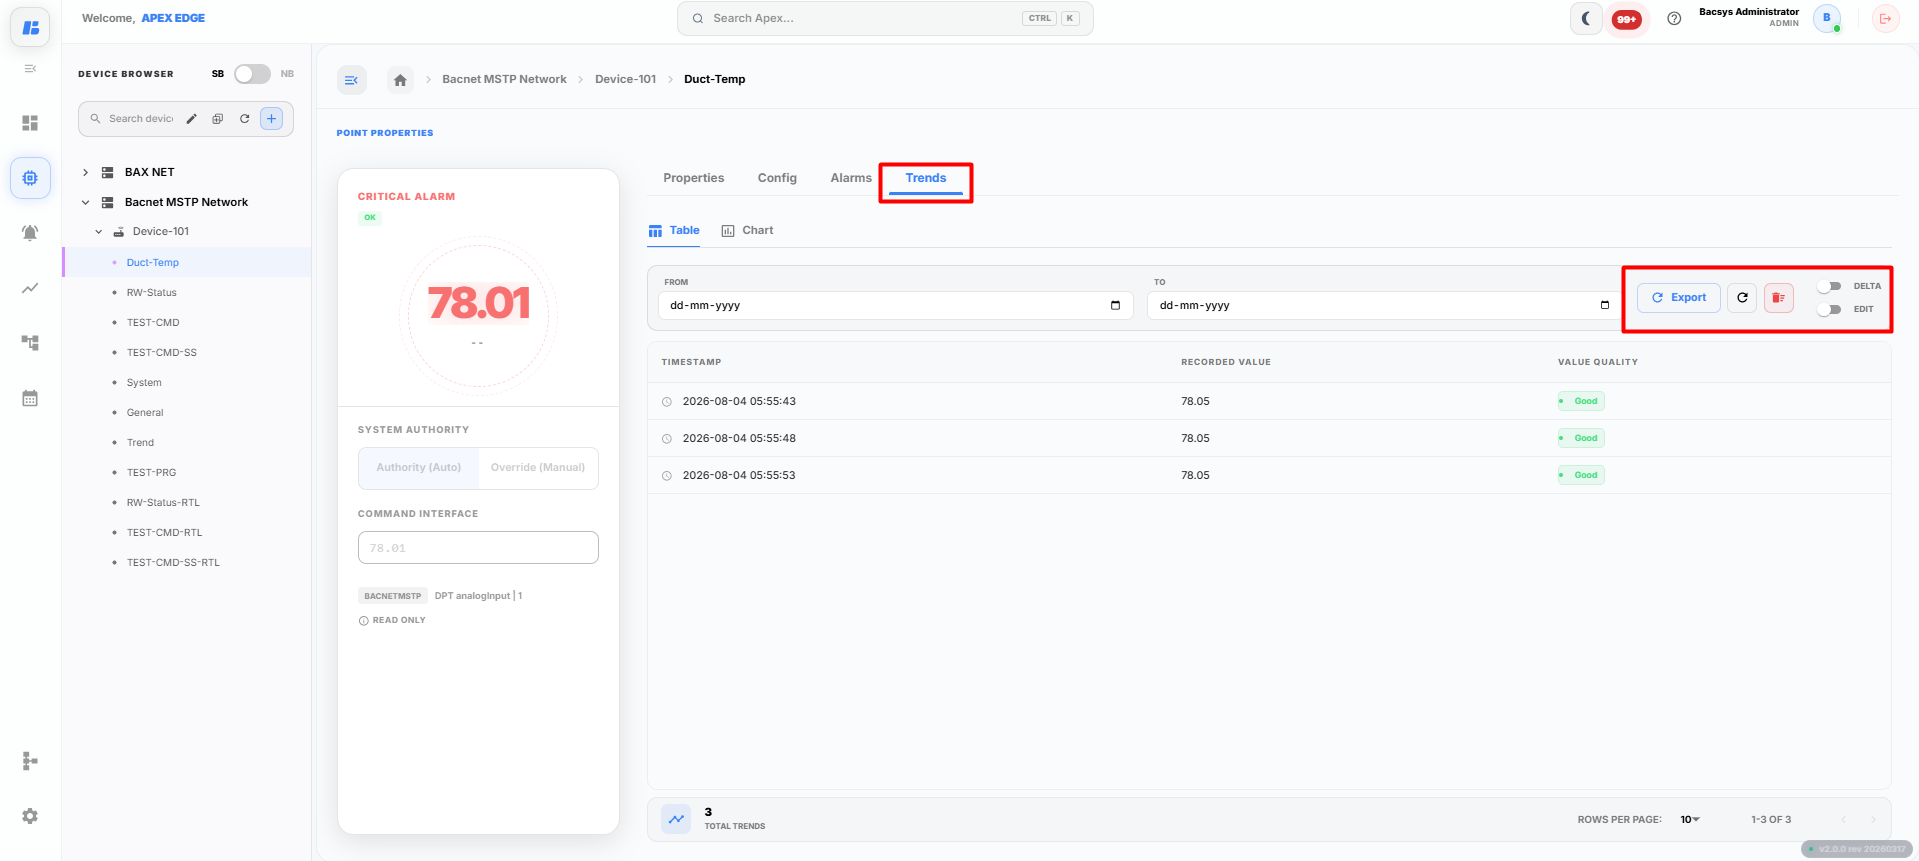
Chart View
The Chart View displays the historical values of the selected point as a graphical trend, making it easier to analyze value changes over time.
The following options are available:
| Option | Description |
|---|---|
| Start Date | Select the start date for displaying trend data. |
| End Date | Select the end date for displaying trend data. |
| Export | Exports the displayed chart data. |
| Refresh | Reloads the chart using the selected date range. |
| Clear | Clears the selected filters and chart data. |
| Delta | Enables or disables delta value display on the chart. |
| Edit | Enables or disables edit mode using the toggle button. |
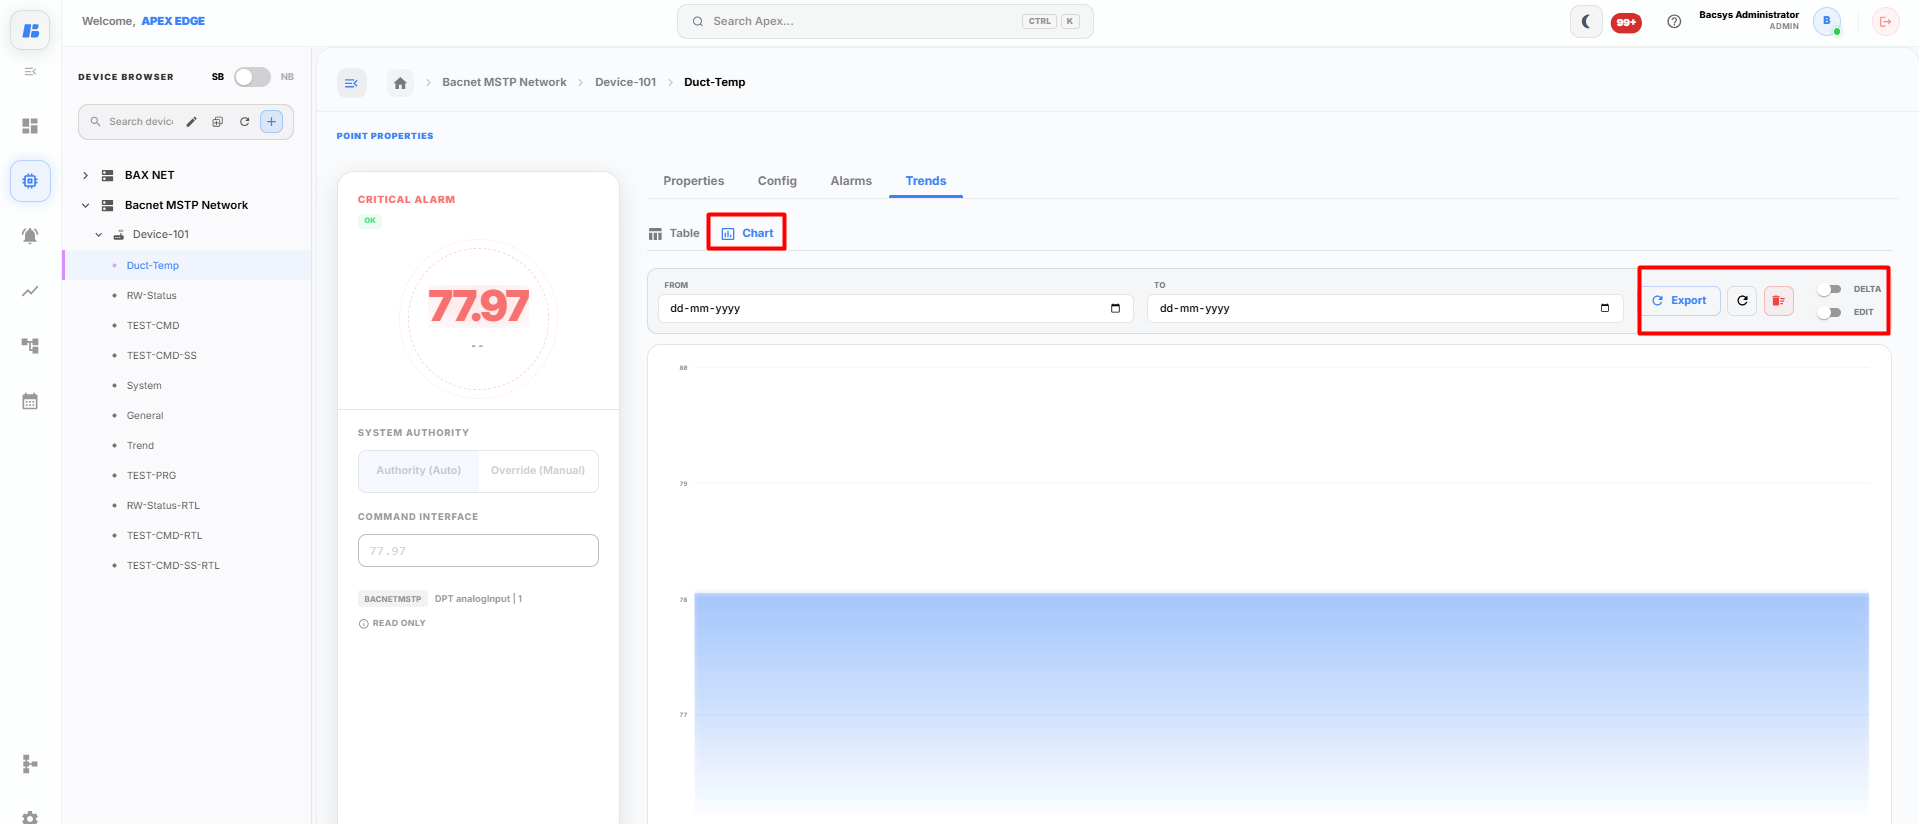
The Table View is useful for reviewing recorded values in a structured format and exporting them for further analysis. The Chart View provides a graphical representation of historical data, allowing you to visualize trends and monitor changes in point values over time.
Complete Workflow
Follow the steps below to configure a BACnet MSTP network, add devices and points, configure point settings, and monitor live and historical data.
- Open the Devices module.
- Click the + (Add) icon.
- Drag and drop BACnet MSTP into the Create Network window.
- Configure the network by entering:
- Network Name
- Communication Port (RS1, RS2, or RS3)
- Baud Rate
- Max Masters
- Timeout
- Click Create Network.
- Select the newly created BACnet MSTP Network.
- Click Add Device.
- Select one or more discovered BACnet MSTP devices.
- Click Add Device.
- Select the required BACnet MSTP device.
- Click Add Points.
- Select the required monitoring points.
- Click Add Points to add the selected points to the device.
- Select a point from the Device Browser to open the Point Properties page.
- Update the point information if required and click Save Changes.
- Open the Config tab to configure:
- General
- Alarms
- Trends
- Tags
- Configure General settings such as Linear Mapping, Scaling, Offset, and Live Readings, then click Apply Changes.
- Configure Alarm thresholds and click Save Alarm Configuration.
- Configure Trend logging and click Save Trend Configuration.
- Add or manage Tags for the selected point.
- To verify alarms:
- Open the Alarms module.
- Select the required alarm.
- Open the associated point to view the alarm status.
- To analyze historical data:
- Open the Trends module.
- Select the required point.
- View historical data in Table View or Chart View.
- Use the available trend options to:
- Select the Start Date and End Date.
- Export the data.
- Refresh the displayed data.
- Clear the selected filters.
- Enable or disable the Delta option.
- Enable or disable Edit mode.
The BACnet MSTP network is now configured successfully, allowing you to monitor live point values, configure alarms, record historical trends, and organize points using tags.