

Configuring REST API
Creating a REST API Network
The REST API network allows you to connect external REST API services and retrieve data for monitoring within the platform.
-
Navigate to the Devices module from the sidebar.
-
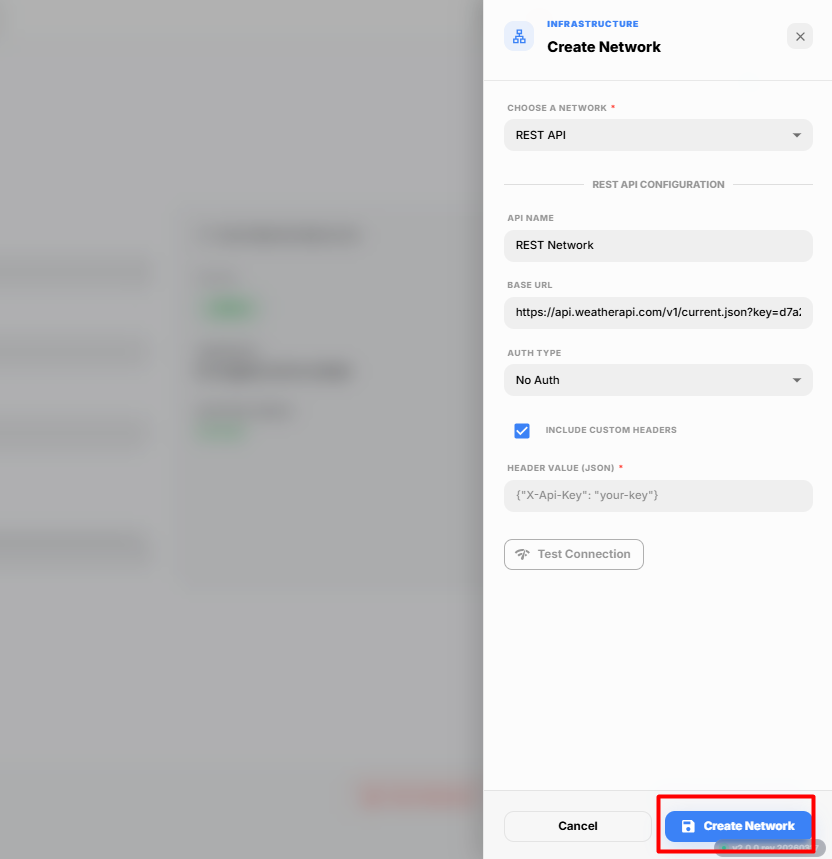
Click the + (Add) icon and select REST API from the Choose a Network dropdown.
The Create Network dialog box appears.
-
Configure the REST API connection by providing the required details.
Field Description API Name Enter a unique name to identify the REST API network. Base URL Enter the base URL or endpoint of the REST API. Auth Type Select the required authentication method. Available options are No Auth, Basic Auth, and Bearer Token. Include Custom Headers Enable this option to add additional HTTP headers required by the REST API.
Authentication Types
No Auth
Select No Auth if the REST API does not require authentication.
Basic Auth
Select Basic Auth if the API requires a username and password.
| Field | Description |
|---|---|
| Username | Enter the username used for API authentication. |
| Password | Enter the password associated with the username. |
Bearer Token
Select Bearer Token if the API uses token-based authentication.
| Field | Description |
|---|---|
| Token | Enter the bearer token provided by the REST API service. |
Custom Headers
If the API requires additional HTTP headers, enable Include Custom Headers and provide the required headers in JSON format.
-
Click Test Connection to verify that the REST API endpoint is reachable and the authentication details are valid.
-
Click Create Network.
The REST API network is successfully created and displayed in the Devices module.
Understanding the REST API Response
The configured Base URL returns data in JSON format. The platform reads the JSON response and extracts the available fields, which can then be used to create monitoring points.
For example, the REST API may return the following response:
{
  "location": {
    "name": "Coimbatore",
    "region": "Tamil Nadu",
    "country": "India"
  },
  "current": {
    "temp_c": 28.9,
    "humidity": 58,
    "wind_kph": 19.8,
    "pressure_mb": 1010,
    "condition": {
      "text": "Partly Cloudy"
    }
  }
}
The platform converts the JSON response into field paths using dot notation.
| JSON Value | Field Path |
|---|---|
| City | location.name |
| Region | location.region |
| Country | location.country |
| Temperature | current.temp_c |
| Humidity | current.humidity |
| Wind Speed | current.wind_kph |
| Pressure | current.pressure_mb |
| Weather Condition | current.condition.text |
These field paths are used while adding monitoring points.
Configuring and Adding a Device
After creating the REST API network, add a device to retrieve data from the configured REST API.
-
Select the created REST API network.
-
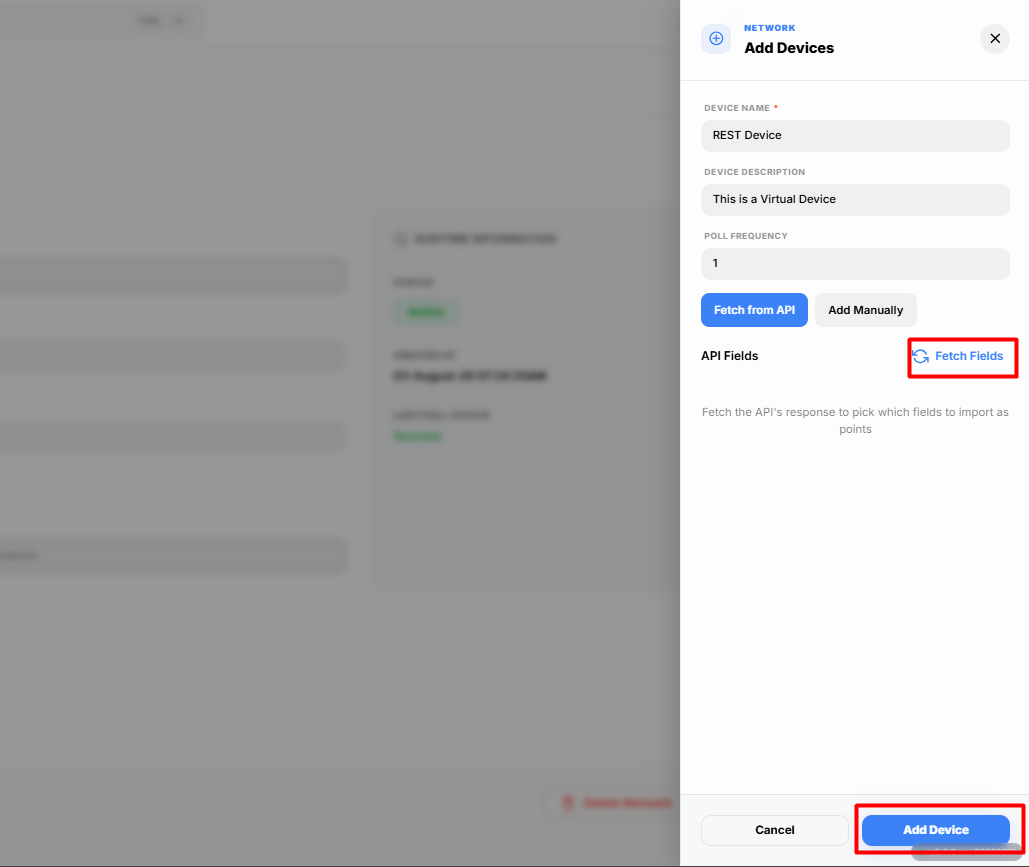
Click Add Device.
The Add Device dialog box appears.
-
Enter the required device details.
Field Description Device Name Enter a unique name for the device. Device Description Enter a brief description of the device. Poll Frequency Specify how frequently the platform polls the REST API to retrieve the latest data. The platform provides two methods for configuring attributes:
- Fetch from API
- Add Manually
Fetch from API
-
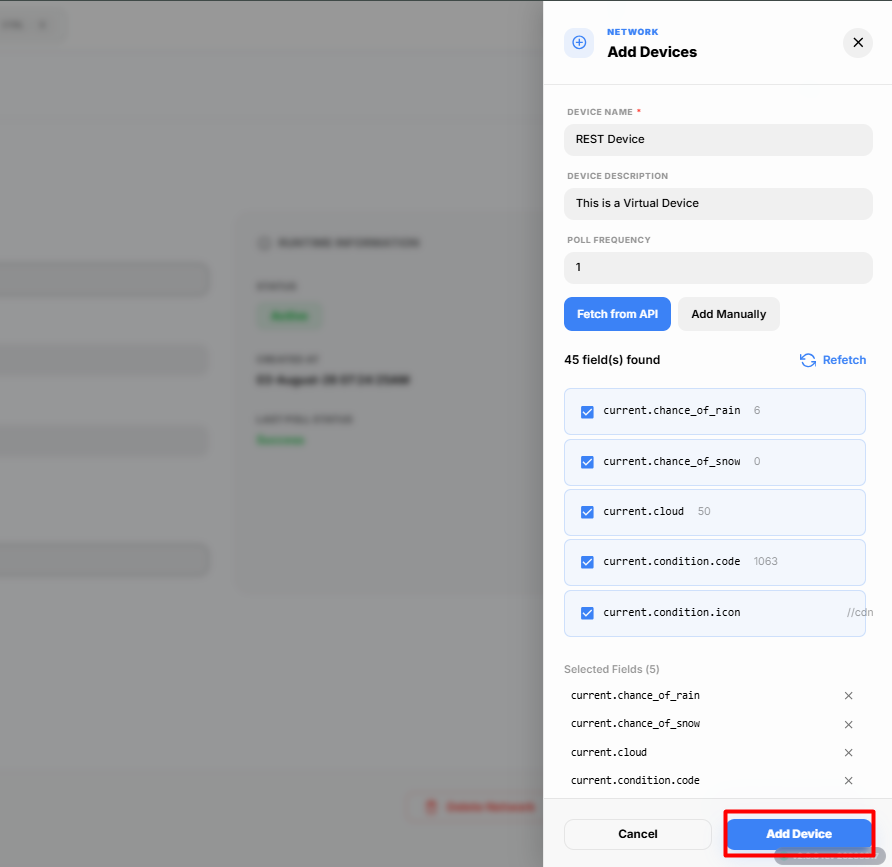
Select Fetch from API.
-
Click Fetch Fields.
The platform retrieves all available fields from the configured REST API response.
-
Select the required fields from the list.
Each field contains:
Field Description Field Name The attribute name retrieved from the API response. Field Path The JSON path of the selected attribute. -
Click Add.
The selected fields are added to the device configuration.
-
Click Add Device.
The device is created successfully.
Add Manually
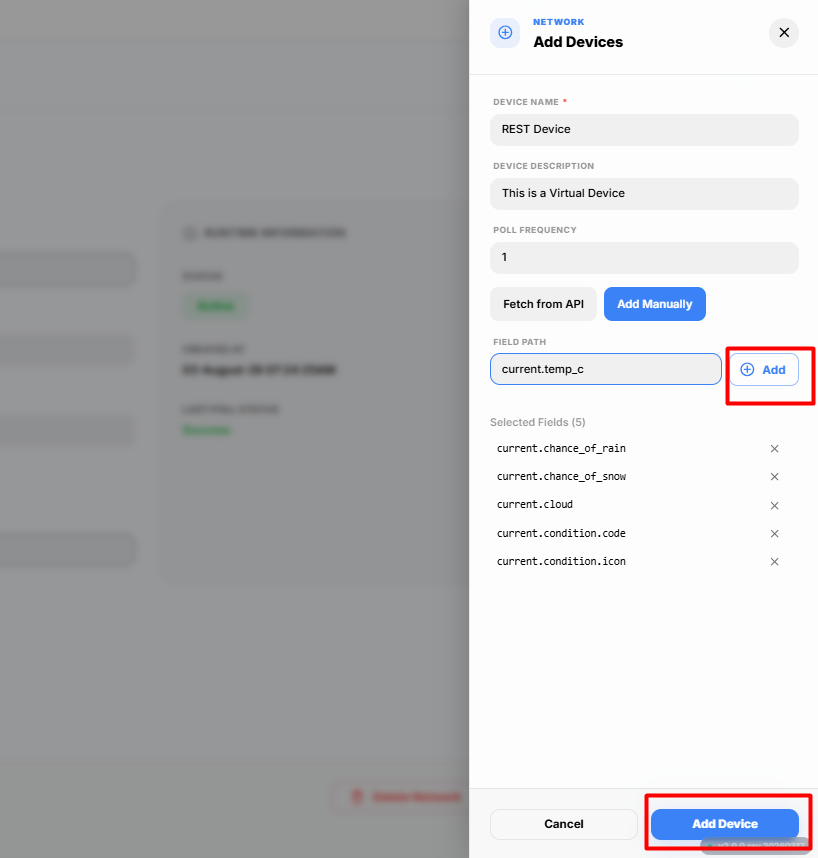
Select Add Manually if you want to configure the attributes yourself.
Enter the required attribute details manually and click Add.
Repeat the process for additional attributes if required.
Click Add Device to create the device.
Adding Points
After creating the device, you can create monitoring points for the required attributes.
-
Select the newly created REST API device.
-
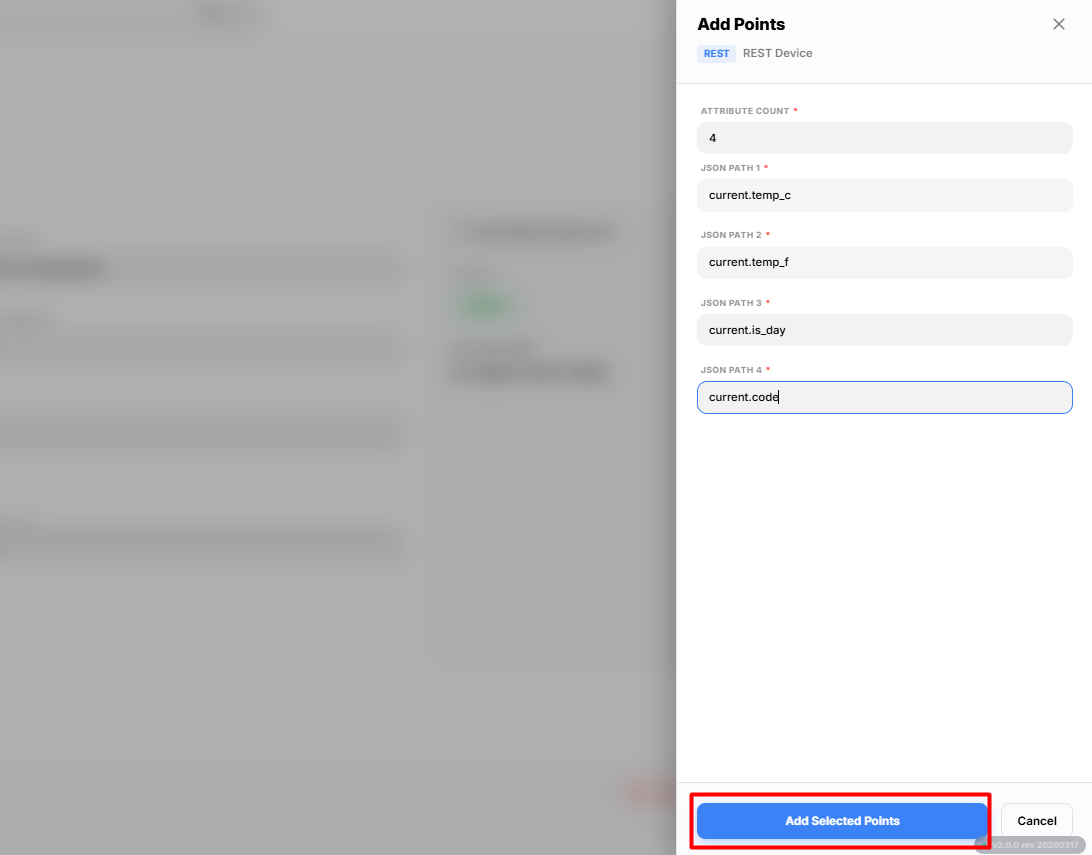
Click Add Points.
The Add Points dialog box appears.
-
Enter the Attribute Count.
The Attribute Count specifies the number of attributes (points) that you want to create.
-
Click Add Attribute.
A new attribute row is added for each point.
Configure the following details for each attribute.
Field Description Attribute Name Enter a unique name for the point. Field Path Enter the JSON path corresponding to the attribute in the API response. Repeat the process until all required attributes have been added.
-
Click Add.
The selected attributes are created as monitoring points.
Starting the Points
After the points have been created successfully, you can start retrieving live values.
-
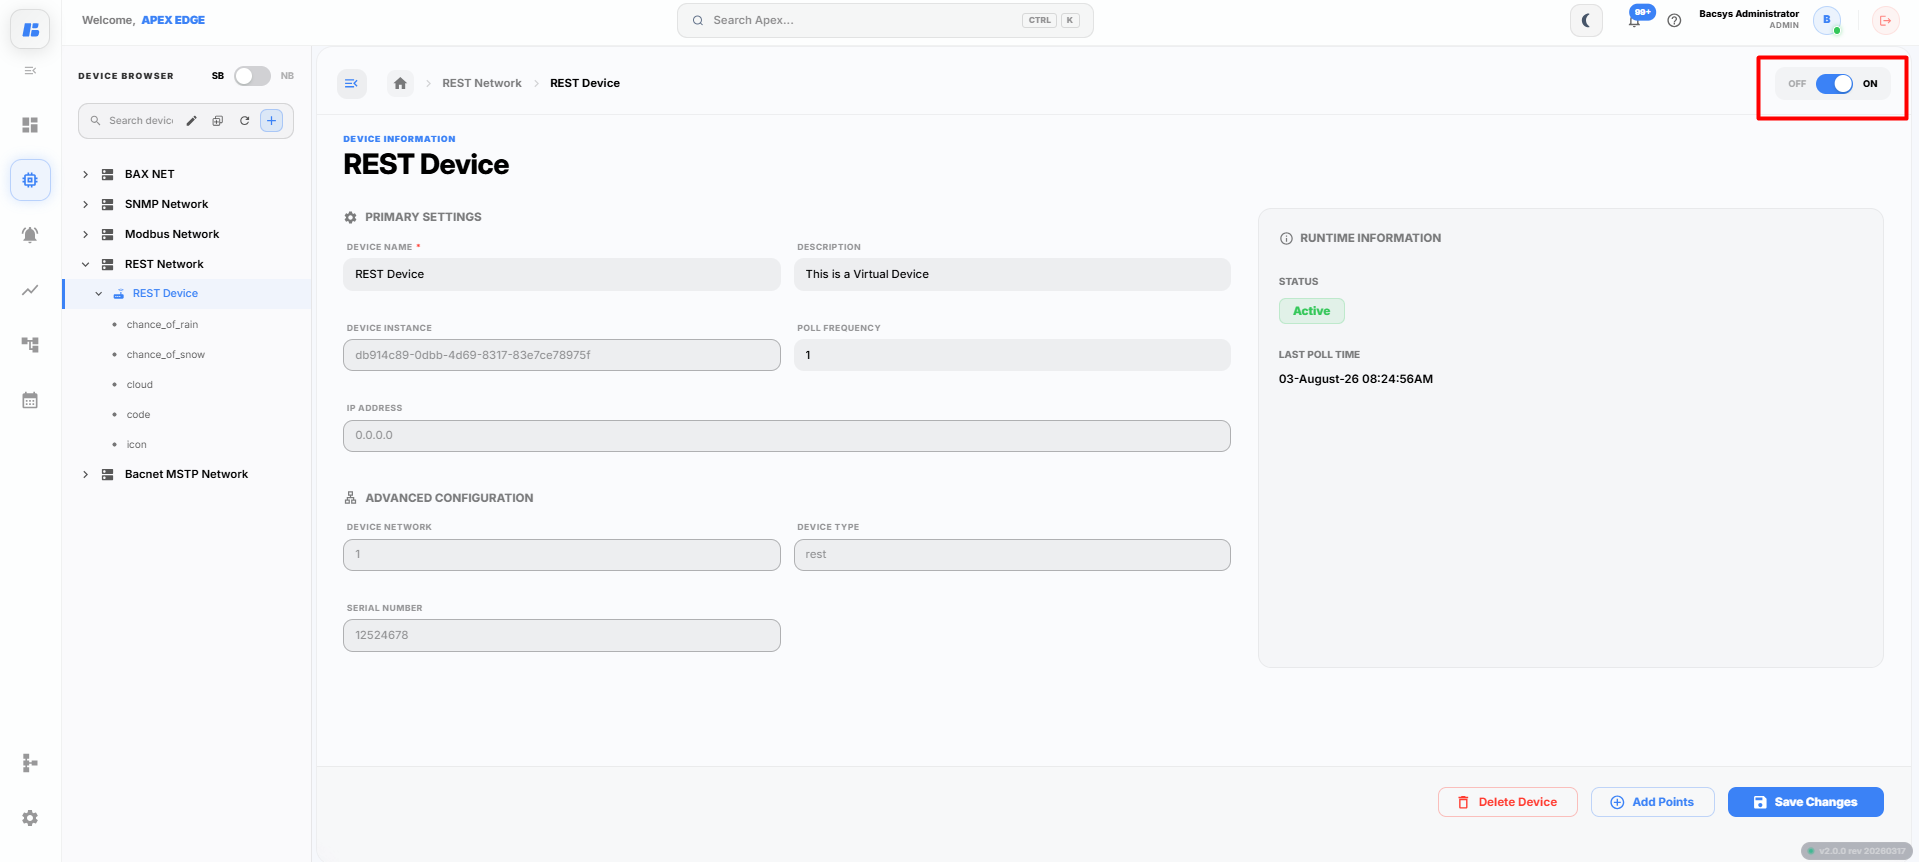
Locate the required point under the REST API device.
-
Turn the On toggle for the point.
The platform starts polling the configured REST API based on the specified Poll Frequency and updates the point with the latest values.
Viewing Live Values
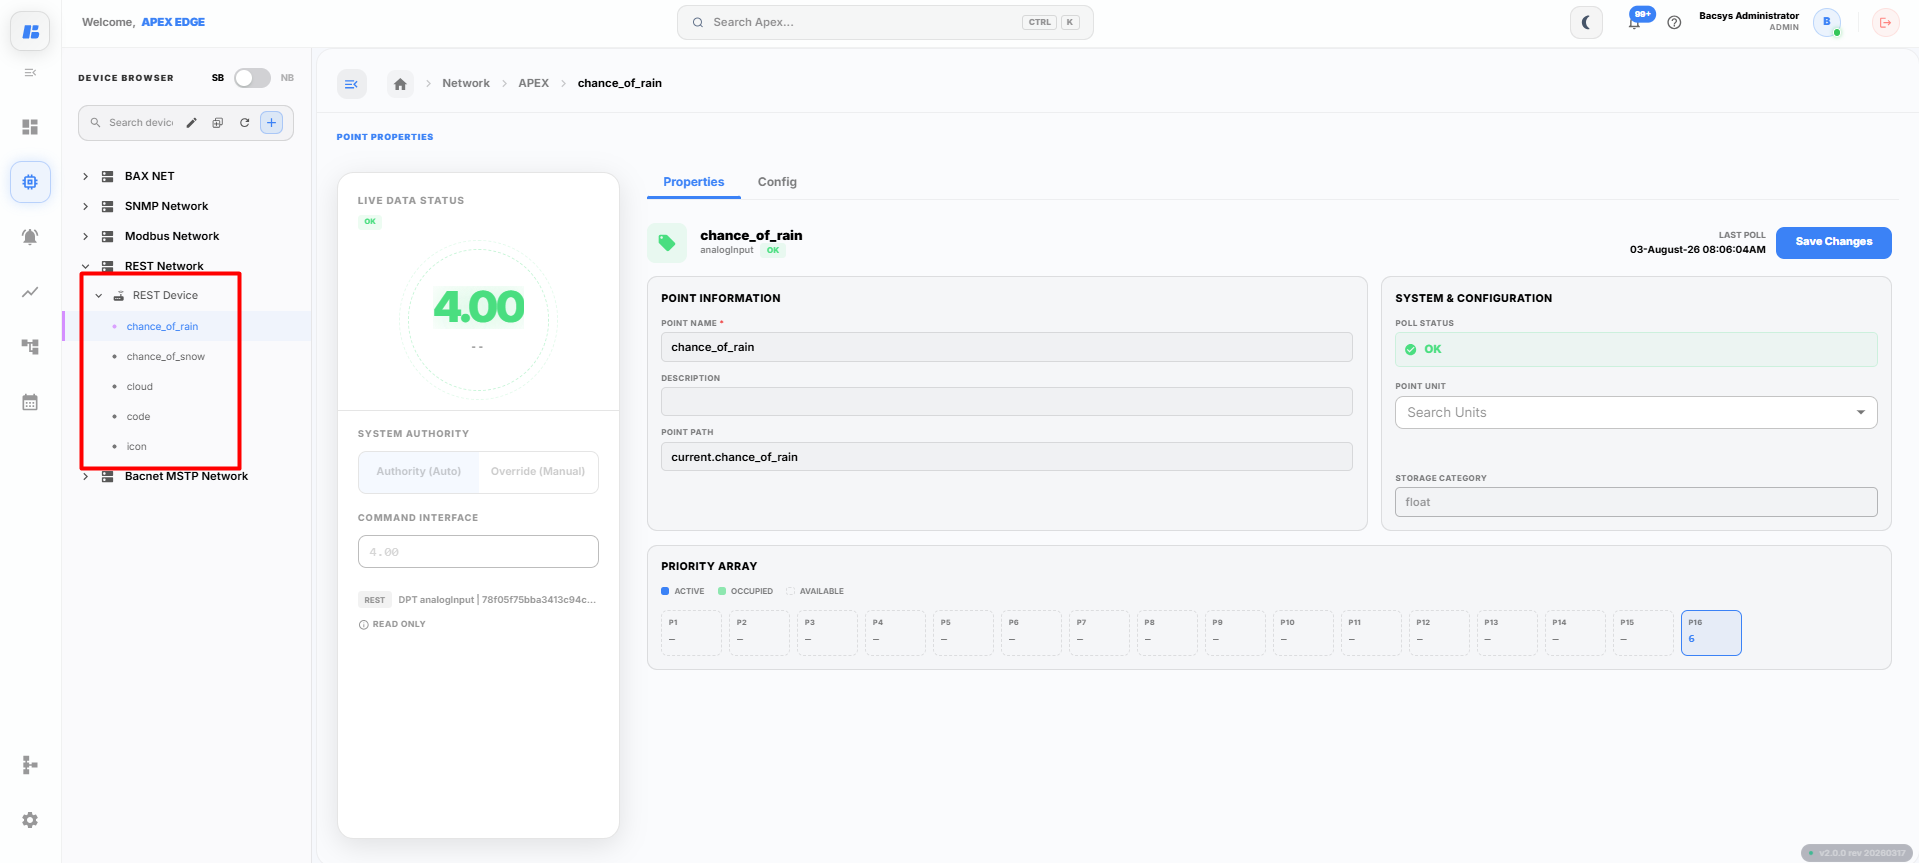
Once the point is turned On, click the required point to view its details.
The Point Details page displays:
- Point Properties
- Live Values
- Communication Status
- Real-time Updates
Point Properties
After enabling a point, click the required point to view and configure its properties.
The point details page contains the following tabs:
- Properties
- Config
Point Properties
After the point is created and enabled, click the required point to open its Properties page.
The Properties tab allows you to view and modify the basic information of the selected point.
The following fields are available:
| Field | Description |
|---|---|
| Point Name | Displays the name of the point. You can modify the point name if required. |
| Point Description | Enter or update a description for the point. |
| Point Path | Displays the JSON field path associated with the point. |
| Point Unit | Specify the unit of measurement for the point, such as °C, %, kPa, or km/h. |
After updating the required fields, click Save Changes to save the point configuration.
Point Configuration
After opening a point, click the Config tab to configure the point settings.
The Config tab contains the following sections:
- General
- Alarms
- Trends
- Tags
General
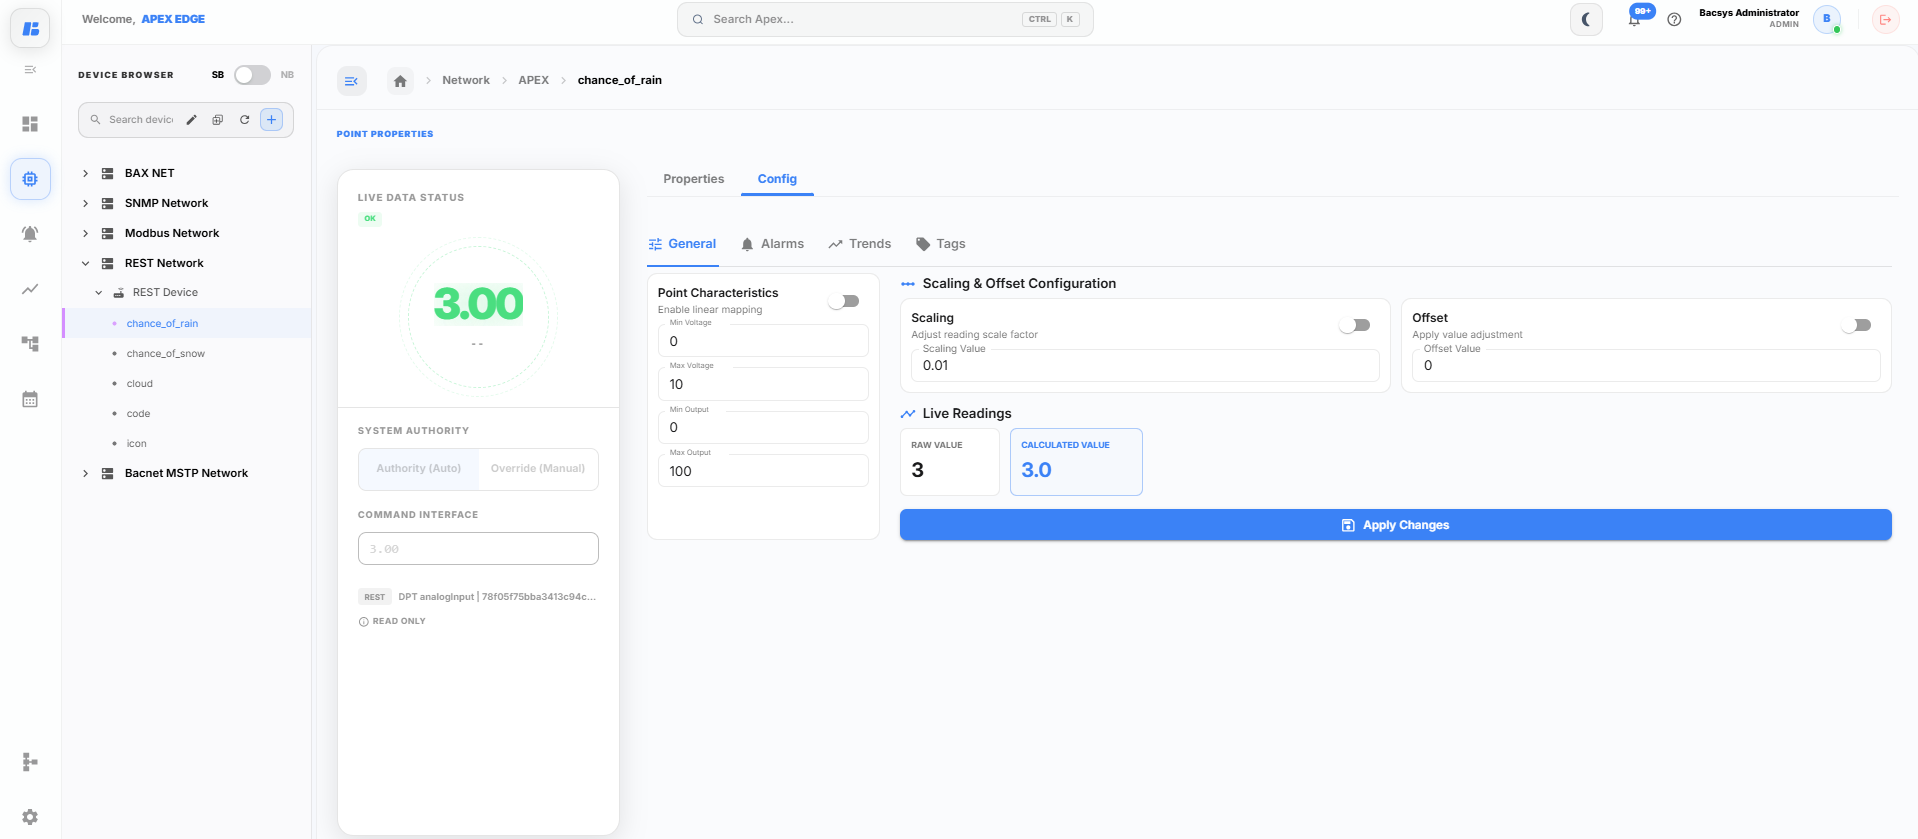
The General section allows you to configure linear mapping, scaling, and offset values for the selected point.
Point Characteristics
Enable Linear Mapping to map the raw input value to the required output range.
| Field | Description |
|---|---|
| Min Voltage | Specifies the minimum input value. |
| Max Voltage | Specifies the maximum input value. |
| Min Output | Specifies the minimum mapped output value. |
| Max Output | Specifies the maximum mapped output value. |
Scaling
Enable Scaling to multiply the incoming point value by a scaling factor.
| Field | Description |
|---|---|
| Scaling Value | Specifies the scaling factor applied to the point value. |
Offset
Enable Offset to adjust the point value by adding or subtracting a fixed value.
| Field | Description |
|---|---|
| Offset Value | Specifies the offset value applied to the point. |
Live Readings
The Live Readings section displays:
- Raw Value
- Calculated Value
After configuring the required settings, click Apply Changes to save the configuration.
Alarms
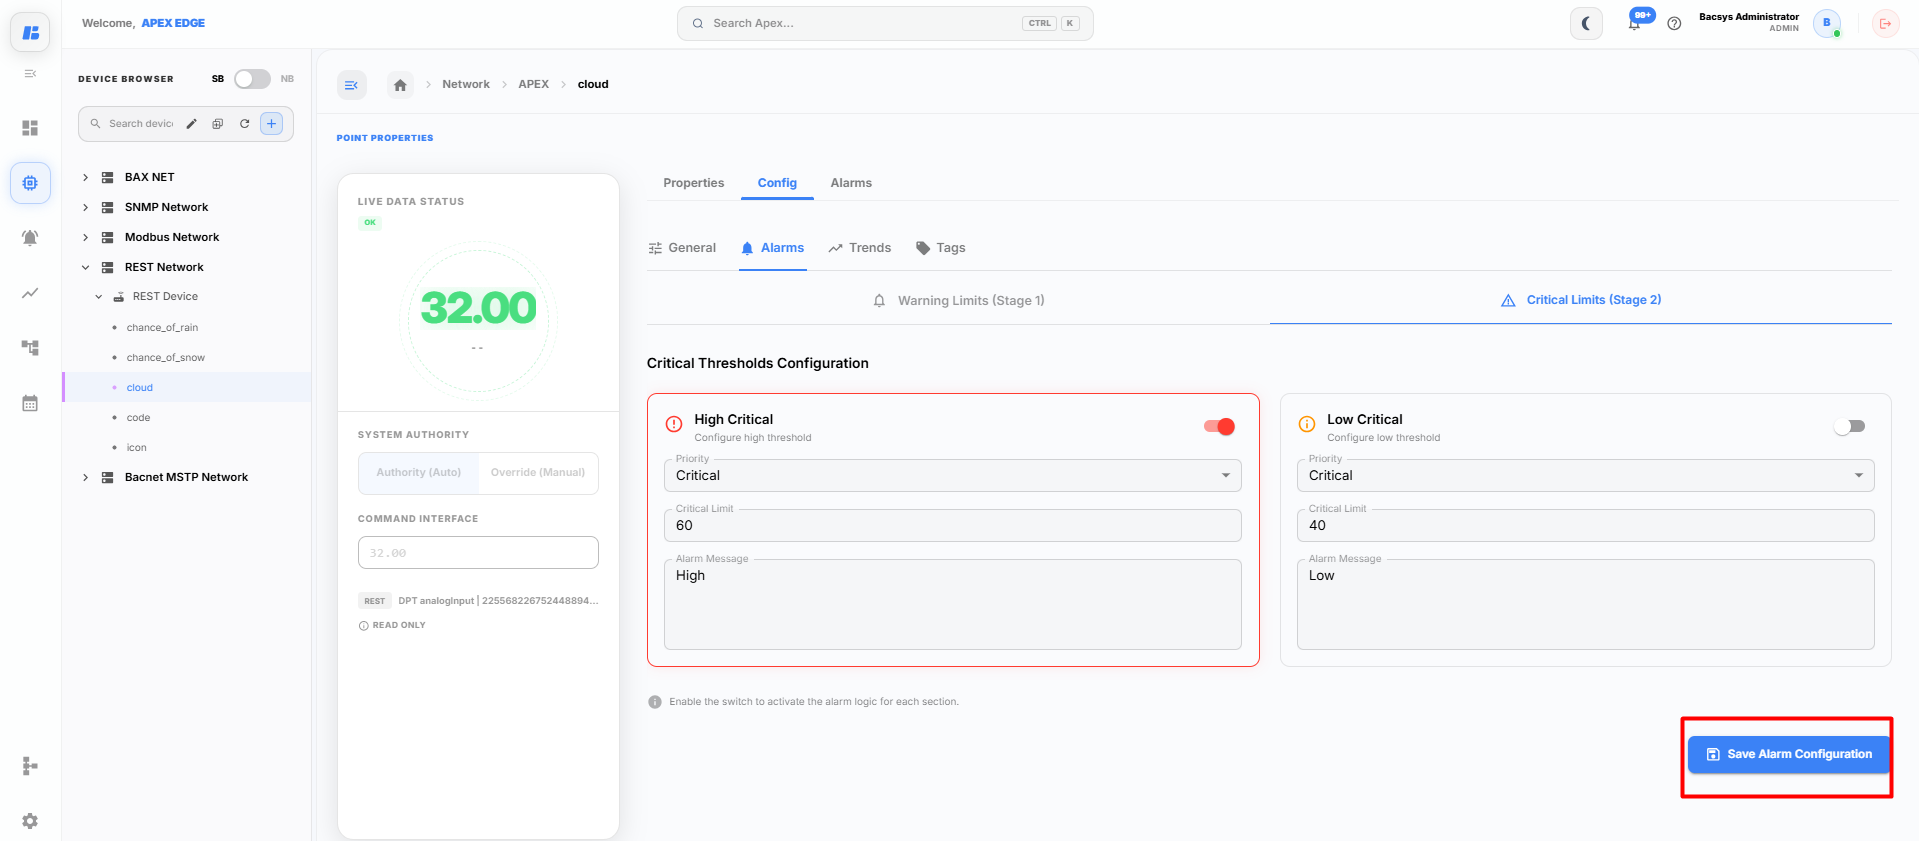
The Alarms section allows you to configure alarm thresholds for the selected point.
The following alarm types are available:
- High Critical
- Low Critical
For each alarm, you can configure:
| Field | Description |
|---|---|
| Priority | Select the alarm priority. |
| Critical Limit | Specify the threshold value that triggers the alarm. |
| Alarm Message | Enter the message displayed when the alarm is triggered. |
Enable the required alarm and click Save Alarm Configuration to apply the changes.
Trends
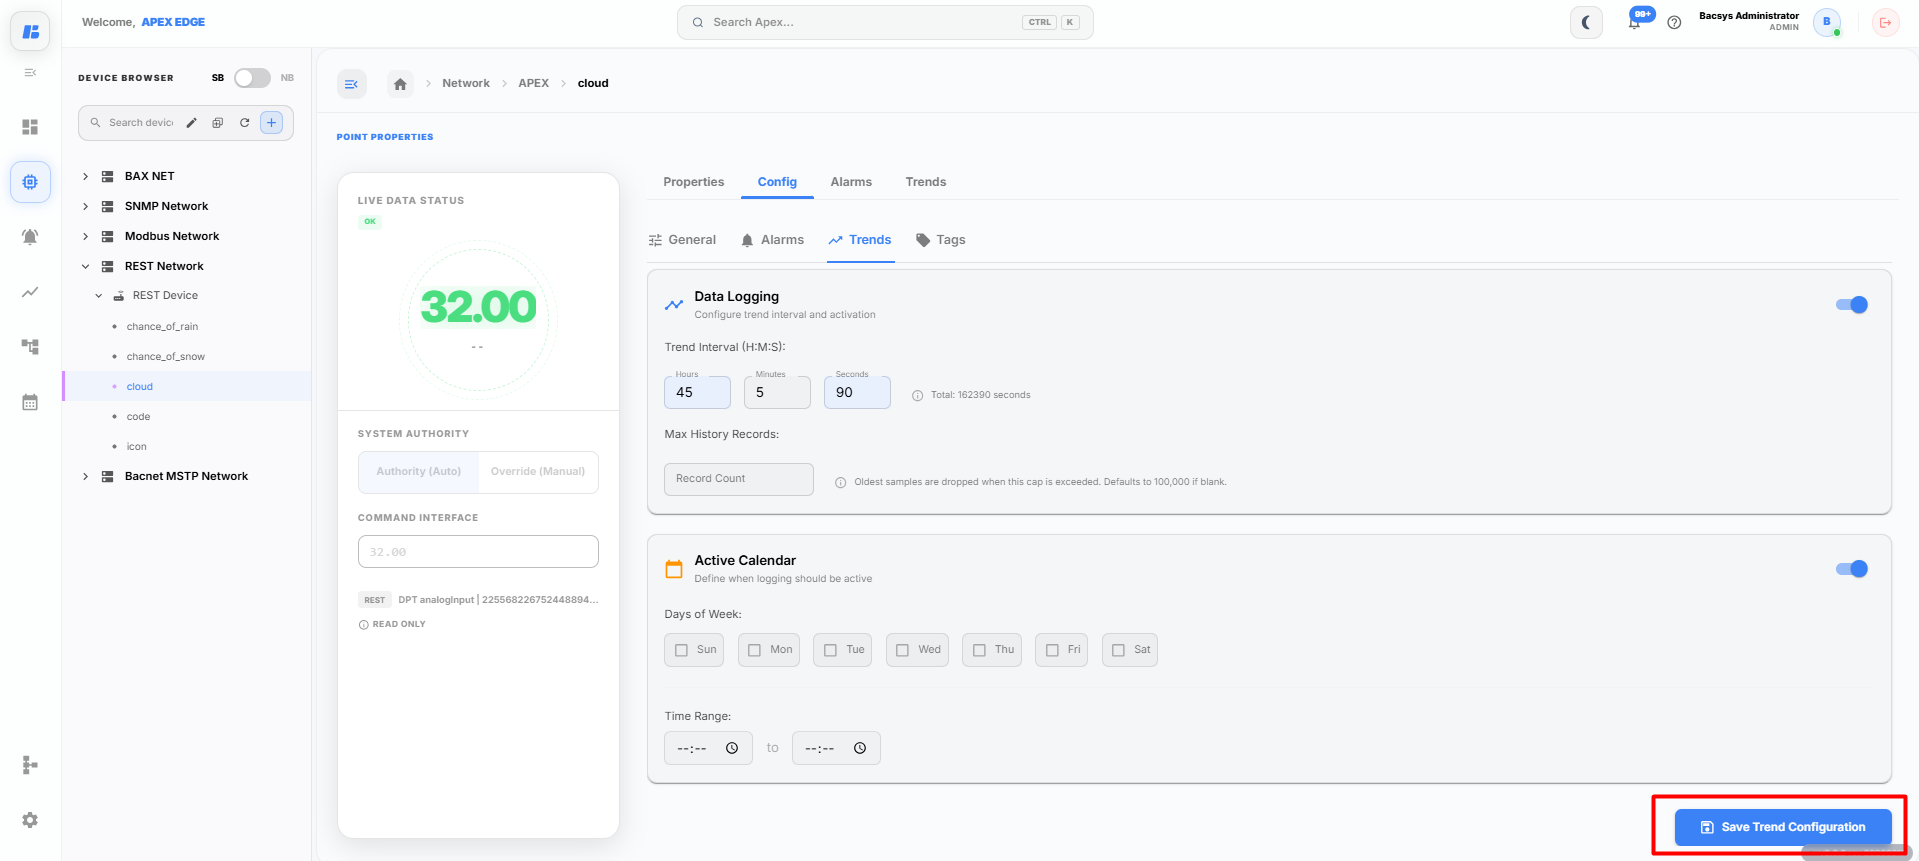
The Trends section allows you to configure data logging for the selected point.
Data Logging
Enable Data Logging and configure the following settings:
| Field | Description |
|---|---|
| Trend Interval | Specifies how frequently the point value is logged. |
| Max History Records | Specifies the maximum number of records to store. |
Active Calendar
The Active Calendar allows you to define when trend logging should be active.
Configure:
- Days of the week
- Start Time
- End Time
After completing the configuration, click Save Trend Configuration.
Tags
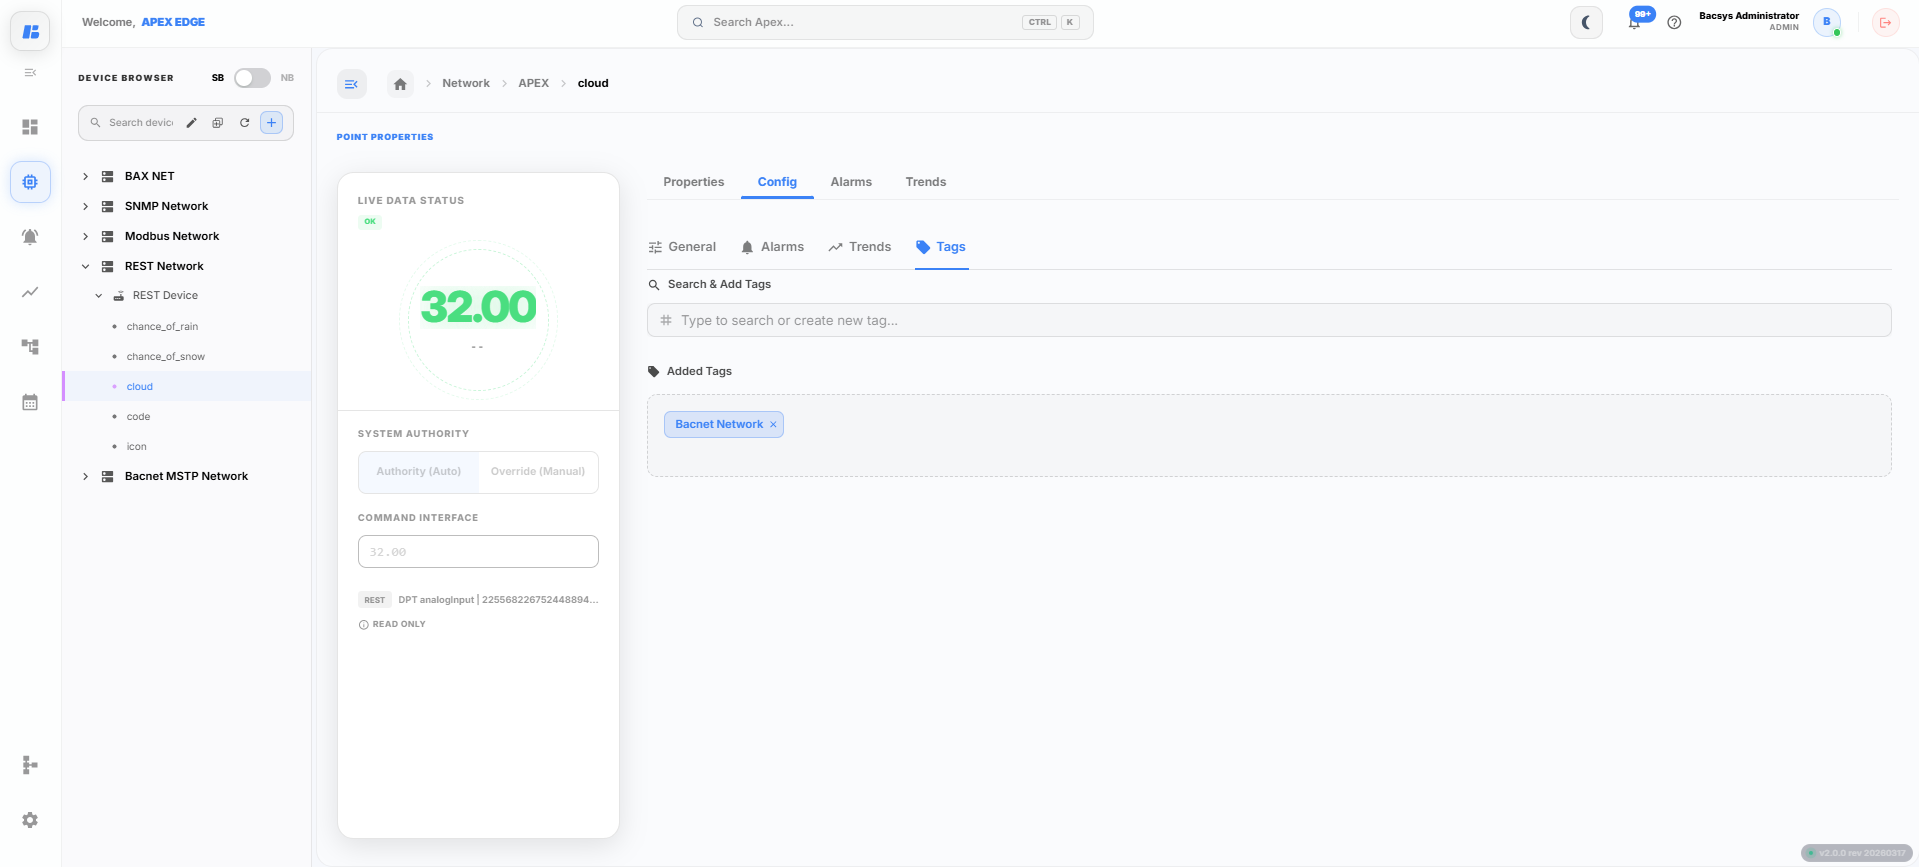
The Tags section allows you to organize points using custom tags.
To add a tag:
- Enter the tag name in the Search & Add Tags field.
- Select an existing tag or create a new one.
- The selected tag is displayed under Added Tags.
Tags help group and filter points throughout the platform.
Alarm Status
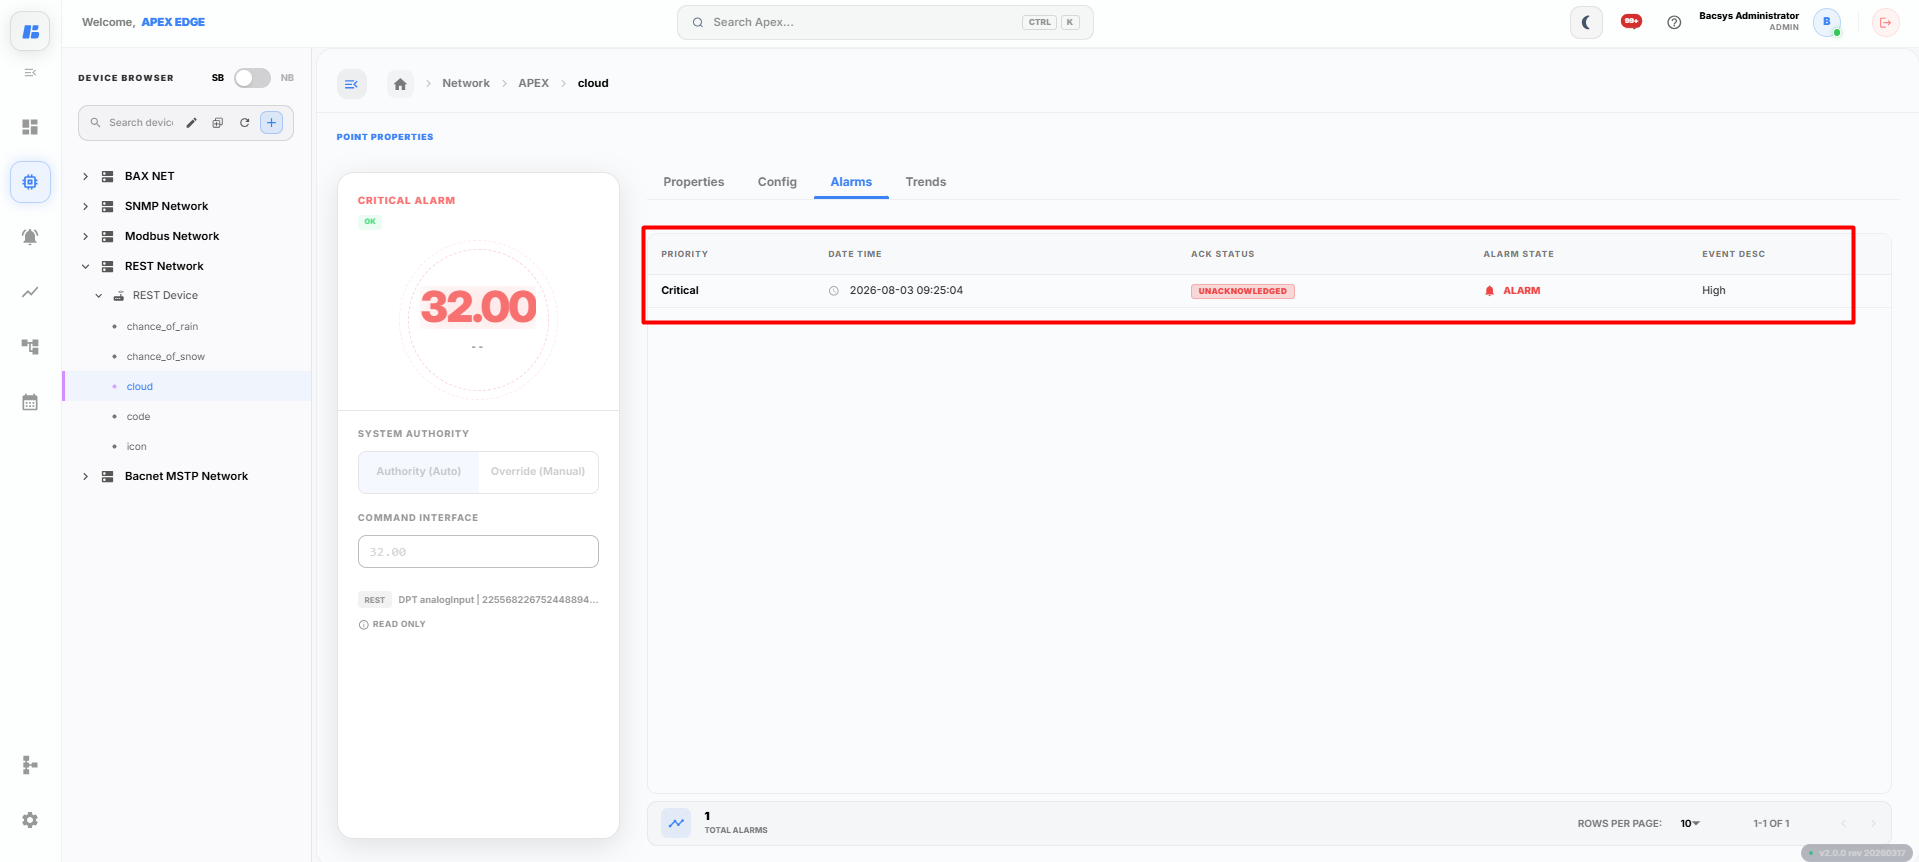
After configuring the required alarm thresholds, click Save Alarm Configuration.
The platform continuously monitors the point value against the configured alarm limits. When the point value exceeds the configured threshold, the corresponding alarm is generated.
You can verify the alarm status for the selected point by checking whether the alarm has been triggered based on the configured limits. If the point value remains within the configured threshold, no alarm is generated.
Viewing Trends
To view the historical data of a point, select the required point and click the Trends tab.
The Trends page displays the historical data in both Table and Chart views.
Table View
The Table view displays the recorded values of the selected point in a tabular format.
The following options are available:
| Option | Description |
|---|---|
| Start Date | Select the starting date for retrieving trend data. |
| End Date | Select the ending date for retrieving trend data. |
| Export | Exports the displayed trend data to a CSV file. |
| Refresh | Retrieves the latest trend data for the selected date range. |
| Clear | Clears the selected date range and displayed data. |
| Delta | Enables or disables delta value display. |
| Edit | Enables or disables edit mode using the toggle button. |
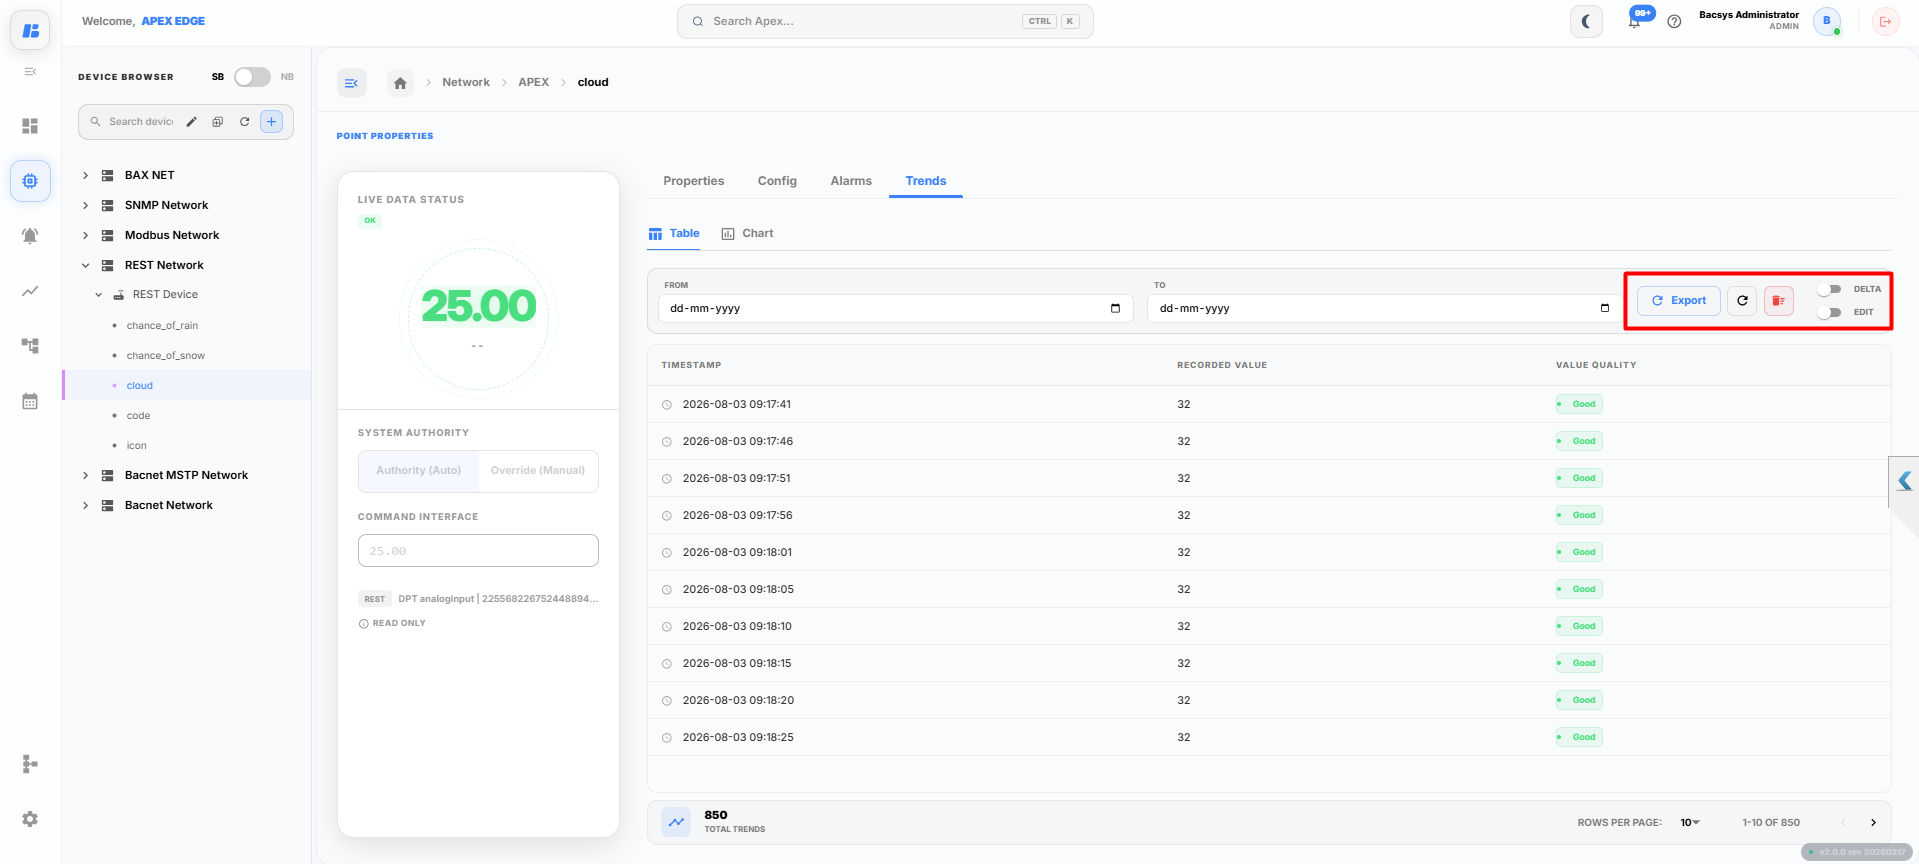
Chart View
The Chart view displays the historical data of the selected point as a graphical trend.
The following options are available:
| Option | Description |
|---|---|
| Start Date | Select the starting date for displaying trend data. |
| End Date | Select the ending date for displaying trend data. |
| Export | Exports the displayed chart data. |
| Refresh | Reloads the trend data based on the selected date range. |
| Clear | Clears the selected filters and chart data. |
| Delta | Enables or disables delta value display on the chart. |
| Edit | Enables or disables edit mode using the toggle button. |
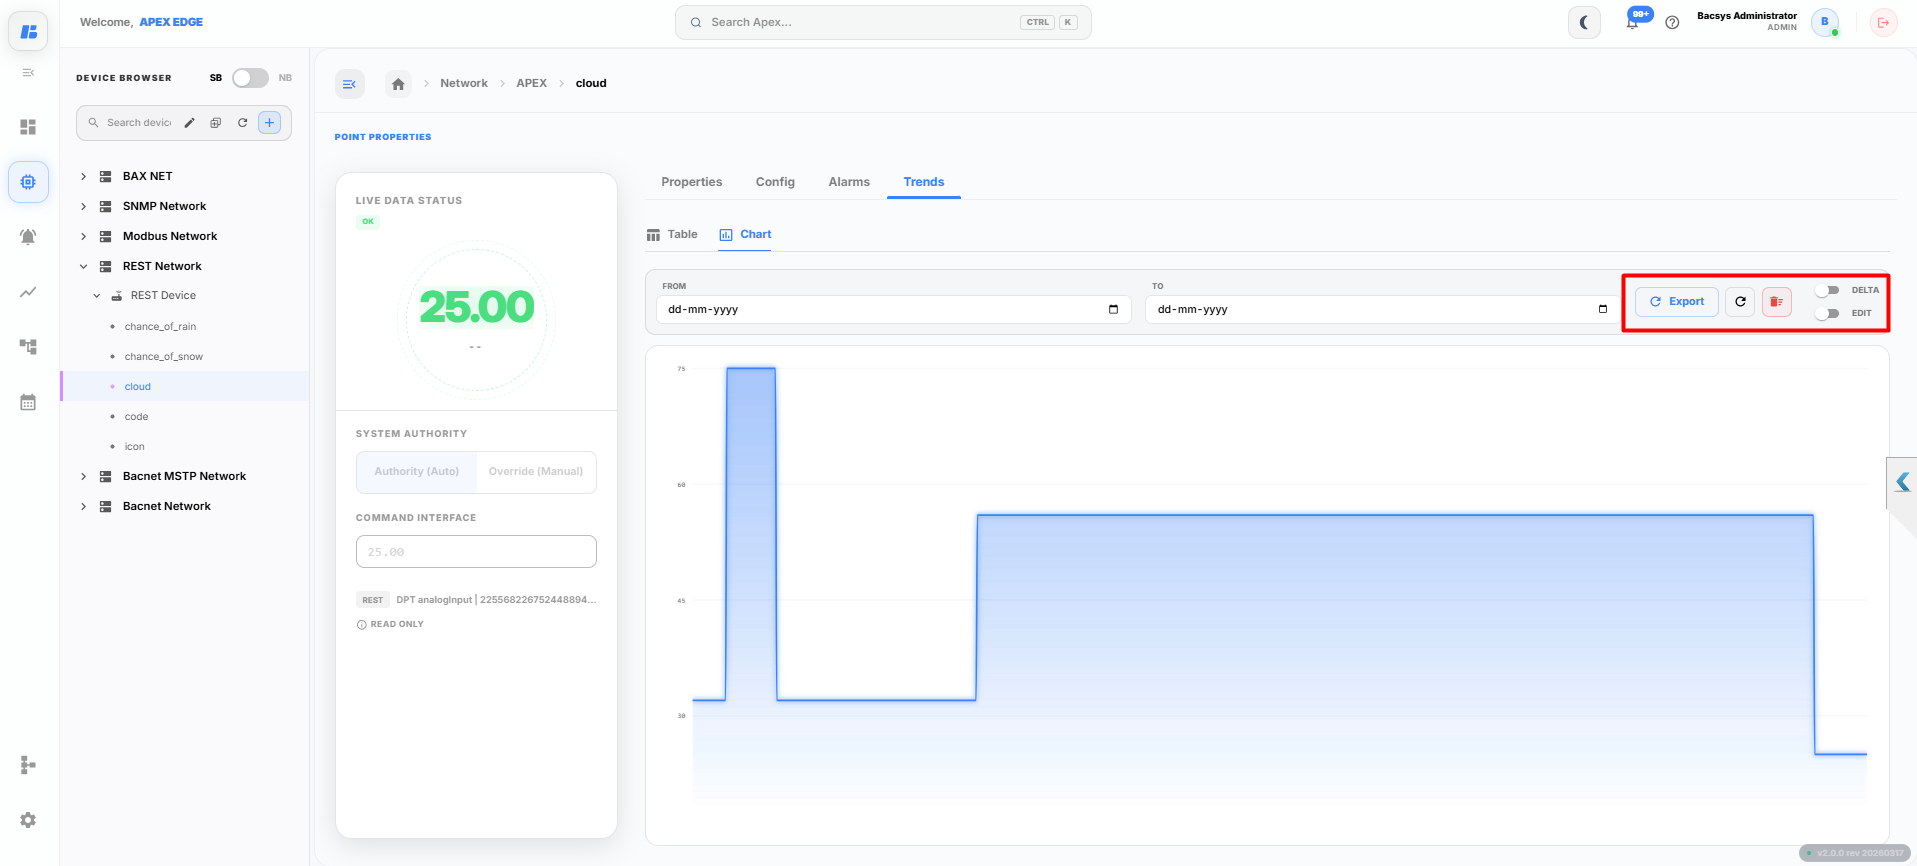
The table and chart views help users analyze historical point data over a selected period and export the data for further analysis.
Complete Workflow
Follow the steps below to configure a REST API network and monitor live data.
- Open the Devices module.
- Click the + (Add) icon and select REST API.
- Enter the required network details:
- API Name
- Base URL
- Authentication Type
- Custom Headers (if required)
- Click Test Connection to verify the REST API connection.
- Click Create Network.
- Select the newly created REST API network.
- Click Add Device.
- Enter the device details:
- Device Name
- Device Description
- Poll Frequency
- Configure the device attributes using one of the following methods:
- Fetch from API – Retrieve and select fields from the JSON response.
- Add Manually – Manually specify the required attributes and field paths.
- Click Add Device to create the device.
- Select the newly created device and click Add Points.
- Enter the Attribute Count.
- Click Add Attribute and configure the required Attribute Name and Field Path for each point.
- Click Add to create the monitoring points.
- Turn the required point On to start polling the REST API.
- Open the point to:
- View and edit Point Properties.
- Configure General, Alarms, Trends, and Tags from the Config tab.
- Configure alarm thresholds and click Save Alarm Configuration to monitor alarm status.
- Configure trend logging and click Save Trend Configuration.
- View the live values of the selected point.
- Open the Trends tab to analyze historical data using:
- Table View
- Chart View
- Export trend data, refresh the display, clear filters, or enable Delta and Edit options as required.