

Feedback Overview
5. Feedback Overview
The Feedback Overview provides a centralized view of customer feedback and satisfaction performance.
It helps users monitor fNPS, CSI, satisfaction, dissatisfaction, average ratings, feedback quality, response trends, location-based feedback, and individual feedback counter performance.
5.1 Overview Navigation
The Overview page provides the following sections:
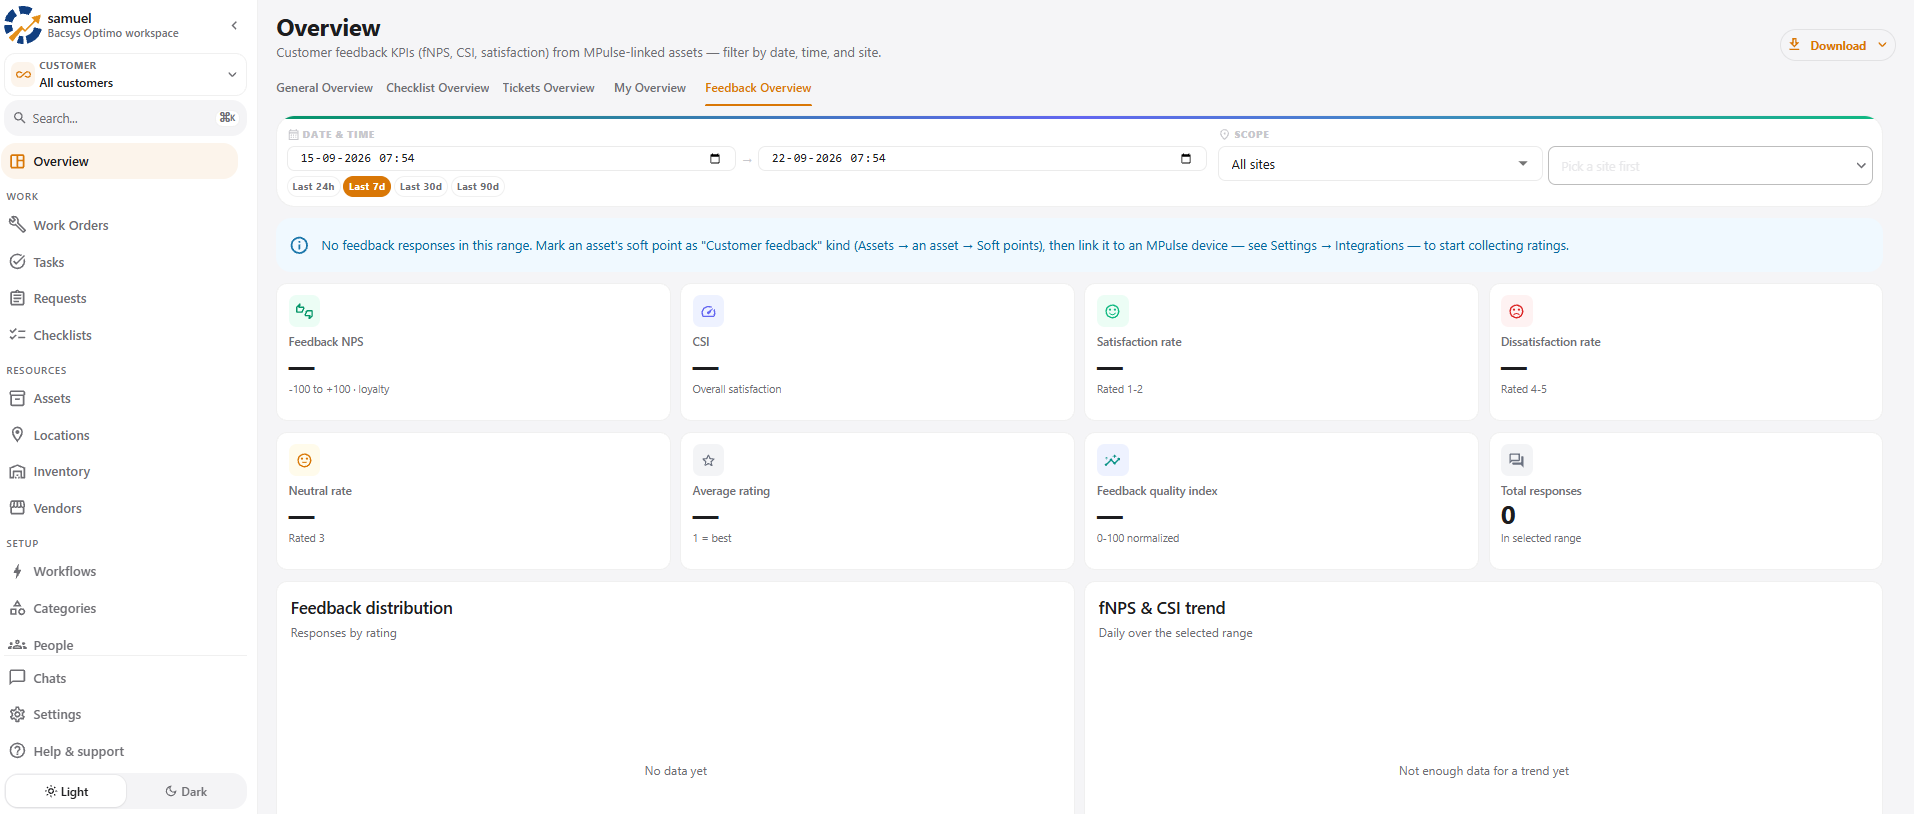
- General Overview
- Checklist Overview
- Tickets Overview
- My Overview
- Feedback Overview
Steps to Open Feedback Overview
- Navigate to the Overview section.
- Select the Feedback Overview tab.
- The Feedback Overview dashboard is displayed.
5.2 Download Report
The Download option allows users to export the Feedback Overview.
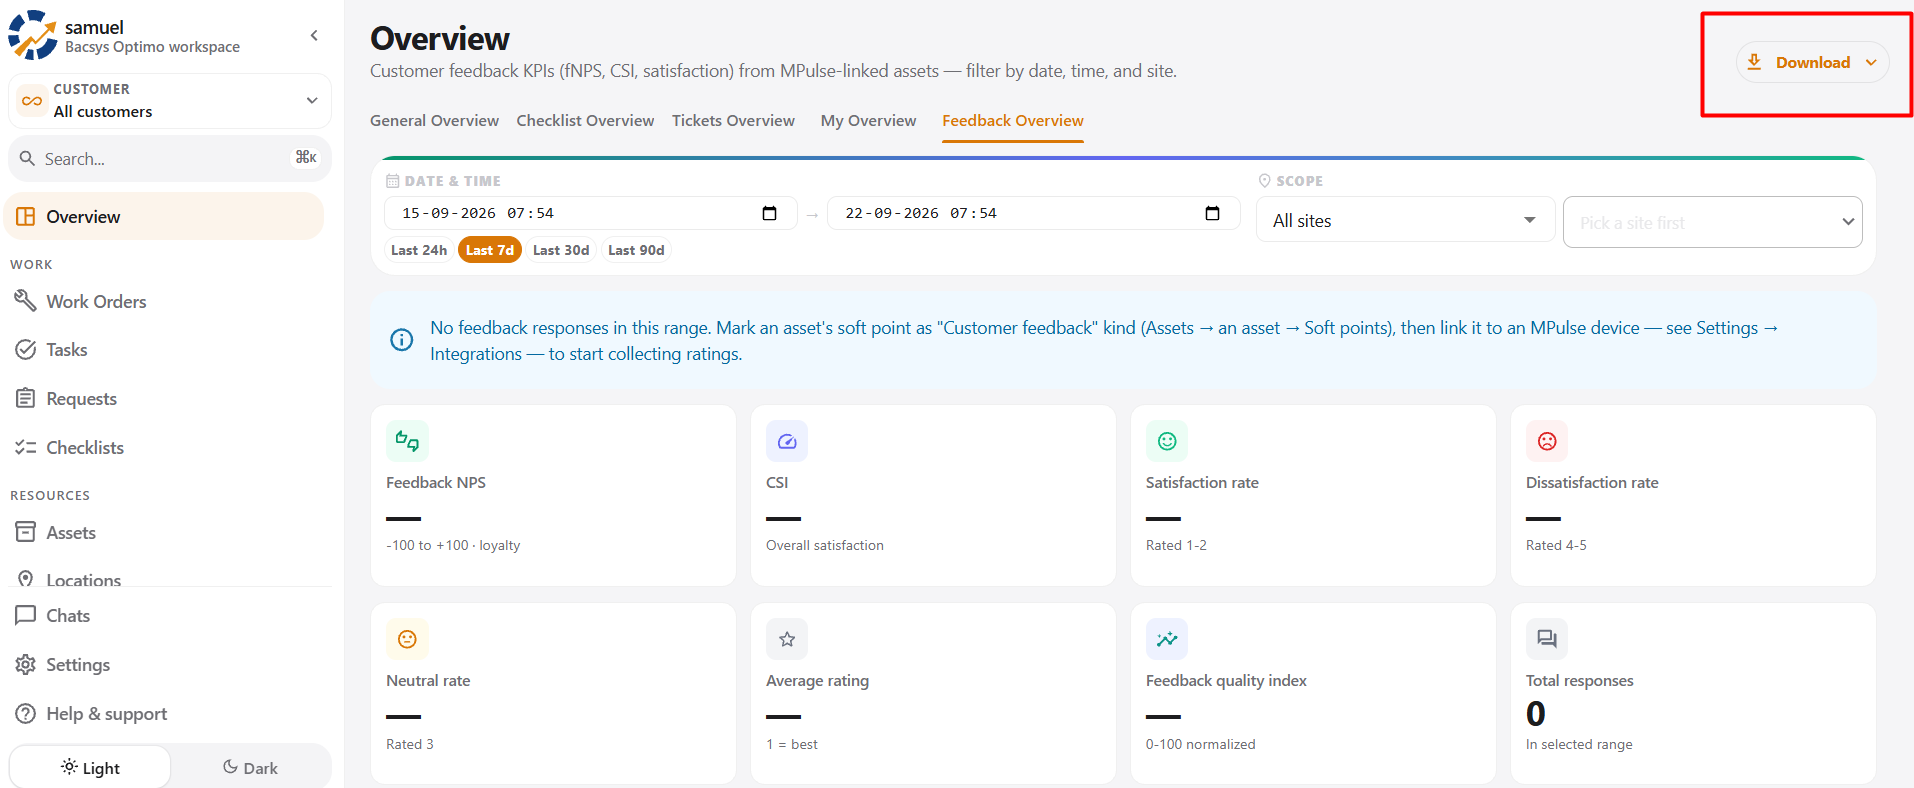
Available Formats
- PDF – Downloads the overview as a PDF document.
- PNG – Downloads the dashboard as an image.
- HTML – Downloads the overview as an HTML report.
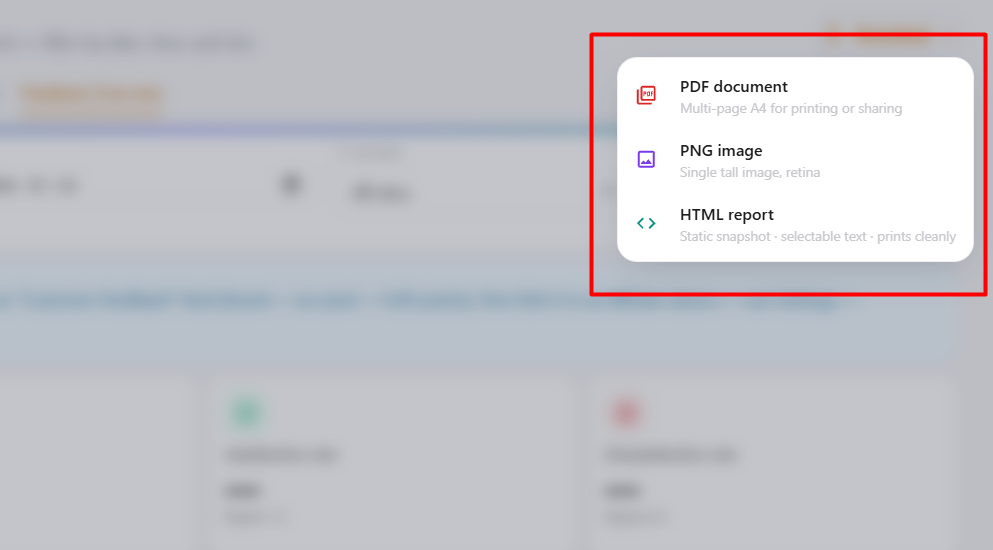
Steps to Download
- Click the Download button.
- Select PDF, PNG, or HTML.
- The report is generated and downloaded in the selected format.
5.3 Date & Time Filter
The Date & Time filter controls the period for which feedback information is displayed.
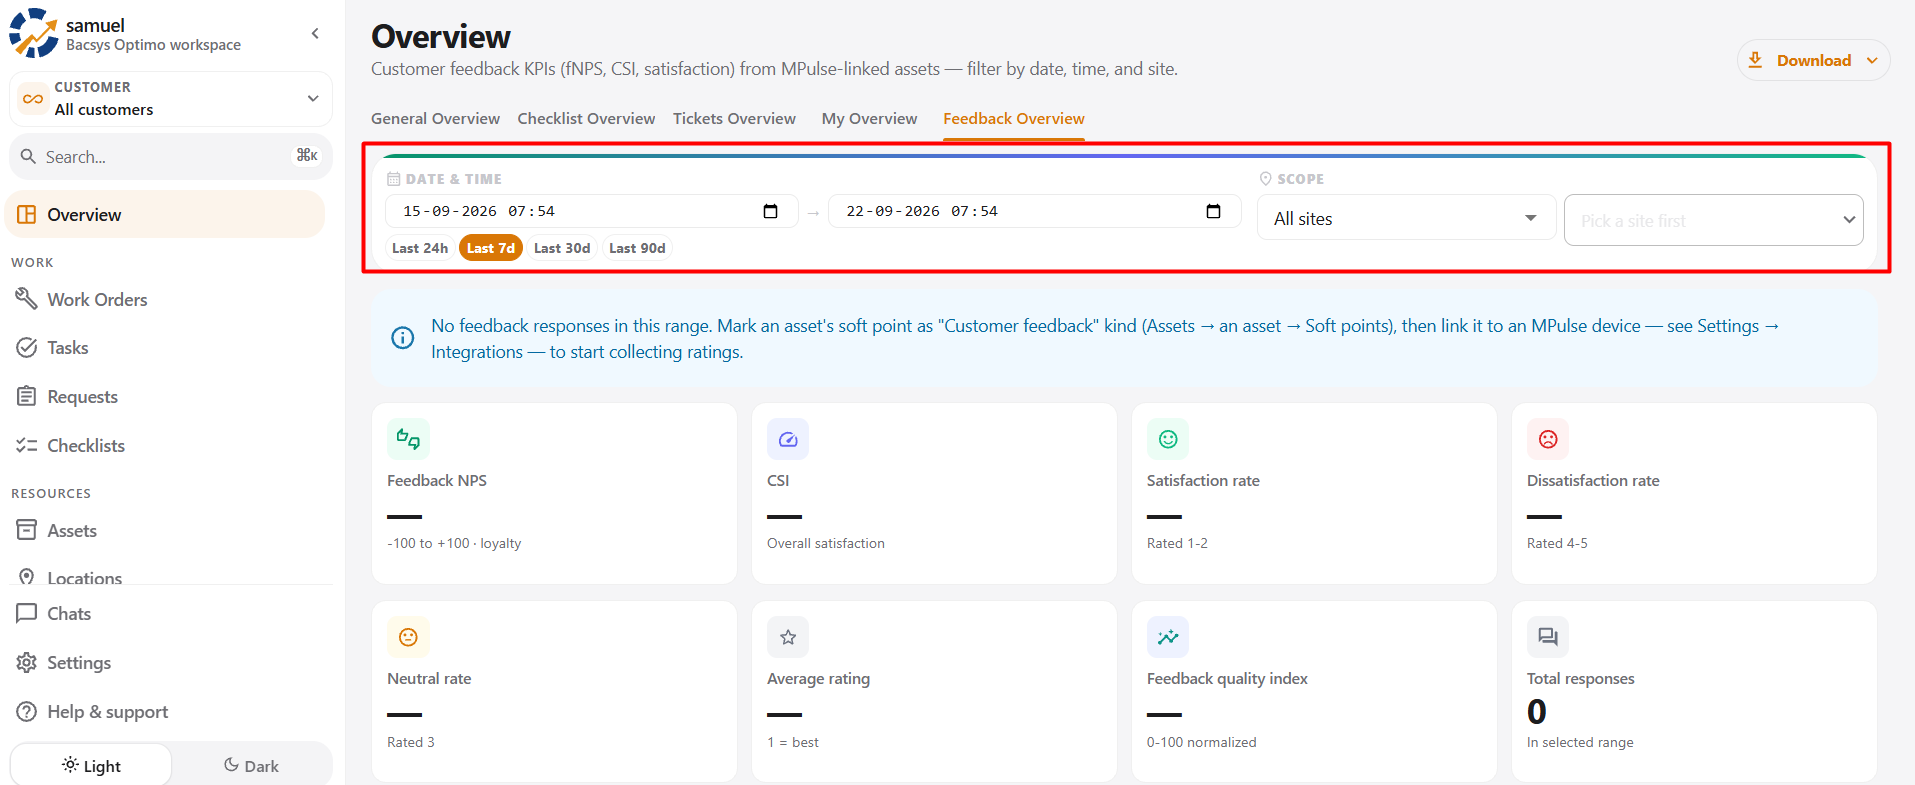
Available Options
- Custom start and end date/time
- Last 24h
- Last 7d
- Last 30d
- Last 90d
Steps to Apply Date & Time
- Select the start date and time.
- Select the end date and time.
- Alternatively, select one of the predefined periods.
- The dashboard updates according to the selected period.
Functionality Details
- All feedback metrics should reflect the selected date and time range.
- Changing the period should update the charts and tables.
- The selected period should be clearly displayed.
5.4 Scope and Site Filter
The Scope filter allows users to view feedback across all sites or a selected site.
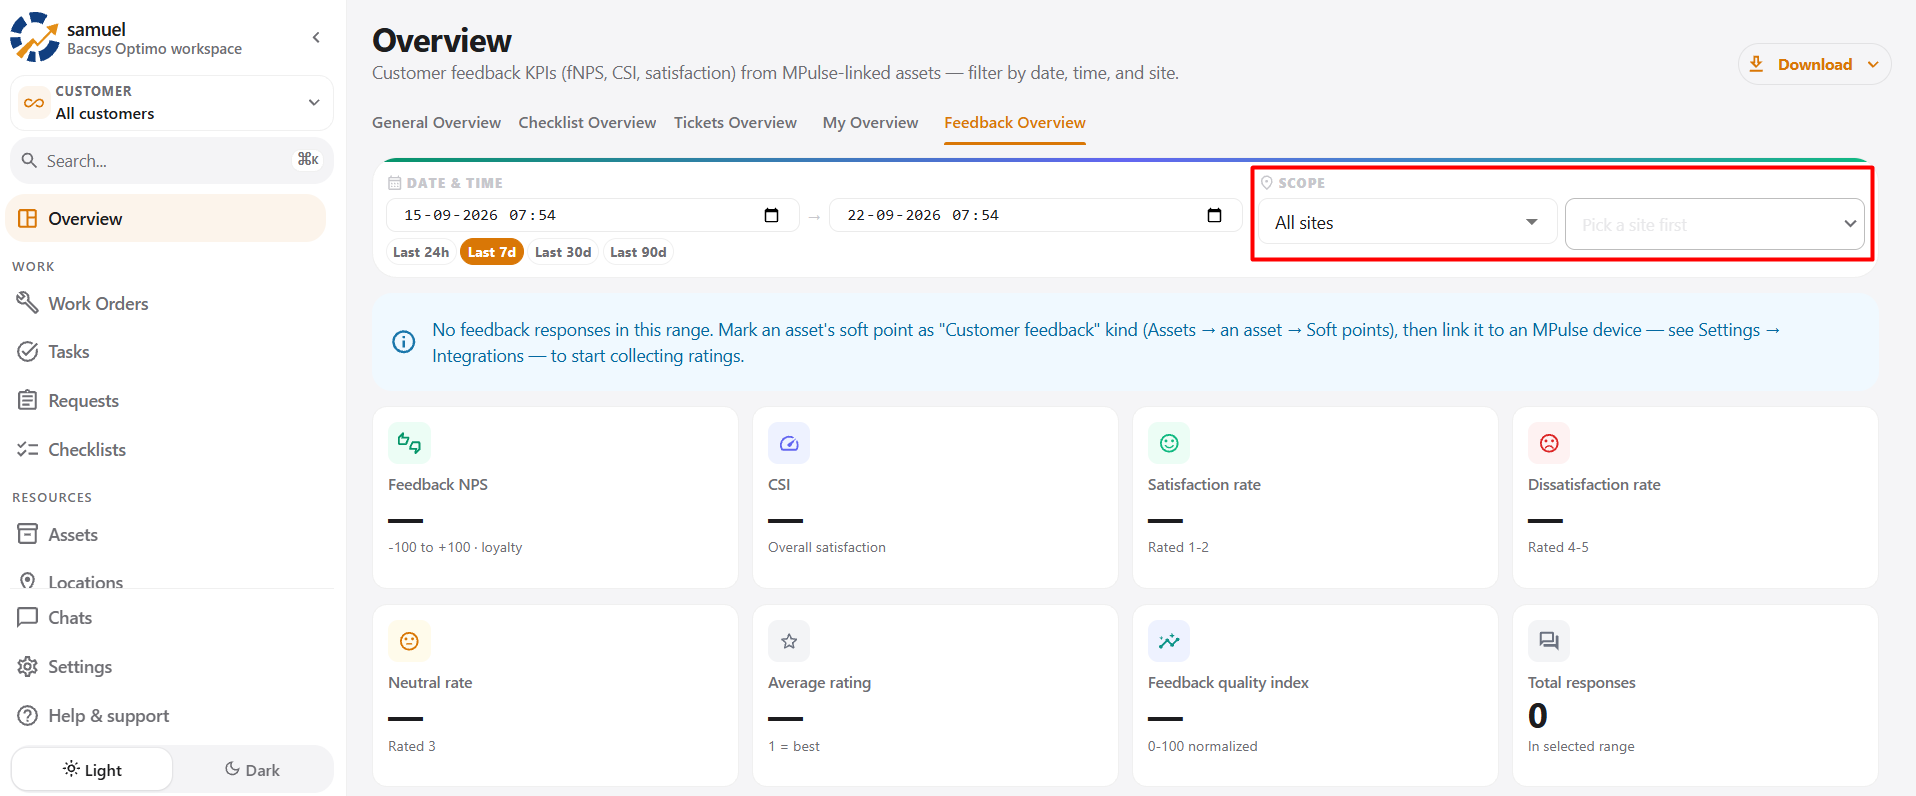
Available Options
- All Sites
- Individual site selection
A site-specific filter can be used after selecting the appropriate scope.
Steps to Filter by Site
- Open the Scope dropdown.
- Select All Sites or the required site.
- Review the updated feedback information.
- The dashboard displays feedback related to the selected scope.
Functionality Details
- The selected scope should be displayed correctly.
- Feedback metrics should update according to the selected site.
- Selecting All Sites should display feedback across all available sites.
5.6 Feedback KPI Summary
The KPI cards provide a quick summary of customer feedback performance.
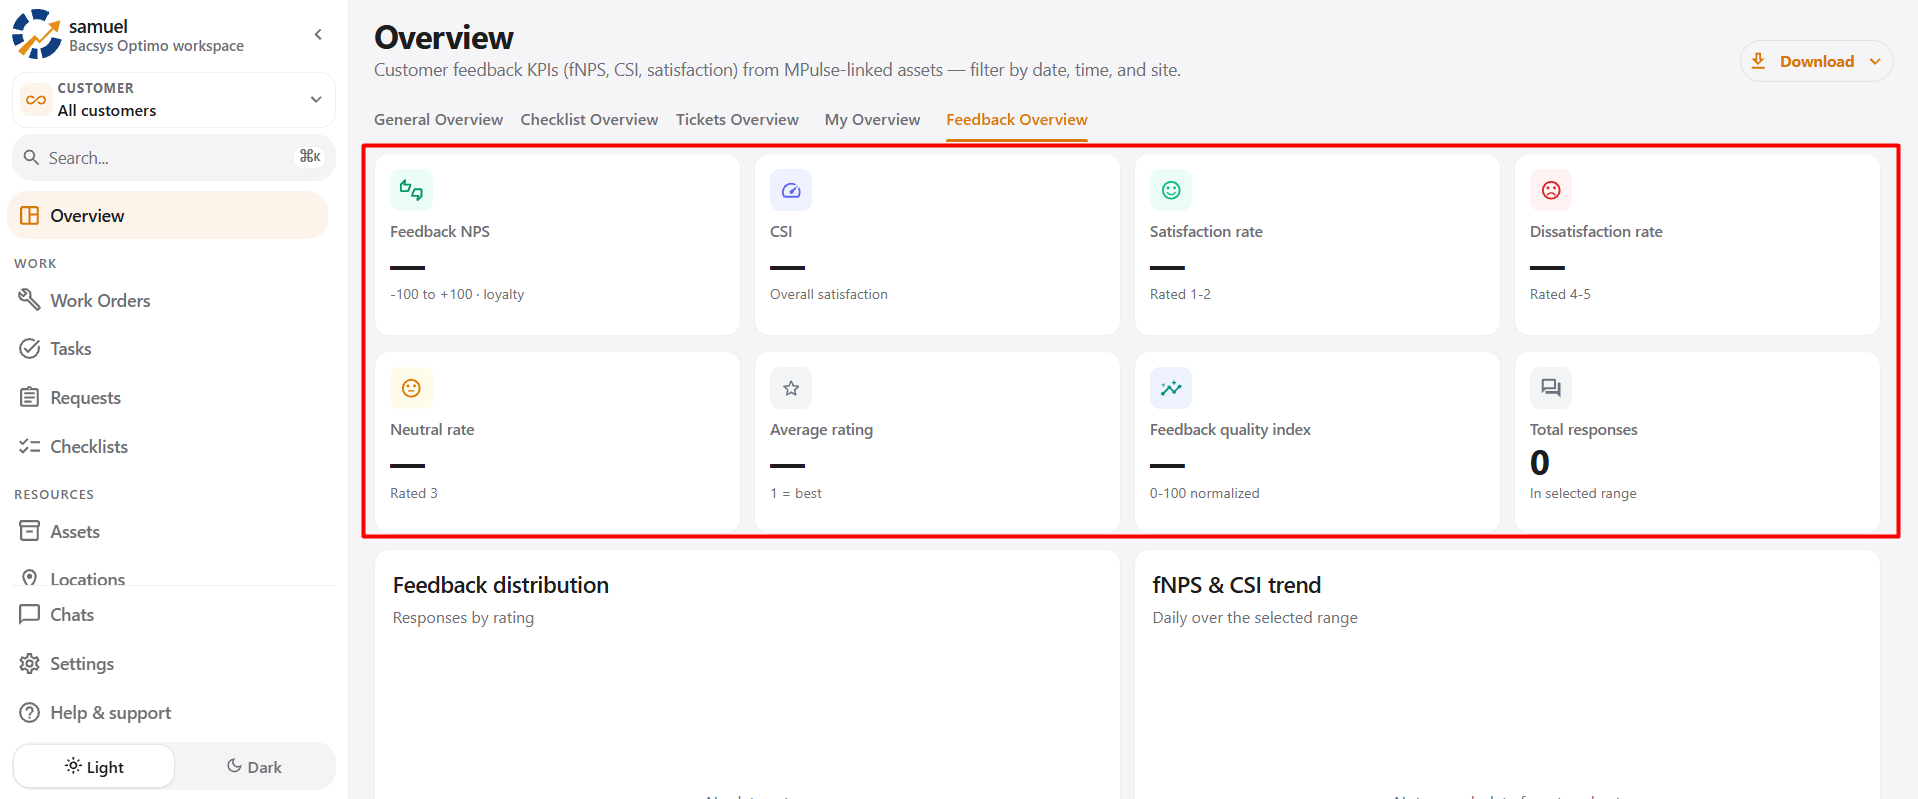
Available KPIs
- Feedback NPS
- CSI
- Satisfaction Rate
- Dissatisfaction Rate
- Neutral Rate
- Average Rating
- Feedback Quality Index
- Total Responses
5.7 Feedback NPS
Feedback NPS represents the Net Promoter Score calculated from customer feedback.
It indicates the overall customer loyalty or recommendation level based on the configured feedback rating.
The score is represented on a scale from -100 to +100.
Functionality Details
- The NPS should be calculated from the feedback responses in the selected period.
- The value should update when the date or site filter changes.
- If there are no responses, an appropriate empty or unavailable value should be displayed.
5.8 CSI
CSI (Customer Satisfaction Index) represents the overall customer satisfaction based on the collected feedback.
Functionality Details
- CSI should be calculated from applicable feedback responses.
- The value should reflect the selected date and site filters.
- The KPI should update when new feedback responses are available.
5.9 Satisfaction Rate
The Satisfaction Rate represents the percentage of positive customer feedback responses.
The dashboard calculates this based on the configured rating criteria.
Functionality Details
- The rate should be calculated from applicable feedback responses.
- The displayed percentage should correspond to the selected reporting period.
- The value should update when the filters change.
5.10 Dissatisfaction Rate
The Dissatisfaction Rate represents the percentage of feedback responses classified as dissatisfied.
The calculation is based on the configured feedback rating rules.
Functionality Details
- The rate should reflect applicable negative feedback.
- The value should update according to the selected period and site.
- The displayed percentage should correspond to the available responses.
5.11 Neutral Rate
The Neutral Rate represents the percentage of feedback responses classified as neutral.
The neutral category is based on the configured rating criteria.
Functionality Details
- Neutral responses should be calculated correctly.
- The percentage should reflect the selected reporting period.
- The value should update when the filters change.
5.12 Average Rating
The Average Rating displays the average customer rating from the feedback responses.
The rating scale is based on the configured feedback system.
Functionality Details
- The average should be calculated from applicable responses.
- The displayed value should reflect the selected date and site filters.
- The average should update when new responses are available.
5.13 Feedback Quality Index
The Feedback Quality Index provides a normalized measure of feedback quality.
It is displayed on a 0–100 scale.
Functionality Details
- The index should be calculated using the configured feedback quality logic.
- The value should reflect the selected feedback data.
- The KPI should update when the reporting filters change.
5.14 Total Responses
The Total Responses card displays the total number of customer feedback responses received within the selected range.
Steps to Review
- Select the required date and time range.
- Select the required site or scope.
- Review the Total Responses KPI.
- Use the count as the basis for interpreting the other feedback metrics.
Functionality Details
- The count should include responses within the selected range.
- The count should update when the date or site filter changes.
- If no responses are available, an appropriate empty-state message should be displayed.
5.15 Feedback Distribution
The Feedback Distribution section displays the distribution of customer responses according to their ratings.
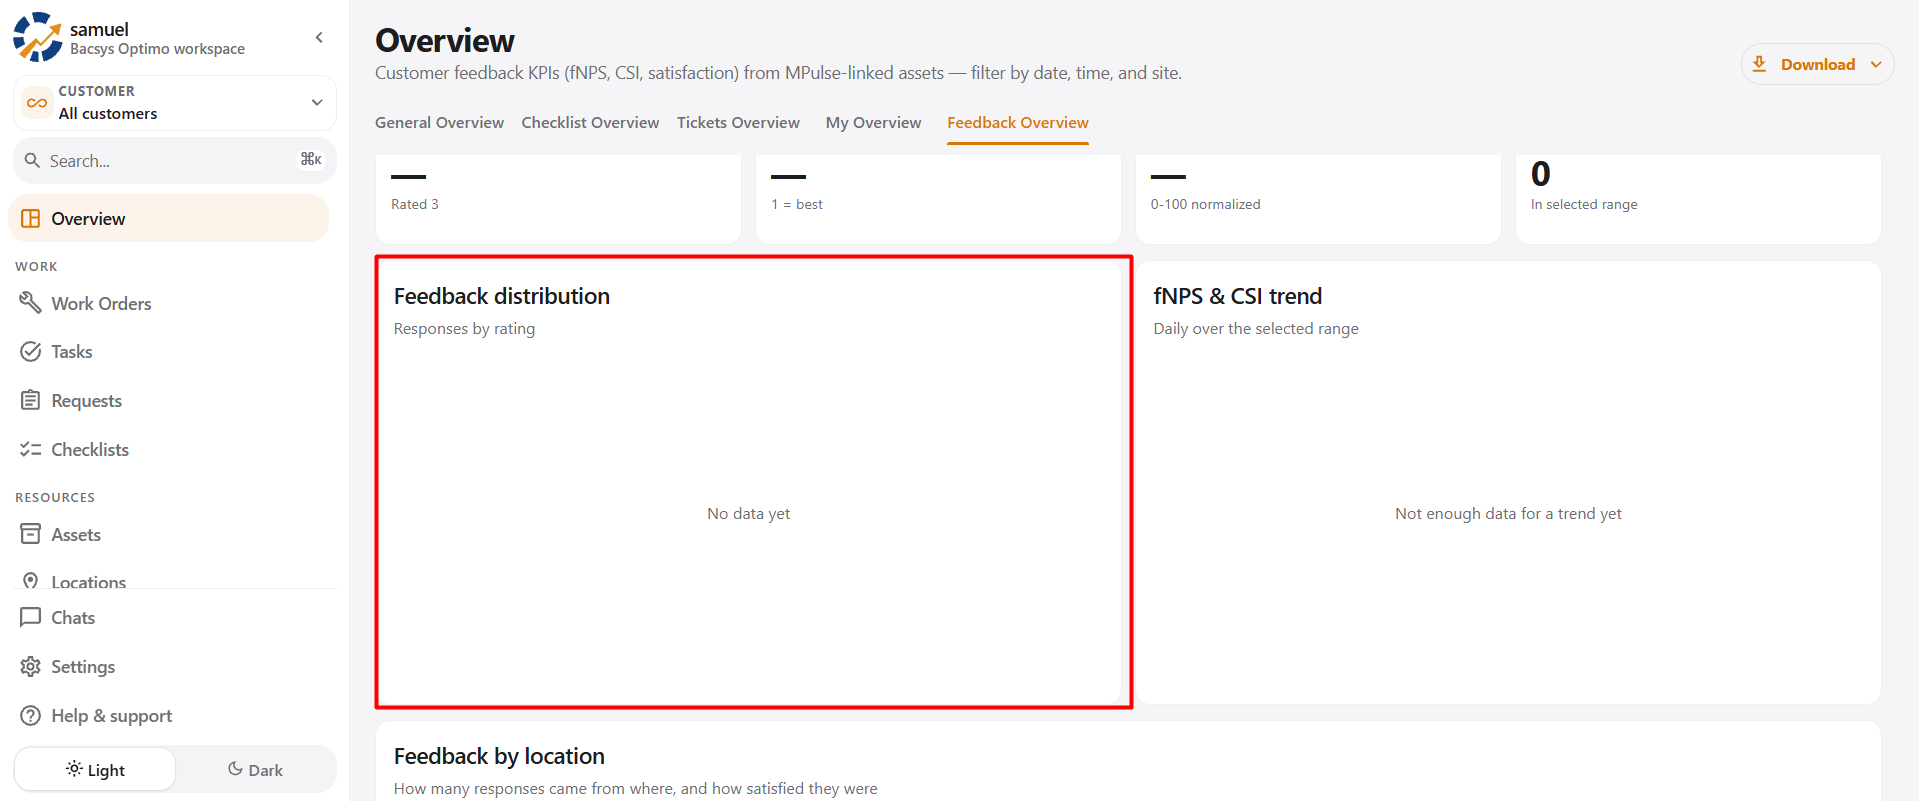
Information Displayed
- Feedback ratings
- Number of responses for each rating
- Rating distribution
Steps to Review
- Navigate to Feedback Distribution.
- Review the available rating categories.
- Check the number of responses for each rating.
- Compare the distribution of customer feedback.
Functionality Details
- Ratings should be grouped correctly.
- Response counts should match the selected period and site.
- The distribution should update when the filters change.
- If no feedback is available, an appropriate empty-state message should be displayed.
5.16 fNPS & CSI Trend
The fNPS & CSI Trend section displays feedback performance over time.
It helps users identify changes in customer satisfaction and feedback trends.
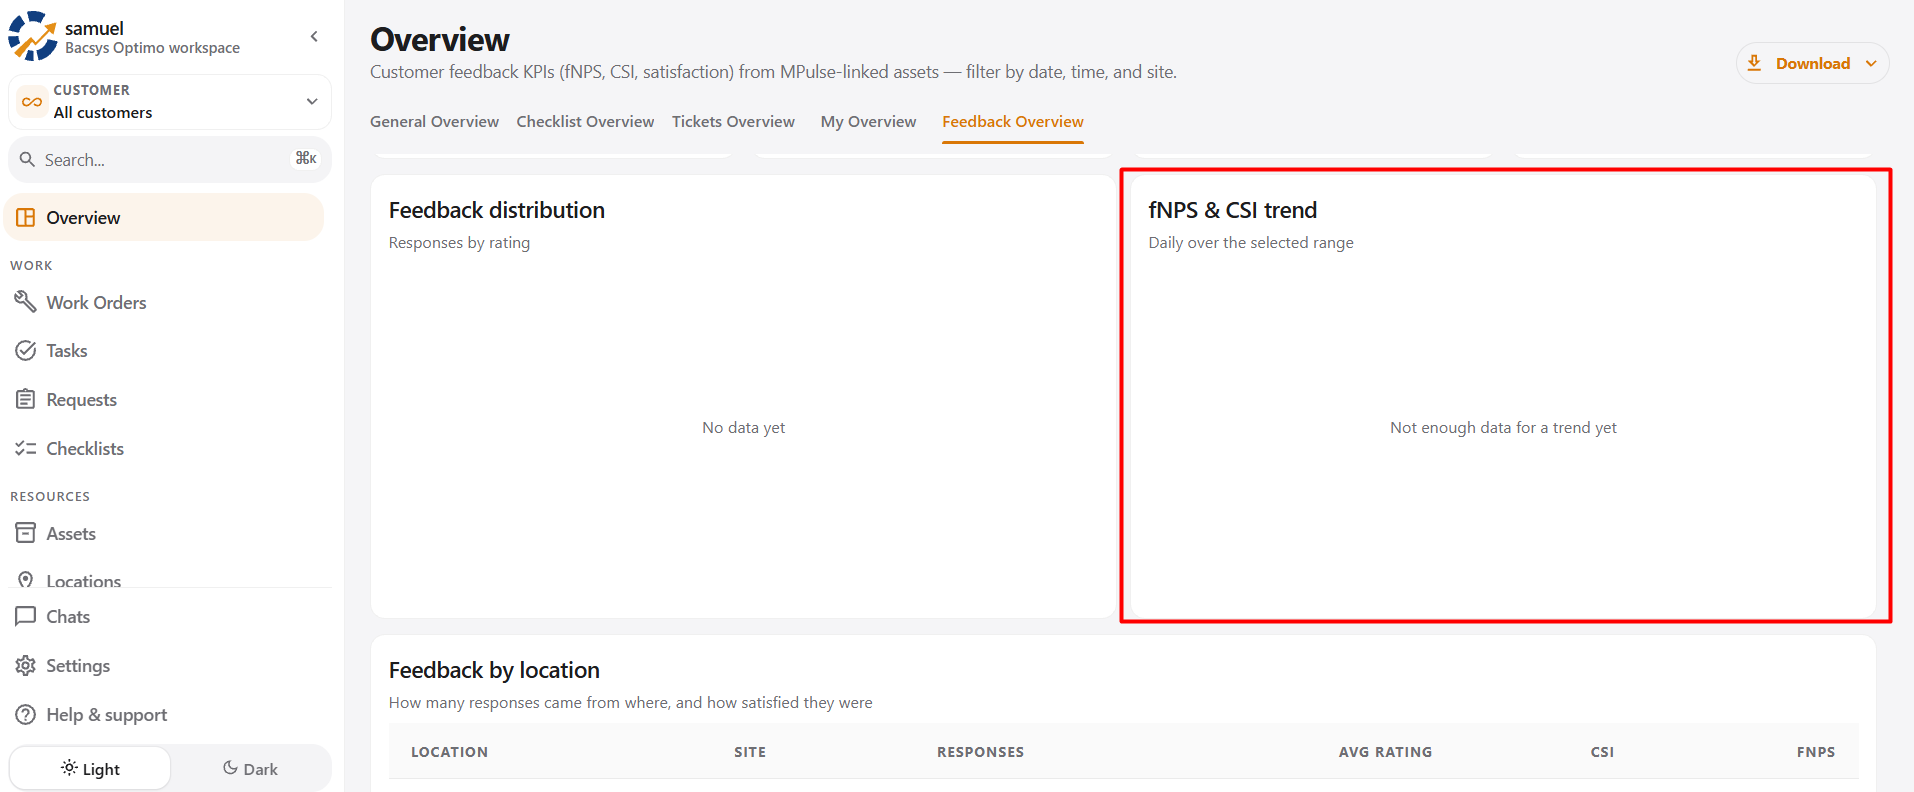
Information Displayed
- Daily fNPS
- Daily CSI
- Trend over the selected period
Steps to Review
- Navigate to fNPS & CSI Trend.
- Select the required date range.
- Review the daily feedback trend.
- Compare changes in fNPS and CSI over time.
Functionality Details
- Trend data should correspond to the selected date range.
- fNPS and CSI should be calculated from the applicable feedback responses.
- The chart should update when filters change.
- If insufficient feedback data exists, an appropriate message should be displayed.
5.17 Feedback by Location
The Feedback by Location section displays feedback performance based on location and site.
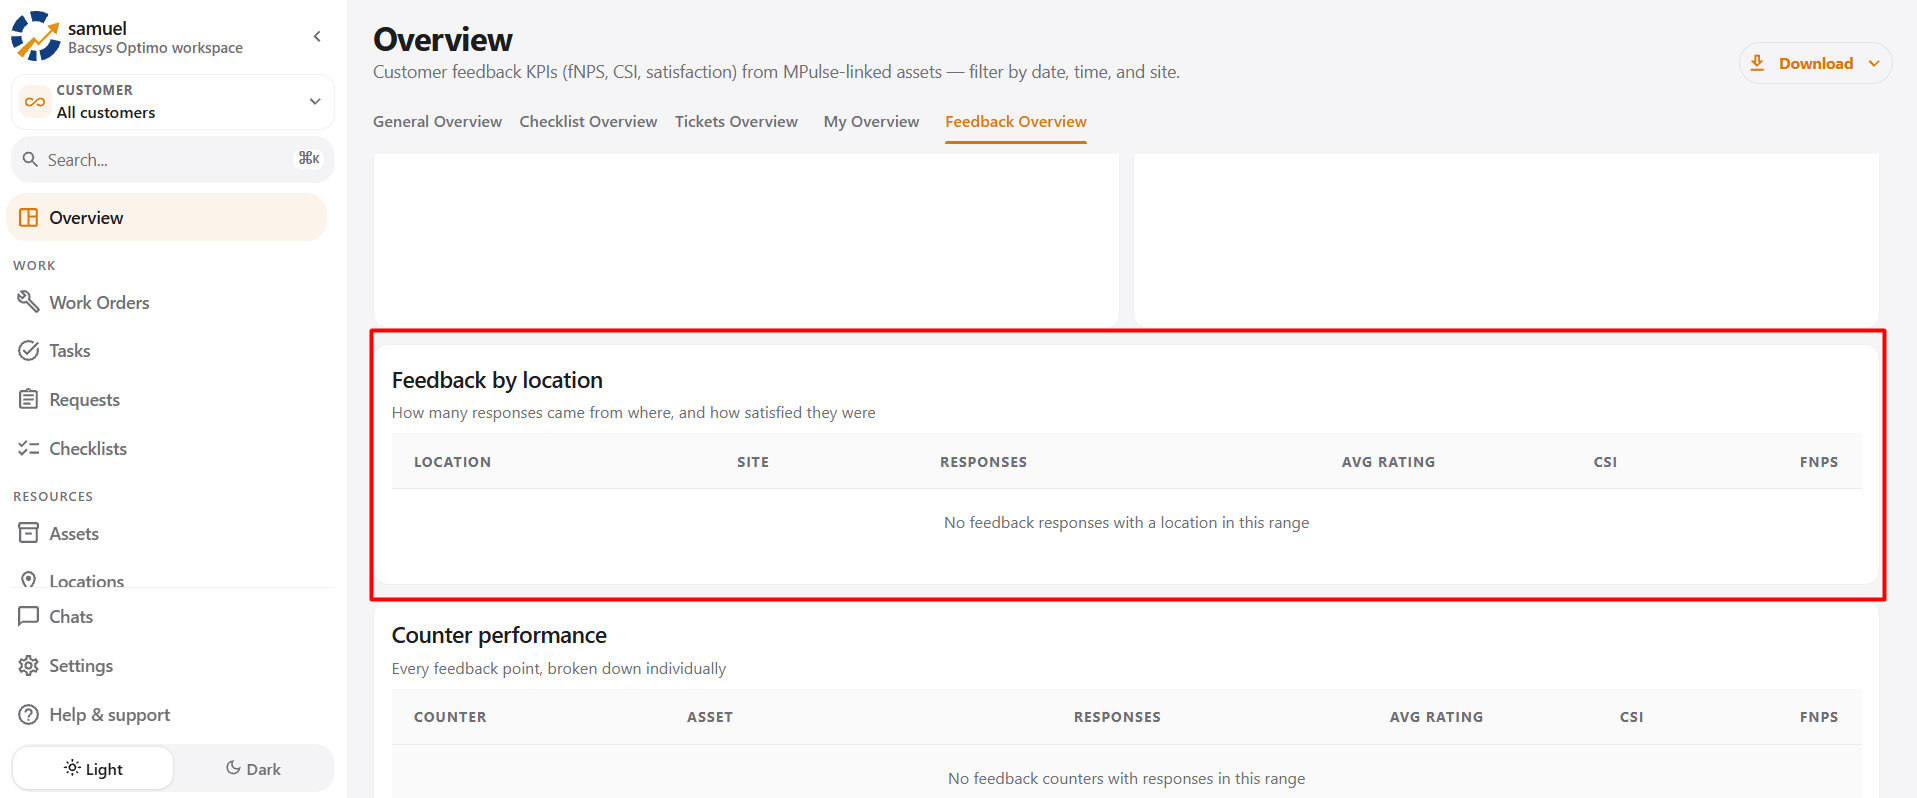
Information Displayed
- Location
- Site
- Number of responses
- Average rating
- CSI
- fNPS
Steps to Review
- Navigate to Feedback by Location.
- Review the available locations.
- Check the number of feedback responses.
- Review the average rating, CSI, and fNPS.
- Compare feedback performance between locations.
Functionality Details
- Location information should be displayed correctly.
- Response counts should match the selected filters.
- Average rating, CSI, and fNPS should correspond to the relevant location.
- If no location-based feedback exists, an appropriate empty-state message should be displayed.
5.18 Counter Performance
The Counter Performance section provides feedback performance for individual feedback counters associated with assets.
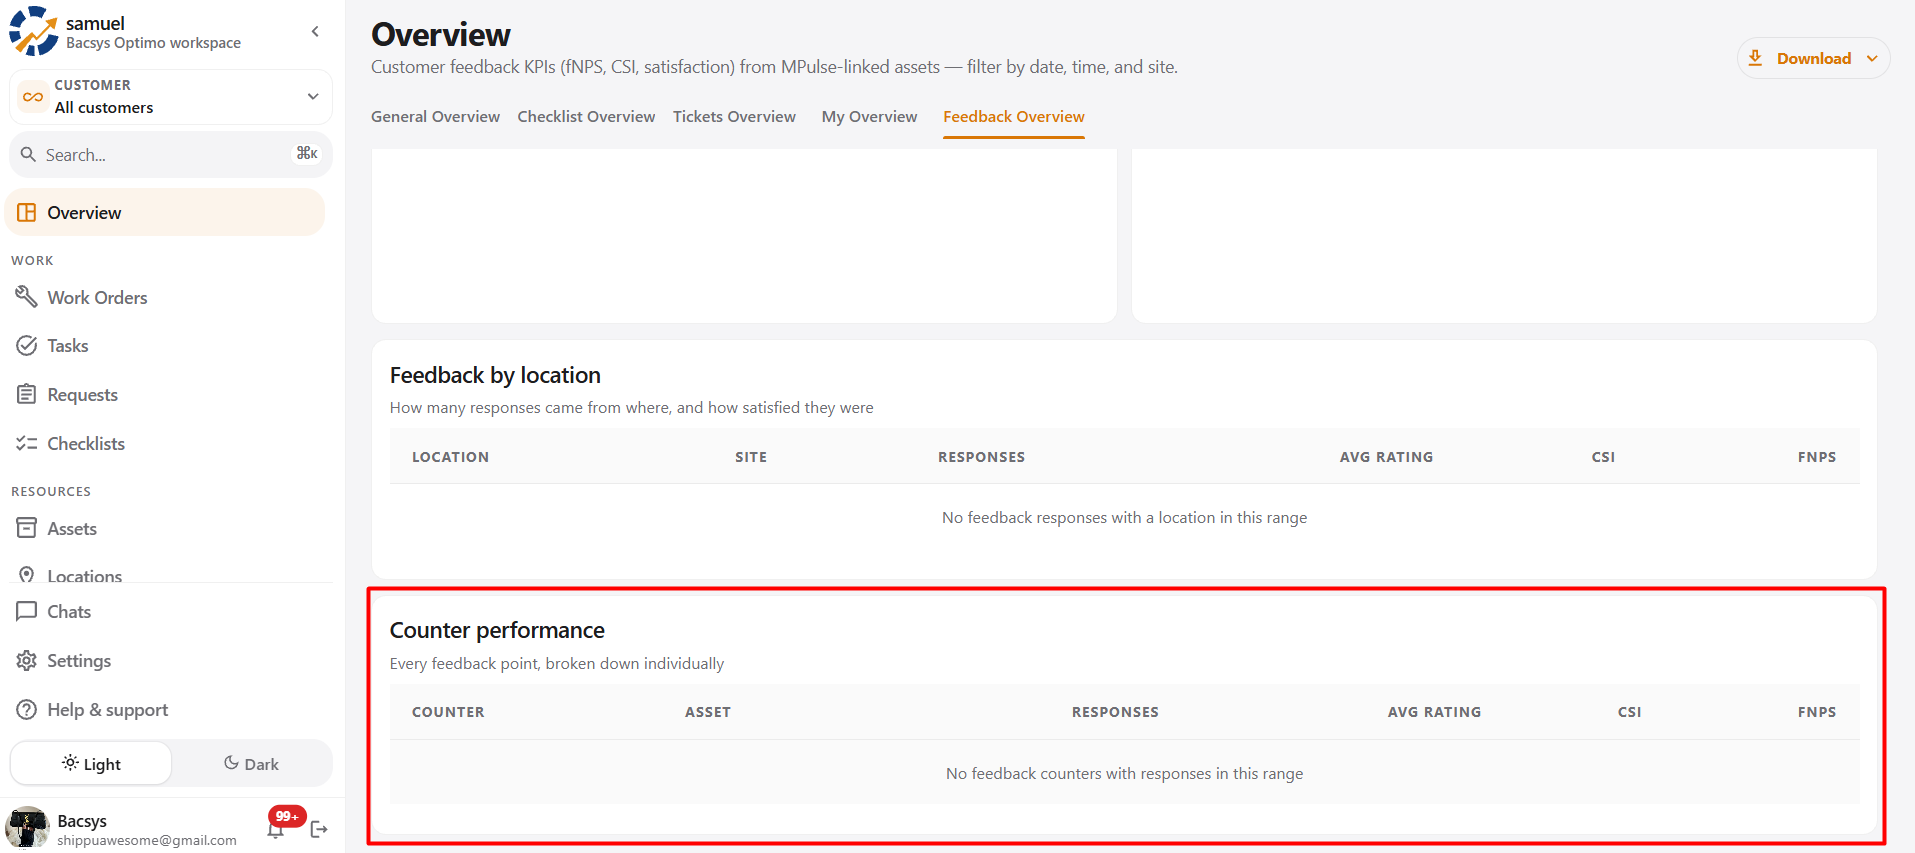
Information Displayed
- Counter
- Associated asset
- Number of responses
- Average rating
- CSI
- fNPS
Steps to Review
- Navigate to Counter Performance.
- Review the available feedback counters.
- Check the associated asset.
- Review the number of responses.
- Review the average rating, CSI, and fNPS.
Functionality Details
- Each feedback counter should be displayed with its associated asset.
- Response counts should be accurate.
- Performance metrics should correspond to the selected counter.
- The data should reflect the selected date and site filters.
- If no feedback counter has responses, an appropriate empty-state message should be displayed.
5.19 Empty-State Handling
When no feedback data is available for the selected period or site, the dashboard should clearly indicate that there is no available data.
Empty states may be displayed for:
- Feedback KPIs
- Feedback Distribution
- fNPS & CSI Trend
- Feedback by Location
- Counter Performance
Users should verify the selected date range, site, and feedback configuration when no data is displayed.
5.20 Overall Workflow
Users can review customer feedback using the following workflow:
- Open Overview.
- Select Feedback Overview.
- Select the required Date & Time range.
- Select All Sites or a specific site.
- Review the feedback KPI summary.
- Check Feedback NPS and CSI.
- Review Satisfaction, Dissatisfaction, and Neutral rates.
- Check the Average Rating.
- Review the Feedback Quality Index.
- Check the Total Responses.
- Review Feedback Distribution by rating.
- Check the fNPS & CSI Trend.
- Review Feedback by Location.
- Review individual Counter Performance.
- If no feedback is available, verify the feedback configuration and selected filters.
- Use Download to export the overview as PDF, PNG, or HTML.