

General Overview
General Overview
1. Overview
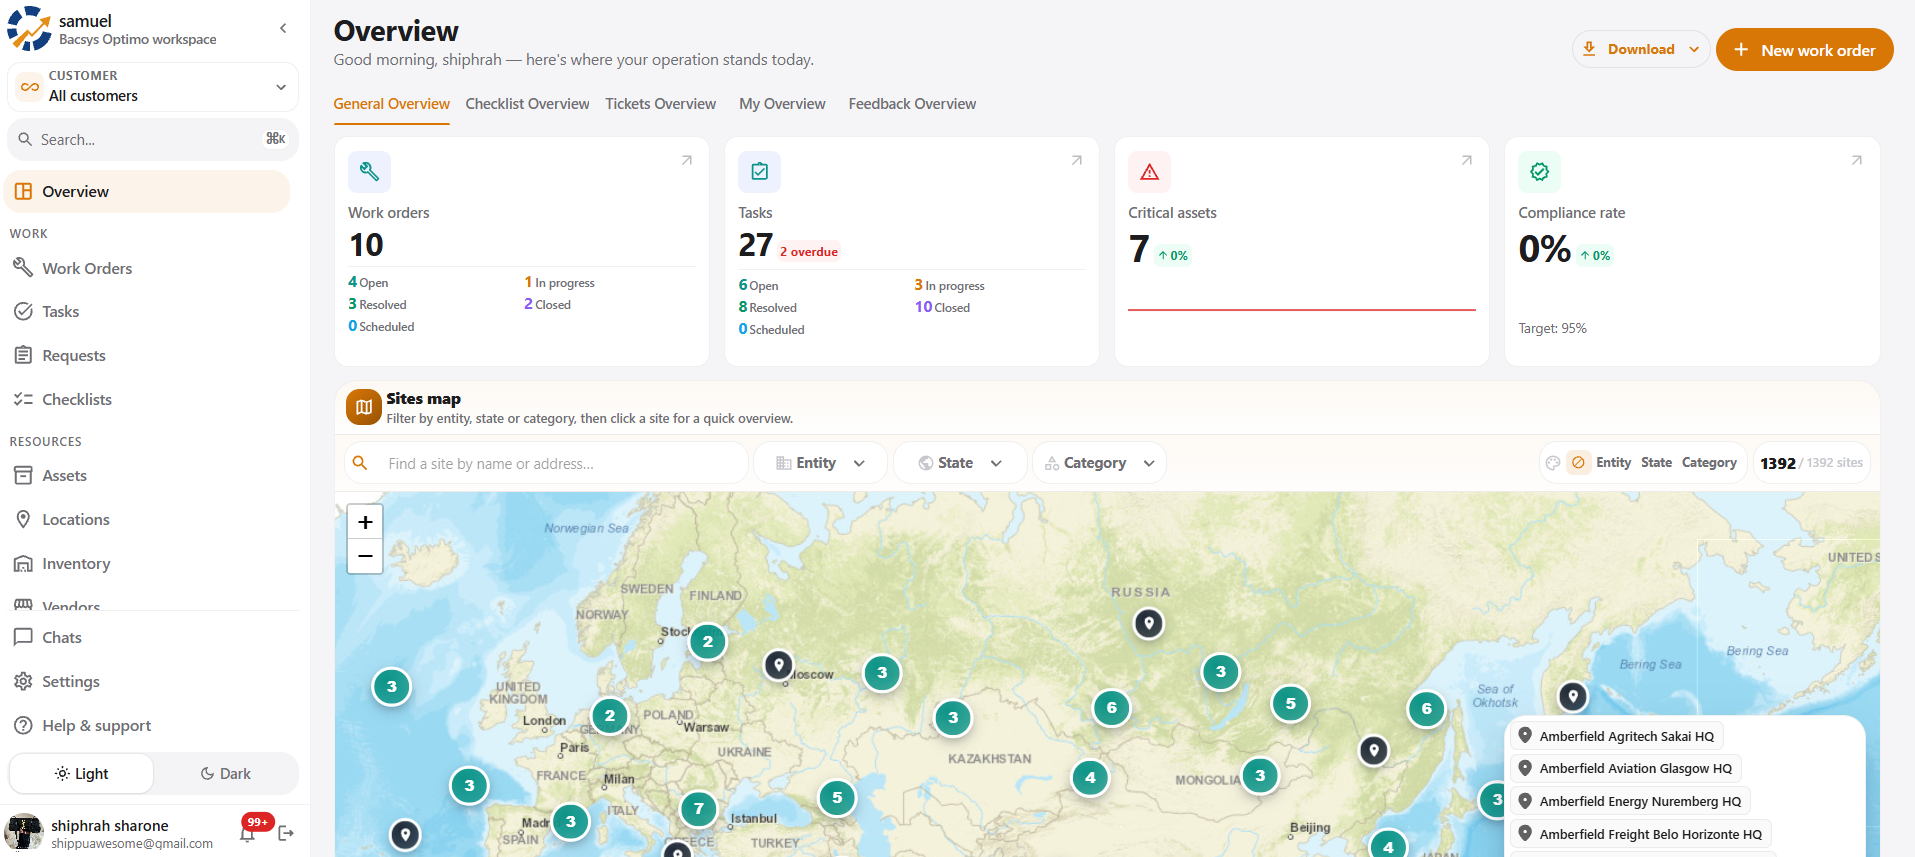
The General Overview page is the main dashboard of the Optimo platform.
It provides a centralized view of maintenance operations, work orders, tasks, asset health, site information, technician performance, maintenance activities, and maintenance costs.
The Overview page allows users to monitor maintenance operations, identify critical issues, track progress, and navigate to different Optimo modules.
When users log in to the Optimo application, the Overview page serves as the primary dashboard.
2. Overview Page Header
The header section is displayed at the top of the Overview page.
It contains the following elements:
- Personalized greeting
- Download button
- New Work Order button
2.1 Download Button
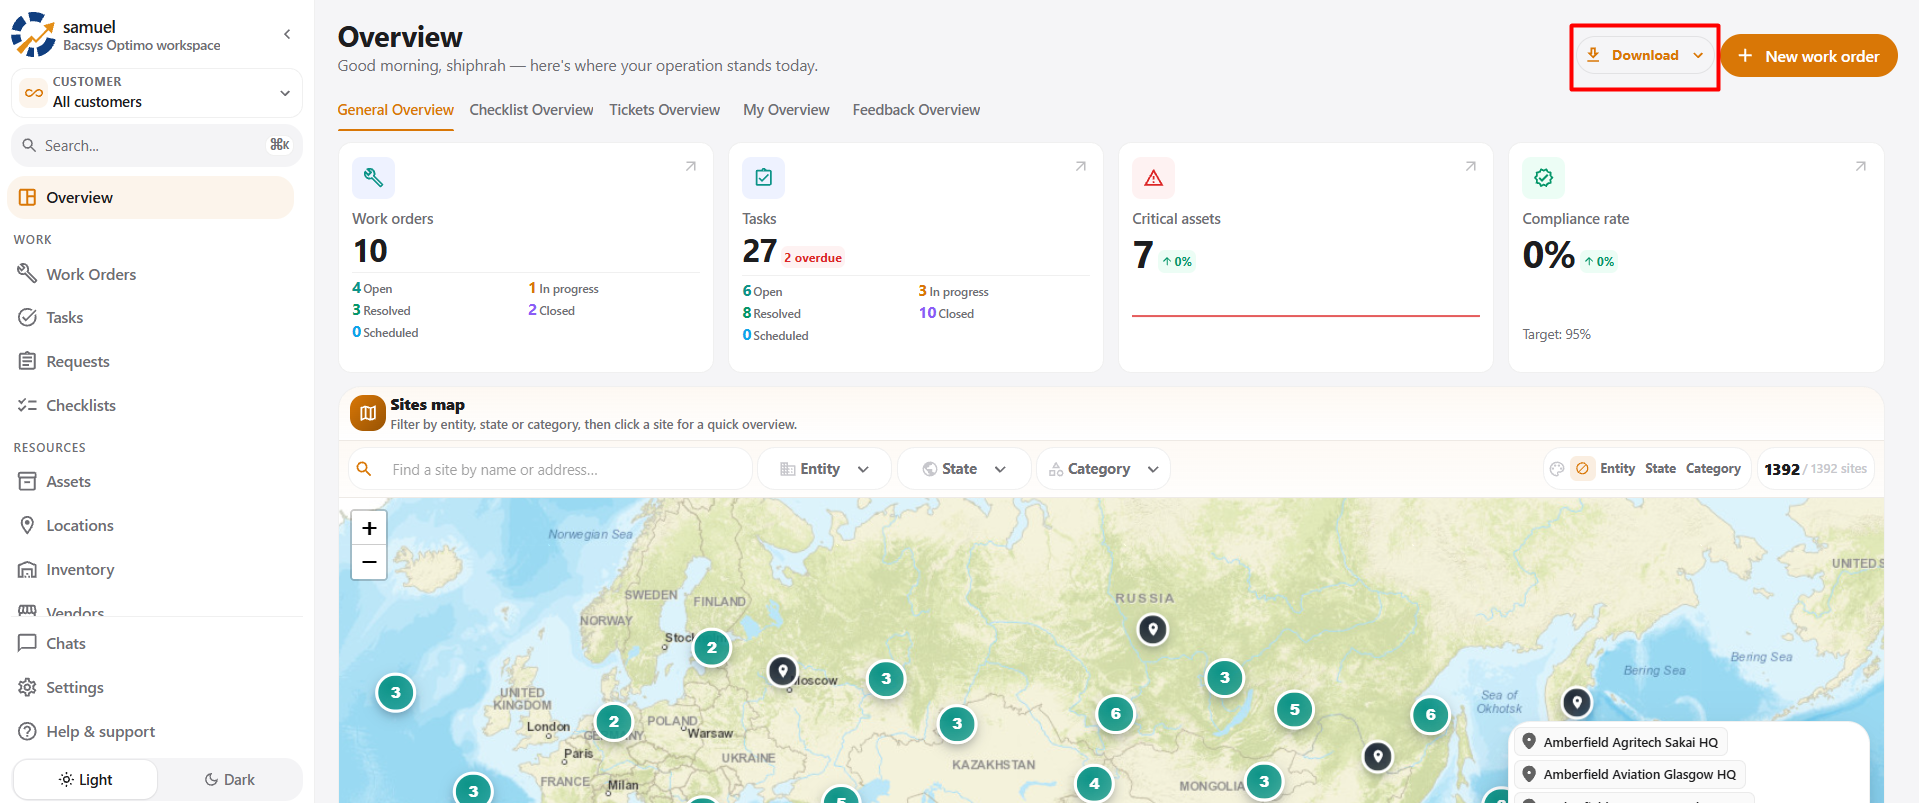
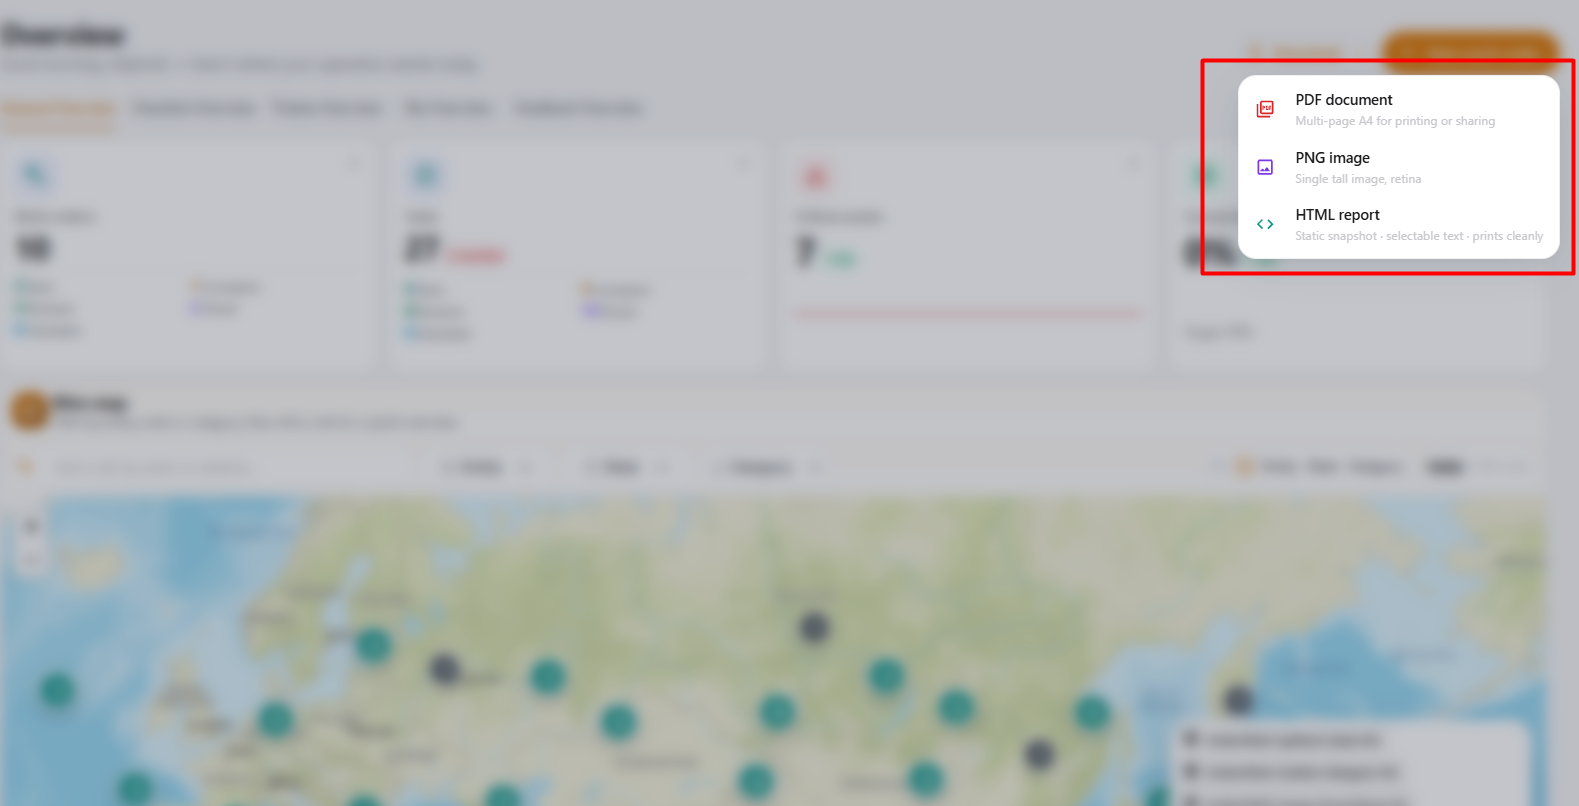
The Download button allows users to export the Overview dashboard information into different report formats.
Available Export Formats
| Format | Description |
|---|---|
| Downloads the Overview report as a PDF document. | |
| PNG | Downloads the Overview report as a PNG image. |
| HTML | Downloads the Overview report as an HTML document. |
Steps to Download a Report
- Navigate to the Overview page.
- Locate the Download button in the top-right corner.
- Click the Download button.
- A dropdown menu displays the available export formats.
- Select the required format.
- The system generates the report in the selected format.
Functionality Details
- Clicking the Download button should display the available export options.
- Selecting PDF should generate a PDF report.
- Selecting PNG should generate an image of the dashboard.
- Selecting HTML should generate an HTML report.
- The exported report should contain the relevant Overview dashboard information.
- The report should be generated successfully without errors.
- The exported report should maintain a readable layout.
2.2 New Work Order Button
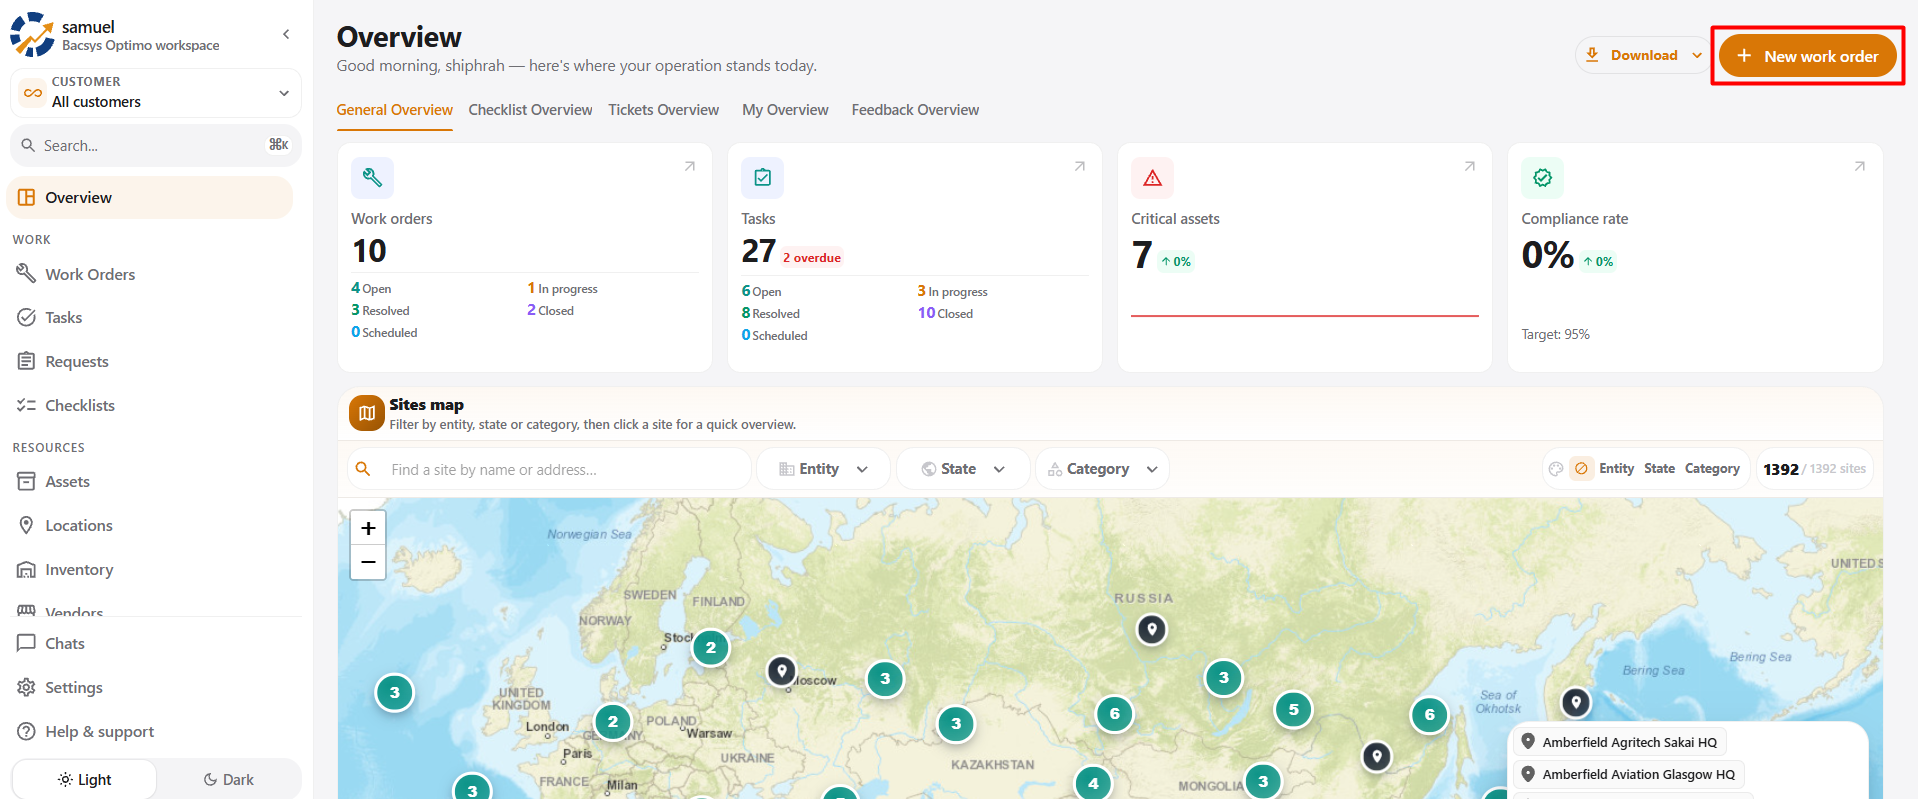
The + New work order button allows users to create a new work order directly from the Overview page.
Steps to Create a New Work Order
- Navigate to the Overview page.
- Locate the + New work order button in the top-right corner.
- Click the button.
- The system redirects the user to the Work Orders module or work order creation interface.
- Enter the required work order information.
- Create the work order.
Functionality Details
- The button should be visible to users with the required permissions.
- Clicking the button should redirect the user to the Work Orders module.
- The work order creation interface should load correctly.
- Users should be able to create a new work order without errors.
3. Overview Navigation Tabs
The Overview page contains multiple navigation tabs that allow users to access different dashboard views.
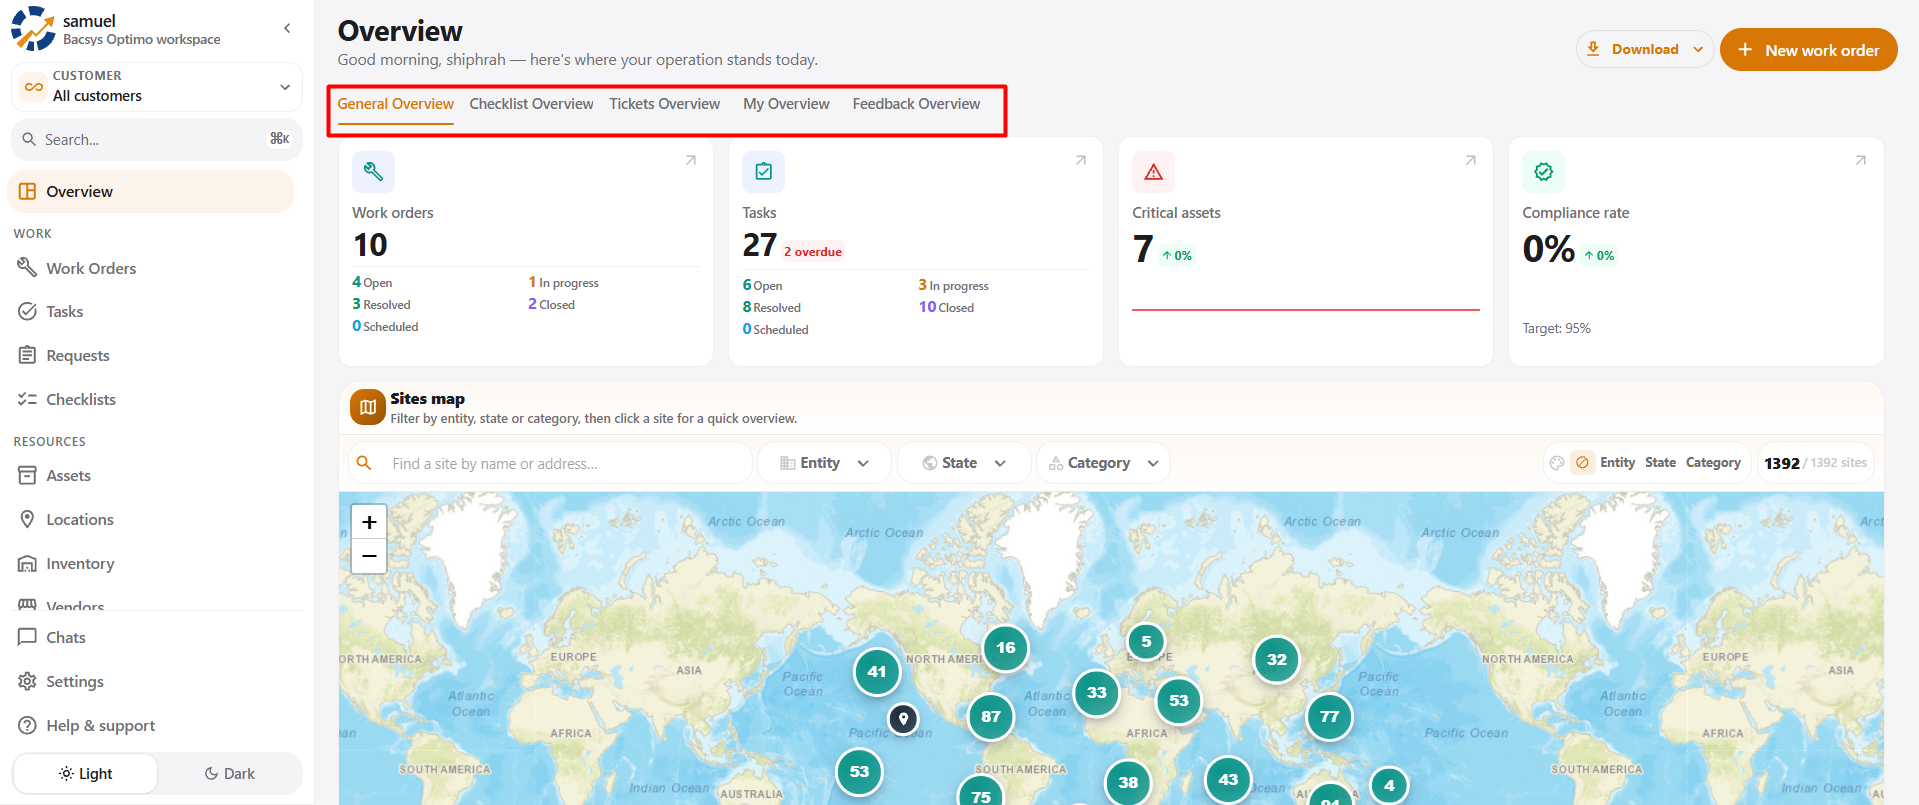
Available Tabs
| Tab | Description |
|---|---|
| General Overview | Displays a summary of maintenance operations and asset information. |
| Checklist Overview | Displays an overview of checklist-related activities. |
| Tickets Overview | Displays information related to maintenance tickets. |
| My Overview | Displays overview information relevant to the current user. |
| Feedback Overview | Displays feedback-related information. |
Steps to Navigate Between Tabs
- Open the Overview page.
- Locate the navigation tabs below the page header.
- Click the required tab.
- The corresponding dashboard content is displayed.
Functionality Details
- The selected tab should be visually highlighted.
- The corresponding dashboard content should load correctly.
- Switching between tabs should not cause unexpected errors.
- Users should be able to return to the General Overview tab.
4. General Overview Dashboard
The General Overview dashboard contains multiple summary cards and information widgets.
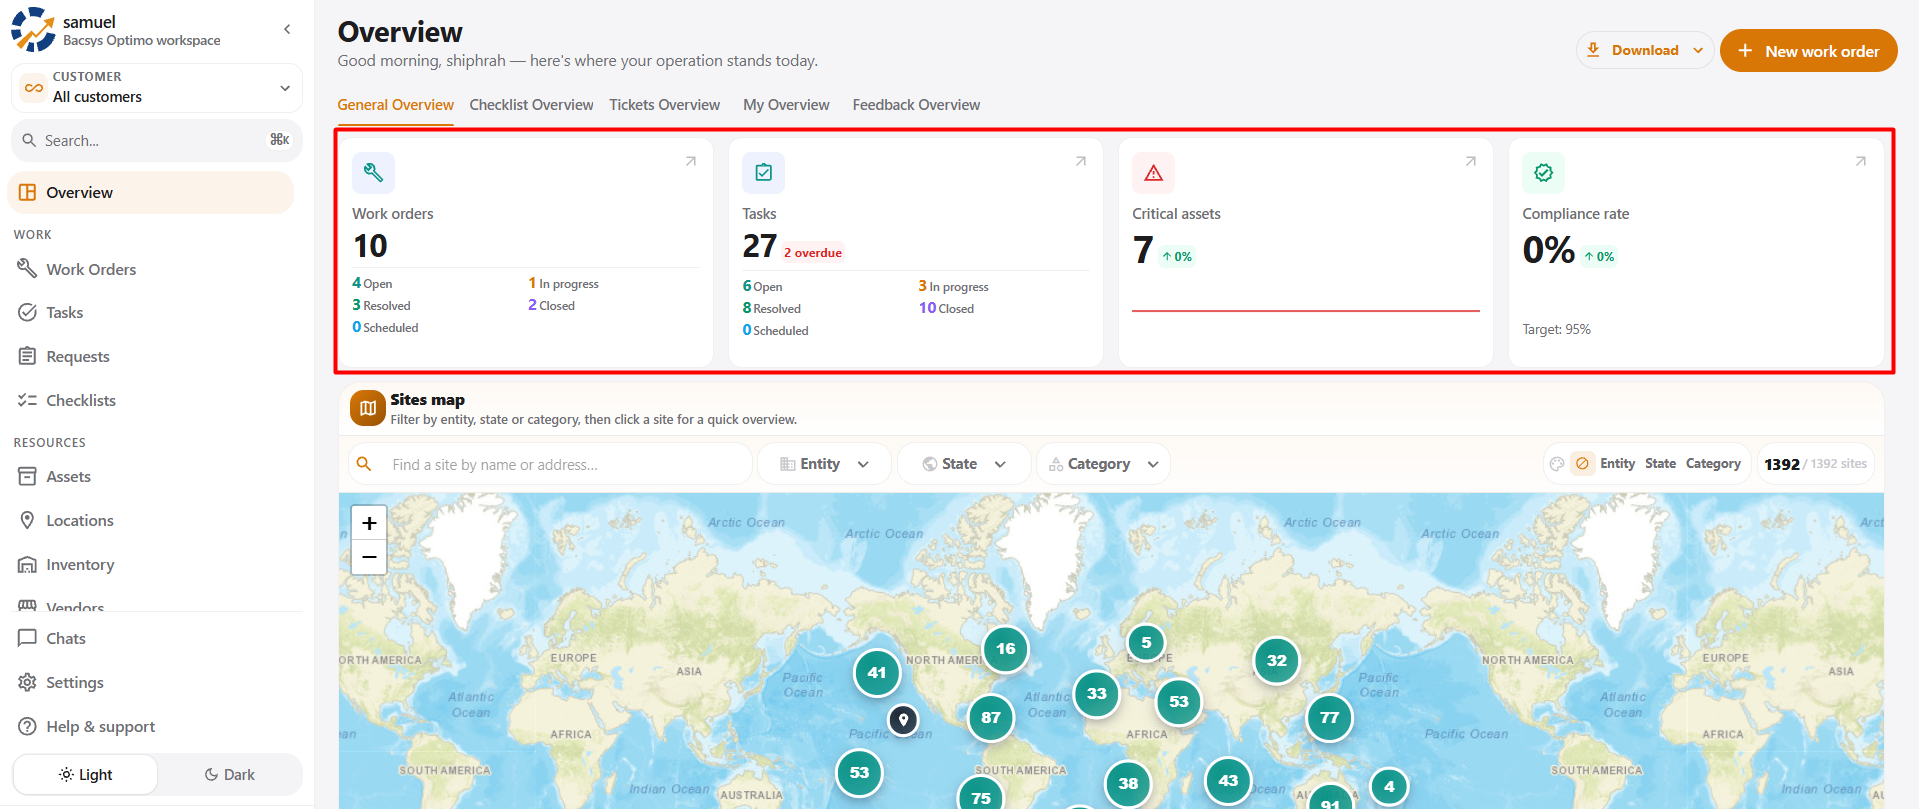
The main summary cards are:
- Work Orders
- Tasks
- Critical Assets
- Compliance Rate
Each card provides a quick summary of a specific area of the Optimo application.
5. Work Orders Summary Card
The Work Orders card provides an overview of the total work orders in the system, along with their current statuses, including Open, In Progress, Resolved, Closed, and Scheduled.
Users can review work order statistics and navigate directly to the Work Orders module by clicking the card or navigation arrow.
5.1 Information Displayed
The Work Orders card contains:
- Work order icon
- Total number of work orders
- Navigation arrow
- Work order status breakdown
Example Display
| Information | Example Value |
|---|---|
| Total Work Orders | 10 |
| Open | 4 |
| In Progress | 1 |
| Resolved | 3 |
| Closed | 2 |
| Scheduled | 0 |
Note: The values above are examples based on the provided screenshot. Actual values may vary.
5.2 Work Order Statuses
| Status | Description |
|---|---|
| Open | Work orders that have been created but are awaiting action. |
| In Progress | Work orders that are currently being worked on. |
| Resolved | Work orders for which the reported issue has been resolved. |
| Closed | Work orders that have completed the closure process. |
| Scheduled | Work orders planned for execution at a future date or time. |
6. Tasks Summary Card
The Tasks card displays a summary of maintenance tasks, including the total task count, task statuses, and overdue tasks.
Users can monitor task progress, identify overdue tasks, and navigate directly to the Tasks module by clicking the card or navigation arrow.
6.1 Information Displayed
The Tasks card contains:
- Task icon
- Total number of tasks
- Overdue task count
- Task status breakdown
- Navigation arrow
Example Display
| Information | Example Value |
|---|---|
| Total Tasks | 27 |
| Open | 6 |
| In Progress | 3 |
| Resolved | 8 |
| Closed | 10 |
| Scheduled | 0 |
| Overdue | 2 |
6.2 Task Statuses
| Status | Description |
|---|---|
| Open | Tasks that have been created and are awaiting action. |
| In Progress | Tasks that are currently being executed. |
| Resolved | Tasks for which the reported issue has been resolved. |
| Closed | Tasks that have completed the closure process. |
| Scheduled | Tasks planned for execution at a future date or time. |
| Overdue | Tasks that have exceeded their expected completion date. |
7. Critical Assets Summary Card
The Critical Assets card displays the total number of assets classified as critical within the system.
Users can quickly identify critical assets and navigate to the relevant Assets module to view additional information.
7.1 Information Displayed
The Critical Assets card contains:
- Critical asset icon
- Total number of critical assets
- Change indicator
- Navigation arrow
Example Display
| Information | Example Value |
|---|---|
| Critical Assets | 7 |
| Change Indicator | 0% |
7.2 Steps to View Critical Assets
- Navigate to the General Overview page.
- Locate the Critical Assets card.
- Review the number of critical assets.
- Click the card or navigation arrow.
- The system redirects the user to the relevant Assets page or critical asset listing.
8. Compliance Rate Summary Card
The Compliance Rate card displays the current maintenance compliance percentage along with the configured target and change indicator.
Users can monitor compliance performance and access the relevant compliance or maintenance information through the available navigation options.
8.1 Information Displayed
The Compliance Rate card contains:
- Compliance icon
- Current compliance percentage
- Change indicator
- Target compliance percentage
- Navigation arrow
Example Display
| Information | Example Value |
|---|---|
| Current Compliance Rate | 0% |
| Target Compliance Rate | 95% |
| Change Indicator | 0% |
8.2 Steps to View Compliance Information
- Navigate to the General Overview page.
- Locate the Compliance Rate card.
- Review the current compliance percentage.
- Compare the current rate with the target percentage.
- Click the card or navigation arrow, if available.
- The system opens the relevant compliance or maintenance information page.
9. Sites Map
The Sites Map provides a geographical view of all sites managed within the Optimo application. Users can search for sites, apply filters, view site counts, and access site details.
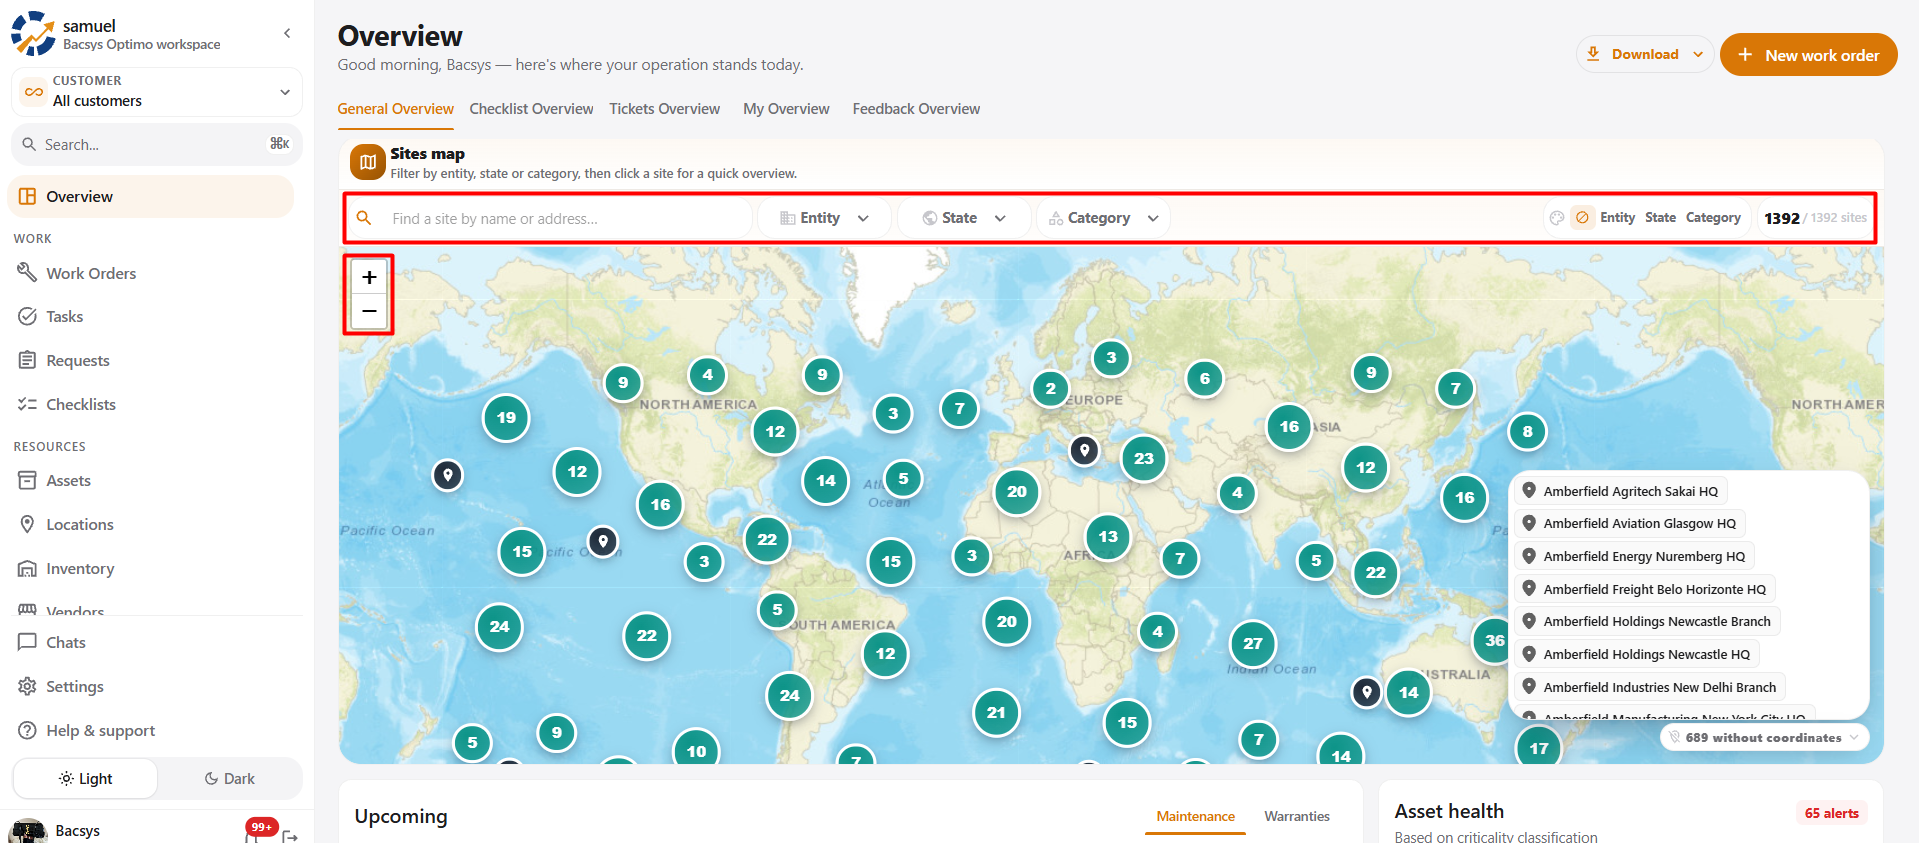
9.1 Available Features
- View the geographical distribution of sites.
- Search for a site by name or address.
- Filter sites by Entity, State, and Category.
- View the total and filtered site count.
- Zoom in and out of the map.
- Select site markers to view site information.
9.2 Site Search
The search field allows users to locate a site by entering its name or address.
Steps:
- Enter the site name or address in the search field.
- Review the matching sites displayed on the map.
- Select the required site to view its details.
9.3 Site Filters
The Sites Map provides the following filters:
| Filter | Description |
|---|---|
| Entity | Displays sites associated with a selected entity. |
| State | Filters sites based on their geographical state. |
| Category | Displays sites belonging to a selected category. |
Steps:
- Select the required filter.
- Choose an option from the dropdown.
- The map updates to display the matching sites.
- Change or clear the filters as required.
9.4 Site Count
The map displays the number of matching sites and the total number of available sites.
Example:
1392 / 1392 sites
The displayed count updates when filters are applied.
9.5 Map Controls
The map provides zoom controls and markers to help users navigate site locations.
| Control | Function |
|---|---|
+ | Zooms in on the map. |
− | Zooms out of the map. |
| Site Marker | Displays a site's location. |
| Cluster Marker | Represents multiple sites grouped in one location. |
9.6 Viewing Site Details
- Locate the required site on the map.
- Click the site marker or cluster.
- Select the required site, if applicable.
- View the site's quick overview.
The map updates according to the selected filters and provides access to relevant site information.
10. Upcoming
The Upcoming section displays upcoming maintenance activities and warranty information for assets.
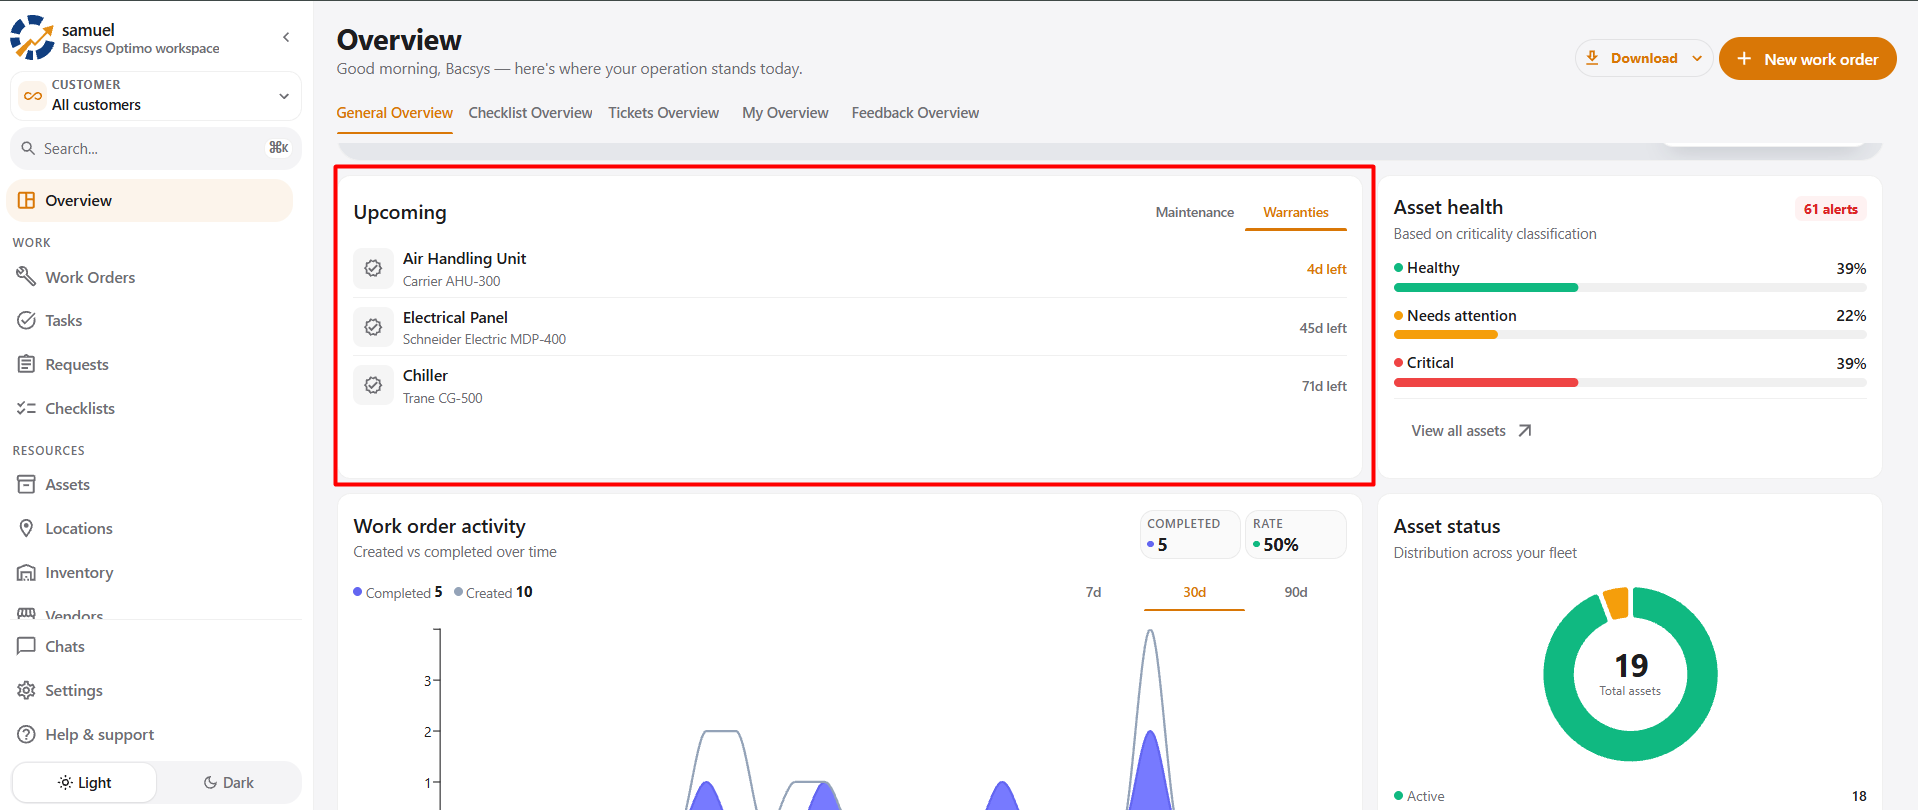
10.1 Available Tabs
- Maintenance: View scheduled maintenance activities.
- Warranties: View warranty-related information.
10.2 Maintenance Tab
The Maintenance tab lists upcoming maintenance records, including relevant schedule details.
If no maintenance is scheduled, an appropriate empty-state message is displayed.
10.3 Warranties Tab
The Warranties tab displays available warranty records for assets.
Users can select a warranty record to view its details. If no records are available, an appropriate empty-state message is displayed.
11. Asset Health
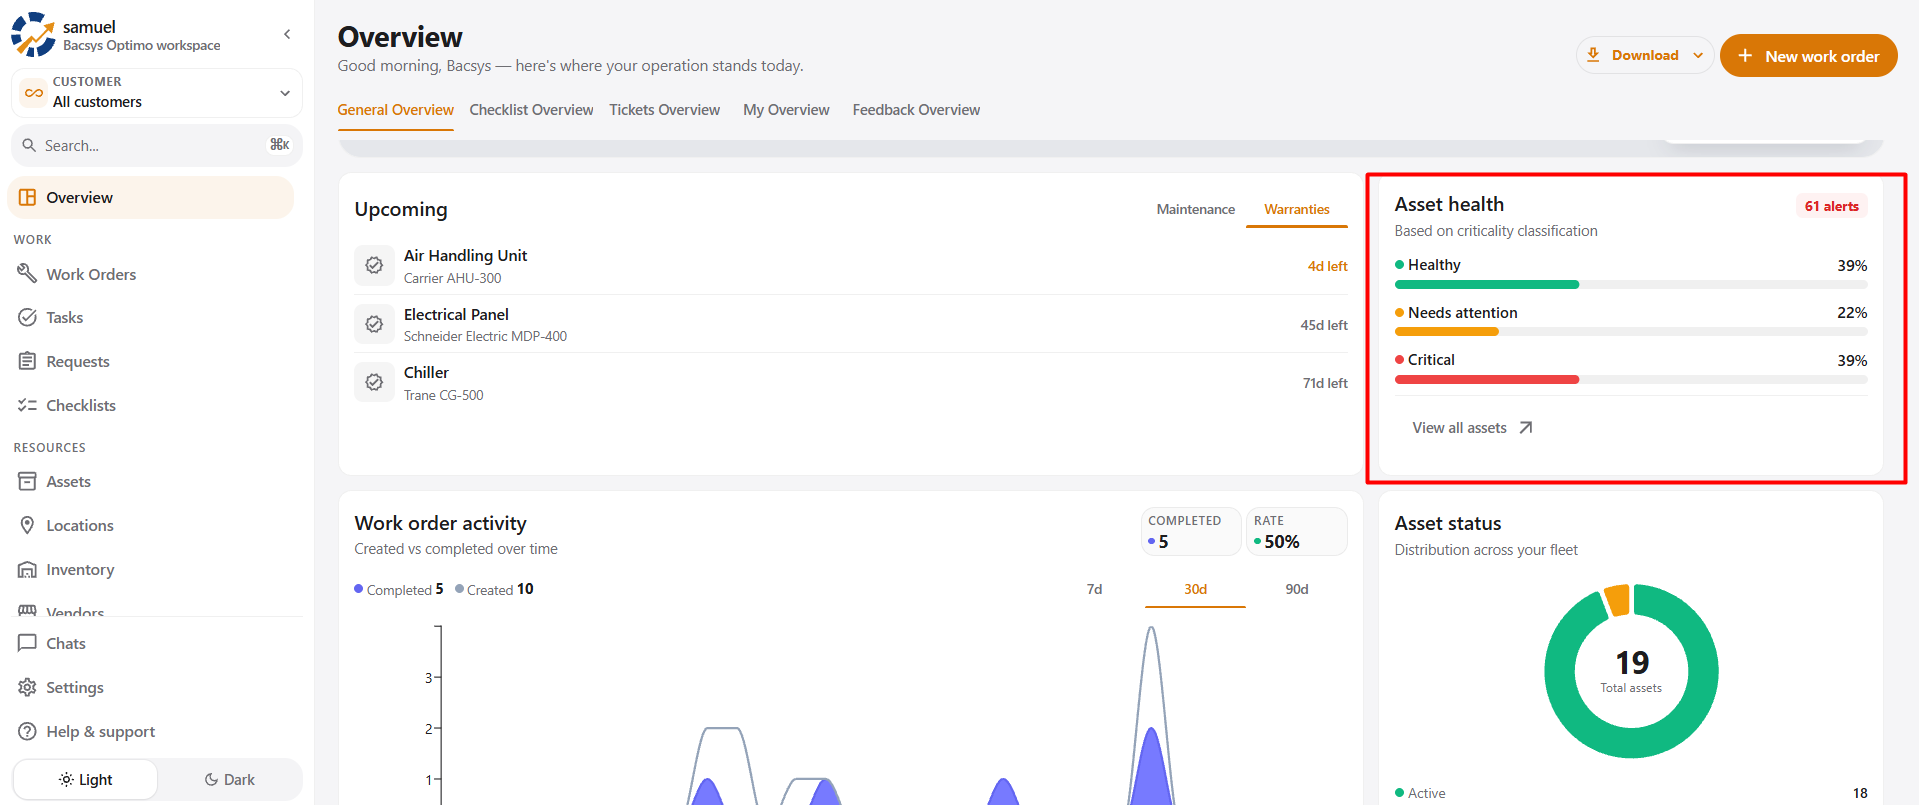
The Asset Health section provides an overview of asset health based on the configured asset classification rules.
It helps users identify the general condition of their asset fleet and focus attention on assets requiring maintenance.
11.1 Information Displayed
The Asset Health section contains:
- Asset Health title
- Description:
Based on criticality classification - Total alert count
- Healthy assets
- Assets requiring attention
- Critical assets
- Percentage distribution
- Progress bars
- View All Assets link
Example Display
| Asset Health Category | Percentage |
|---|---|
| Healthy | 35% |
| Needs Attention | 24% |
| Critical | 41% |
| Total Alerts | 65 |
Note: The values above are examples based on the provided screenshot.
11.2 Healthy Assets
The Healthy category represents assets classified as healthy according to the configured asset health rules.
Information Displayed
- Healthy asset indicator
- Healthy asset percentage
- Progress bar
Example:
Healthy — 35%
Functionality Details
- The healthy asset percentage should be calculated according to the application's configured rules.
- The progress bar should visually represent the displayed percentage.
- The displayed value should update when the underlying asset data changes.
11.3 Needs Attention
The Needs Attention category represents assets that require monitoring, inspection, or maintenance attention.
Information Displayed
- Needs Attention indicator
- Percentage of assets requiring attention
- Progress bar
Example:
Needs attention — 24%
Functionality Details
- The percentage should reflect the applicable asset records.
- The progress bar should correspond to the displayed percentage.
- The information should be updated according to changes in asset health.
11.4 Critical Assets
The Critical category represents assets identified as critical according to the configured classification or health rules.
Information Displayed
- Critical asset indicator
- Critical asset percentage
- Progress bar
Example:
Critical — 41%
Functionality Details
- The critical asset percentage should be calculated correctly.
- The progress bar should represent the displayed value.
- The data should remain consistent with the asset records.
11.5 View All Assets
The View all assets link allows users to navigate to the Assets module.
Steps to View All Assets
- Navigate to the Asset Health section.
- Locate the View all assets link.
- Click the link.
- The system redirects the user to the Assets module.
- Review the available asset records.
Functionality Details
- The link should be visible and clickable.
- Clicking the link should open the Assets page.
- The Assets page should load successfully.
- Users should be able to view the available assets.
12. Work Order Activity
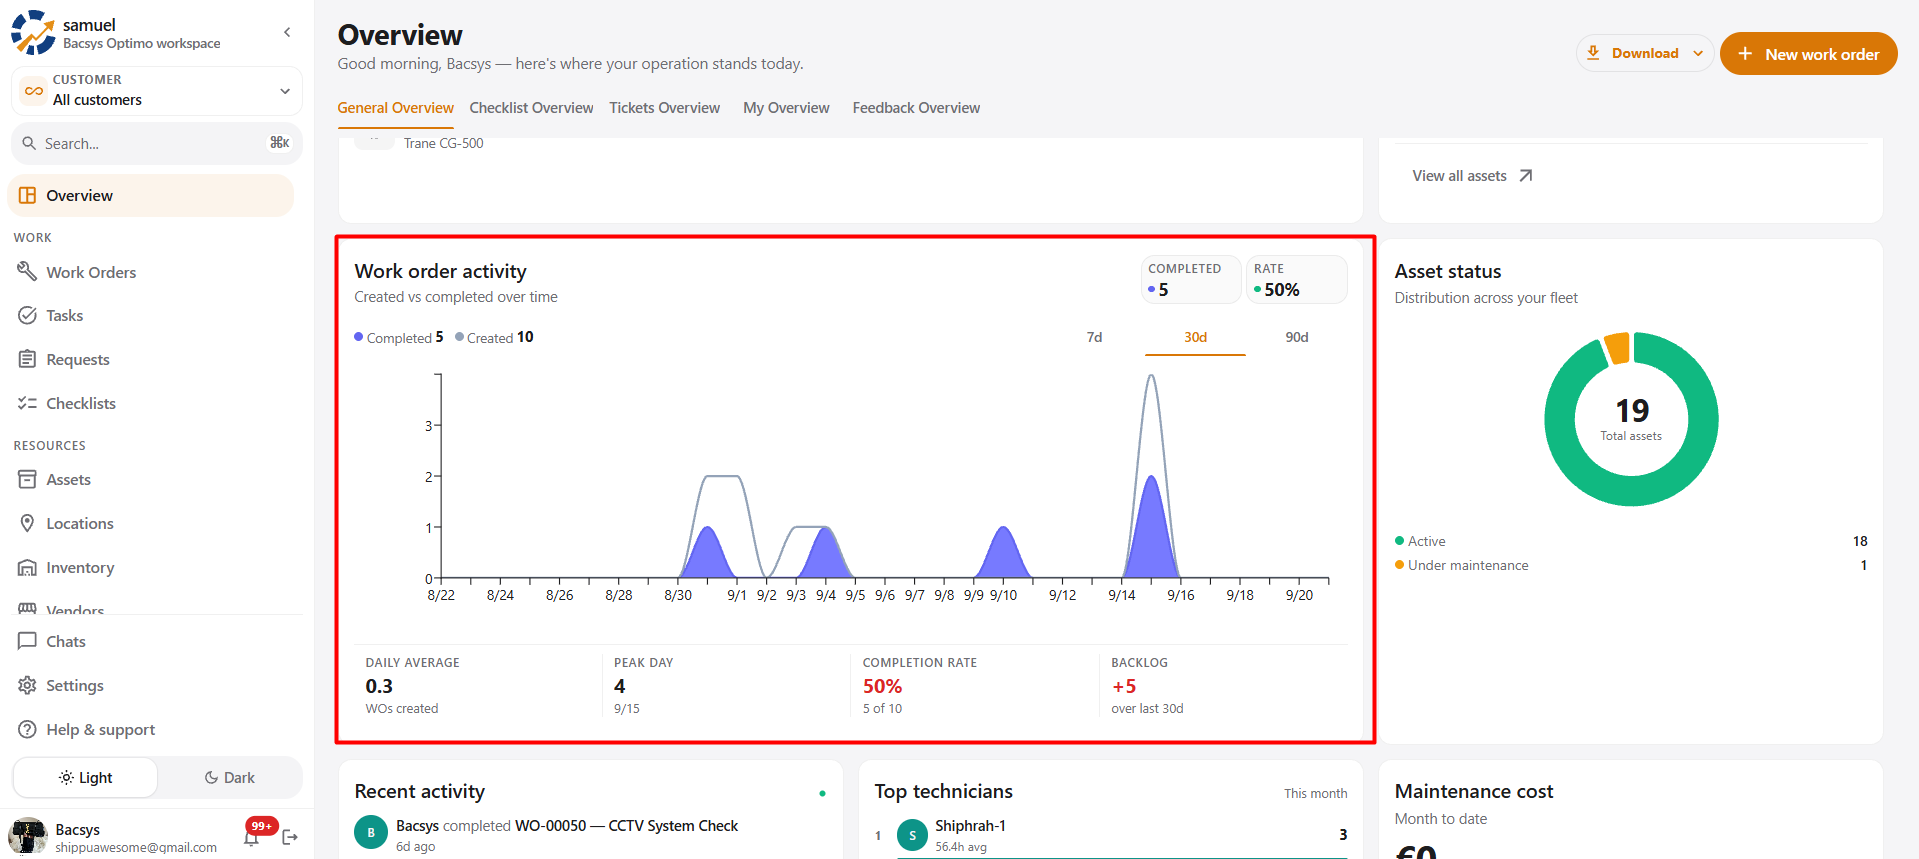
The Work Order Activity section provides a graphical overview of work orders created and completed during a selected period.
12.1 Key Information
- Completed work order count
- Created work order count
- Completion rate
- Daily average
- Peak activity day
- Work order backlog
- Created vs. completed activity chart
12.2 Reporting Period Filters
Users can view work order activity for different periods:
- 7d: Last 7 days
- 30d: Last 30 days
- 90d: Last 90 days
The chart and summary metrics update based on the selected period.
12.3 Activity Chart
The chart displays created and completed work orders over time. Users can review work order trends and view data details when supported.
12.4 Summary Metrics
- Daily Average: Average number of work orders created per day.
- Peak Day: Day with the highest work order activity.
- Completion Rate: Percentage of completed work orders.
- Backlog: Difference between created and completed work orders during the selected period.
13. Asset Status
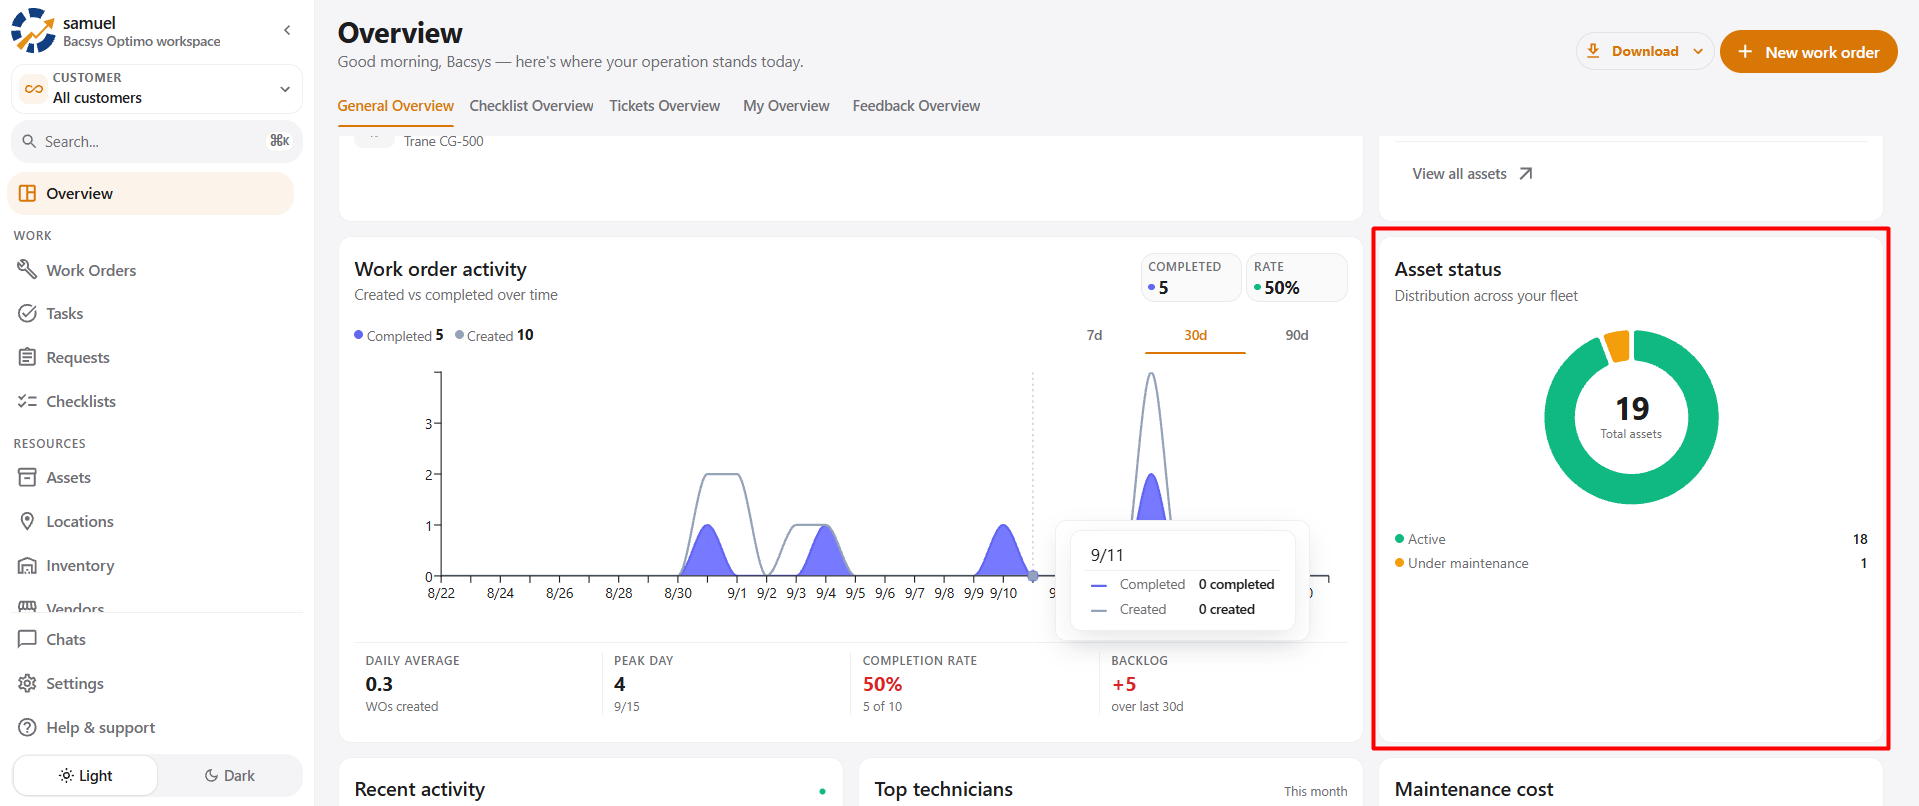
The Asset Status section displays the distribution of assets based on their current status using a doughnut chart.
13.1 Key Information
- Total asset count
- Active asset count
- Assets under maintenance
- Status legend
- Doughnut chart showing asset distribution
13.2 Doughnut Chart
The chart displays the total number of assets at the center and visually represents each asset status.
The displayed counts should match the current asset records and update when asset statuses change.
14. Recent Activity
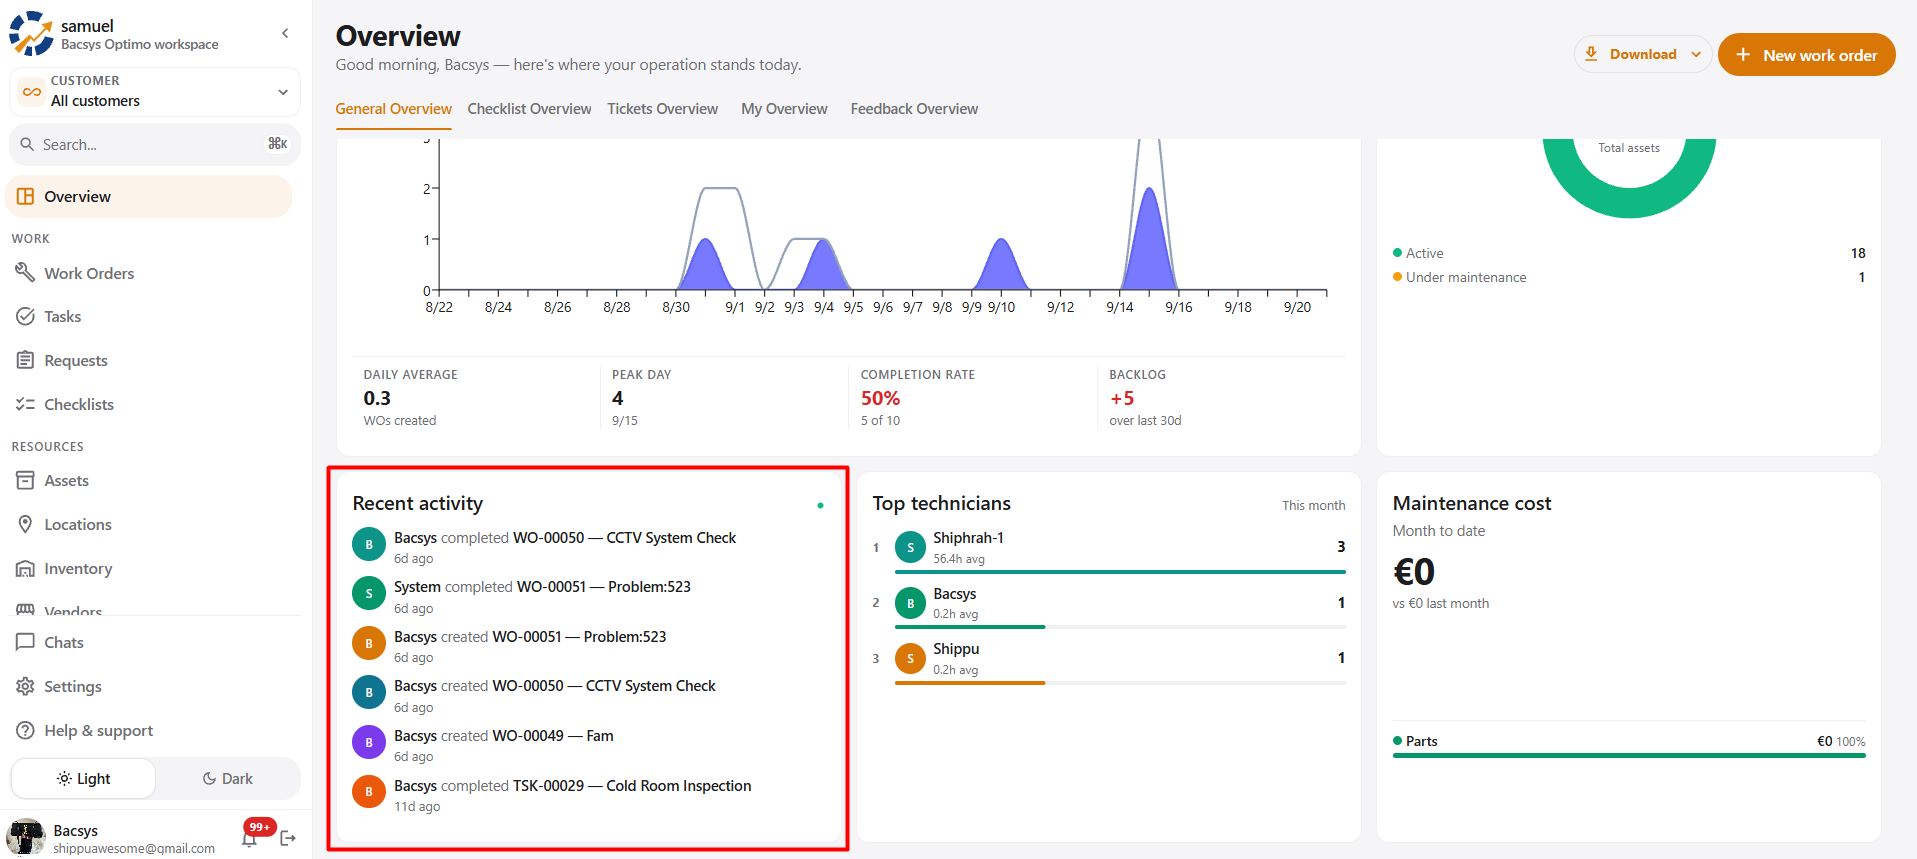
The Recent Activity section displays a chronological list of recent actions performed within the Optimo application.
It helps users track work order, task, and other system-related activities.
14.1 Key Information
- User or system responsible for the activity
- Activity description
- Associated work order or task reference
- Activity type
- Time of activity
14.2 Activity Types
- Created
- Completed
- Updated
- Assigned
- Other configured system activities
14.3 Functionality Details
- Activities should be displayed in chronological order.
- User and system information should be displayed correctly.
- Related work order and task references should be accurate.
- Activity timestamps should reflect the actual activity time.
- Selecting an activity, if supported, should open the related record.
15. Top Technicians
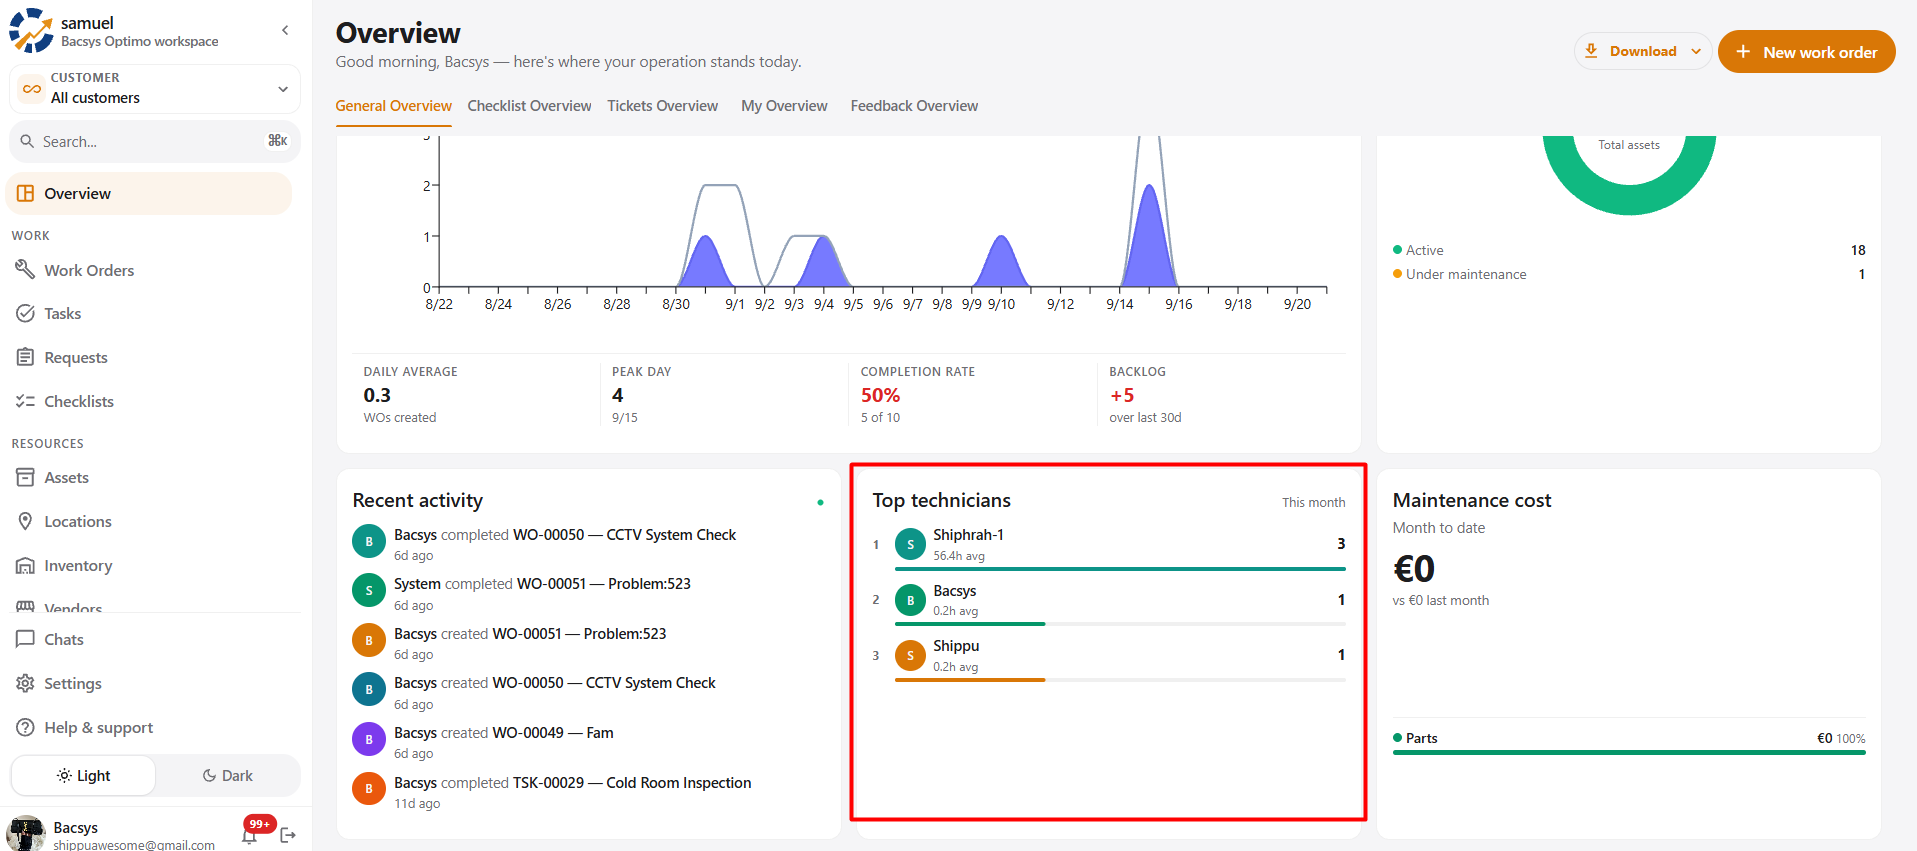
The Top Technicians section displays technician performance for the selected reporting period.
15.1 Key Information
- Selected reporting period
- Technician ranking
- Technician name and avatar
- Performance metrics
- Activity count
- Progress indicator
15.2 Functionality Details
- Technicians should be ranked according to the configured performance metrics.
- Performance data should match the selected reporting period.
- Activity counts and performance metrics should be calculated correctly.
- Progress indicators should reflect the relevant performance data.
- The ranking should update when the reporting period or underlying data changes.
16. Maintenance Cost
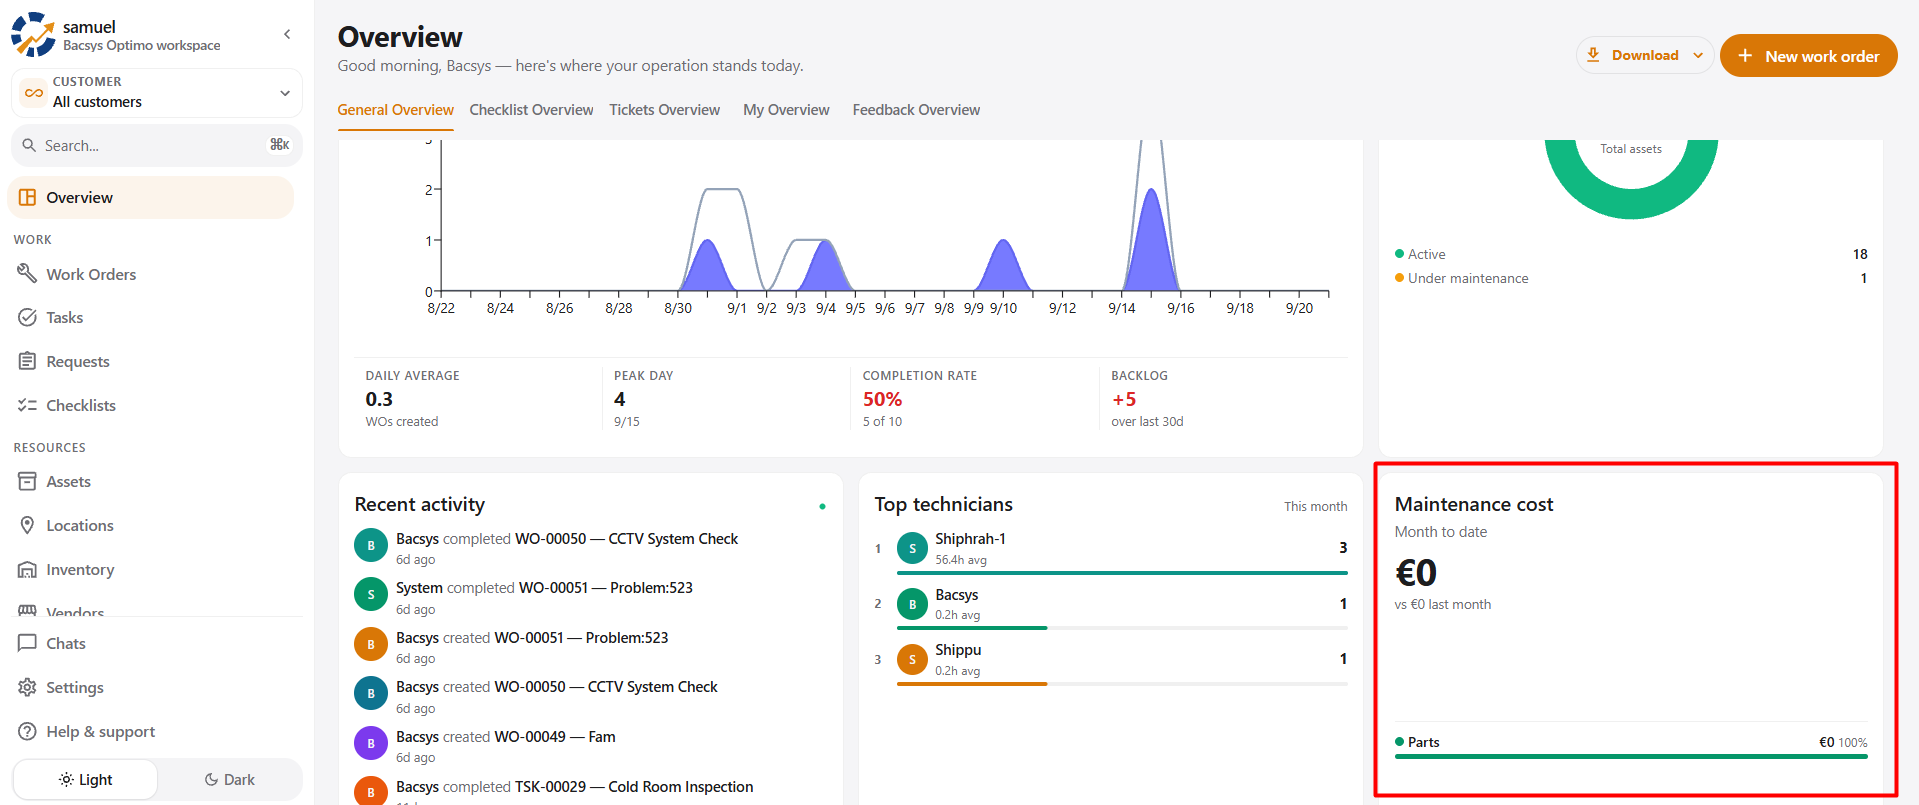
The Maintenance Cost section displays maintenance-related expenses for the selected reporting period.
16.1 Key Information
- Selected reporting period
- Total maintenance cost
- Comparison with the previous period
- Cost category breakdown
- Cost percentages
- Cost distribution progress bar
16.2 Functionality Details
- Maintenance costs should be calculated from relevant cost records.
- The displayed currency should match the configured currency.
- Cost categories and percentages should be displayed correctly.
- The cost details should update when the reporting period or cost records change.
17. General Overview Navigation Summary
The General Overview page provides access to multiple Optimo modules through summary cards, links, and action buttons.
| Dashboard Component | Navigation / Action | Destination |
|---|---|---|
| Download | Select PDF, PNG, or HTML | Downloads the selected report format. |
| + New work order | Click the button | Work Orders module or work order creation interface. |
| Work Orders card | Click the card or navigation arrow | Work Orders module. |
| Tasks card | Click the card or navigation arrow | Tasks module. |
| Critical Assets card | Click the card or navigation arrow | Relevant Assets or Critical Assets page. |
| Compliance Rate card | Click the card or navigation arrow | Relevant compliance or maintenance page, if configured. |
| Sites Map | Click a site marker | Site quick overview. |
| View All Assets | Click the link | Assets module. |
| Upcoming Maintenance | Select a maintenance record | Maintenance details. |
| Warranties | Select a warranty record | Warranty details. |
| Recent Activity | Select an activity, if supported | Relevant work order or task record. |
18. General Overview – User Workflow
The following workflow describes how a user can use the General Overview page to monitor maintenance operations.
Step 1: Access the Dashboard
- Log in to the Optimo application.
- Navigate to the Overview page.
- The General Overview dashboard is displayed.
Step 2: Review Maintenance Summary
- Review the total number of work orders.
- Review the total number of tasks.
- Check the number of critical assets.
- Review the compliance rate.
- Identify areas requiring attention.
Step 3: Locate Sites
- Navigate to the Sites Map.
- Search for a site by name or address.
- Apply the Entity, State, or Category filter.
- Select a site marker.
- Review the site overview.
Step 4: Review Upcoming Activities
- Navigate to the Upcoming section.
- Review upcoming maintenance.
- Switch to the Warranties tab.
- Review available warranty information.
Step 5: Monitor Asset Health
- Review the Asset Health section.
- Check the Healthy asset percentage.
- Review assets that need attention.
- Check the Critical asset percentage.
- Click View all assets to access the Assets module.
Step 6: Analyze Work Order Activity
- Navigate to the Work Order Activity section.
- Select the required reporting period.
- Review created and completed work orders.
- Check the completion rate.
- Review the backlog and peak activity day.
Step 7: Review Asset Status
- Navigate to the Asset Status section.
- Review the total number of assets.
- Check the number of active assets.
- Review assets currently under maintenance.
Step 8: Review Recent Activity
- Navigate to the Recent Activity section.
- Review the latest system activities.
- Identify recently created or completed work orders and tasks.
- Open a relevant record, if supported.
Step 9: Review Technician Performance
- Navigate to the Top Technicians section.
- Review the selected reporting period.
- Check the technician rankings.
- Review the displayed performance metrics.
Step 10: Review Maintenance Costs
- Navigate to the Maintenance Cost section.
- Review the total maintenance expenditure.
- Compare the current cost with the previous period.
- Review the cost distribution by category.
Step 11: Export the Dashboard Report
- Click the Download button.
- Select PDF, PNG, or HTML.
- Generate the report.
- Verify that the exported report contains the required dashboard information.
20. Important Notes
- The information displayed on the General Overview page depends on the data available in the Optimo application.
- Summary cards and widgets should reflect the latest available data according to the application's refresh mechanism.
- Navigation actions may depend on user permissions and application configuration.
- The meaning of metrics such as Compliance Rate, Asset Health, Backlog, and Top Technicians should follow the business rules defined for Optimo.
- The displayed numbers in this document are examples taken from the provided screenshots and may change as the system data changes.
- Exported reports should contain the relevant dashboard information in a readable format.
- Users should have the necessary permissions to access the relevant modules.
21. Conclusion
The General Overview page serves as the central monitoring dashboard of the Optimo application.
It provides users with a comprehensive view of:
- Work orders
- Tasks
- Critical assets
- Compliance rate
- Site information
- Upcoming maintenance
- Warranty information
- Asset health
- Work order activity
- Asset status
- Recent activity
- Technician performance
- Maintenance costs
By using the available cards, charts, filters, navigation links, and export options, users can efficiently monitor maintenance operations and access the relevant Optimo modules.