

My Overview
4. My Overview
The My Overview page provides a personal performance dashboard for the logged-in user.
It helps users monitor their own performance, work completion, compliance, checklist quality, activity streaks, achievements, and areas that require attention.
4.1 Overview Navigation
The Overview page provides the following sections:
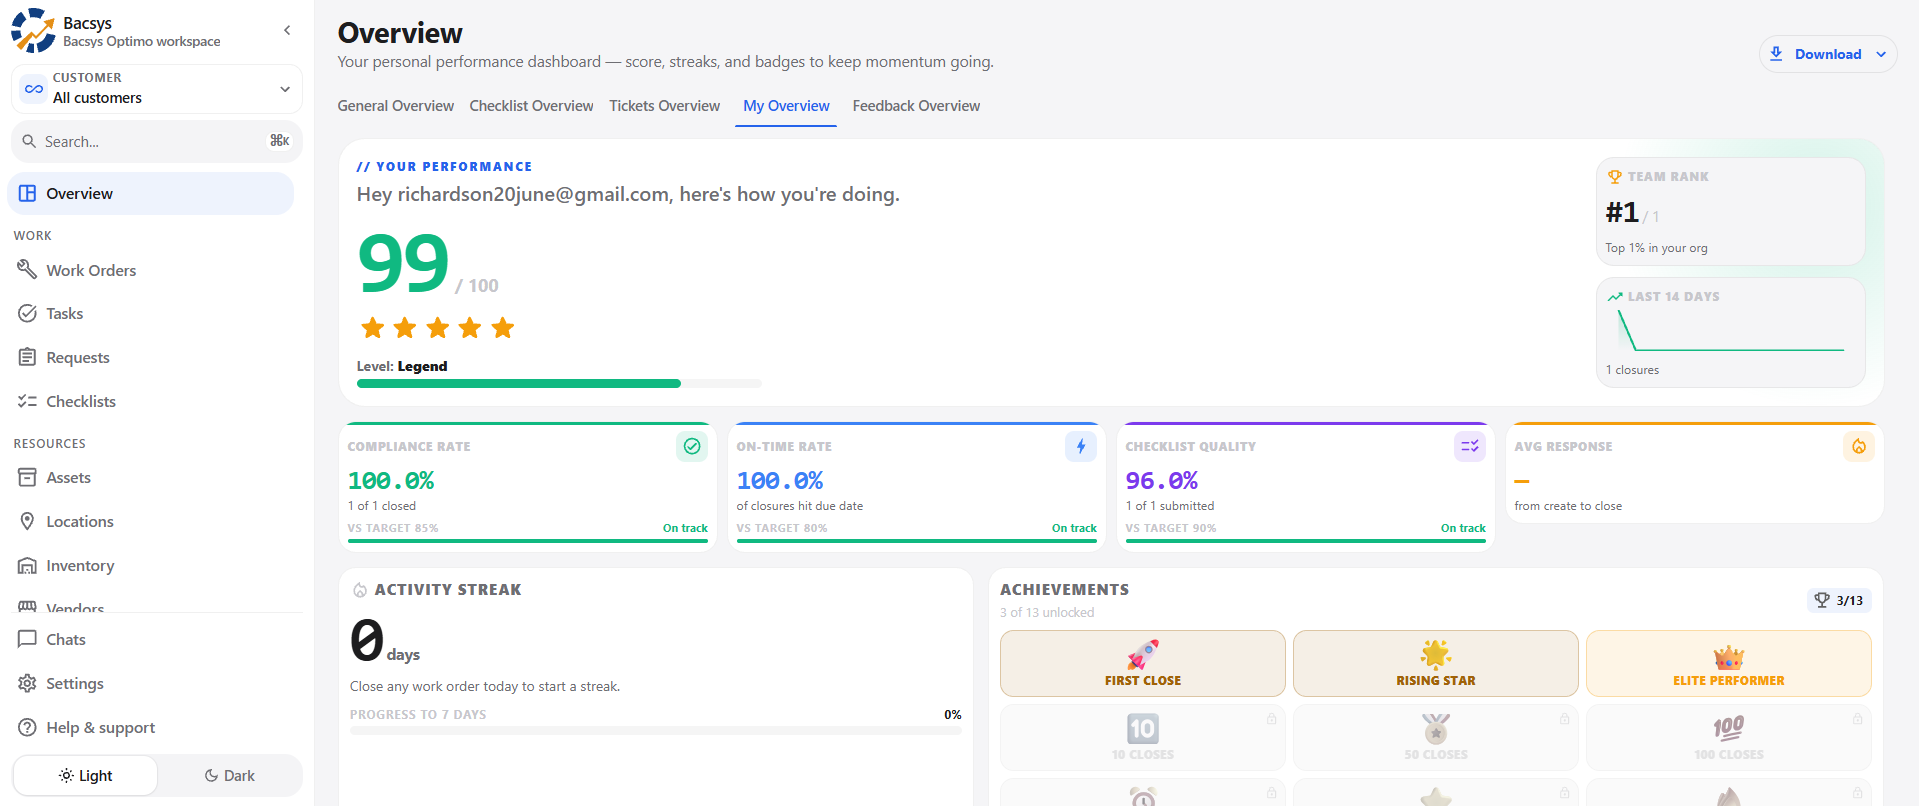
- General Overview
- Checklist Overview
- Tickets Overview
- My Overview
- Feedback Overview
Steps to Open My Overview
- Navigate to the Overview section.
- Select the My Overview tab.
- The personal performance dashboard is displayed.
4.2 Download Report
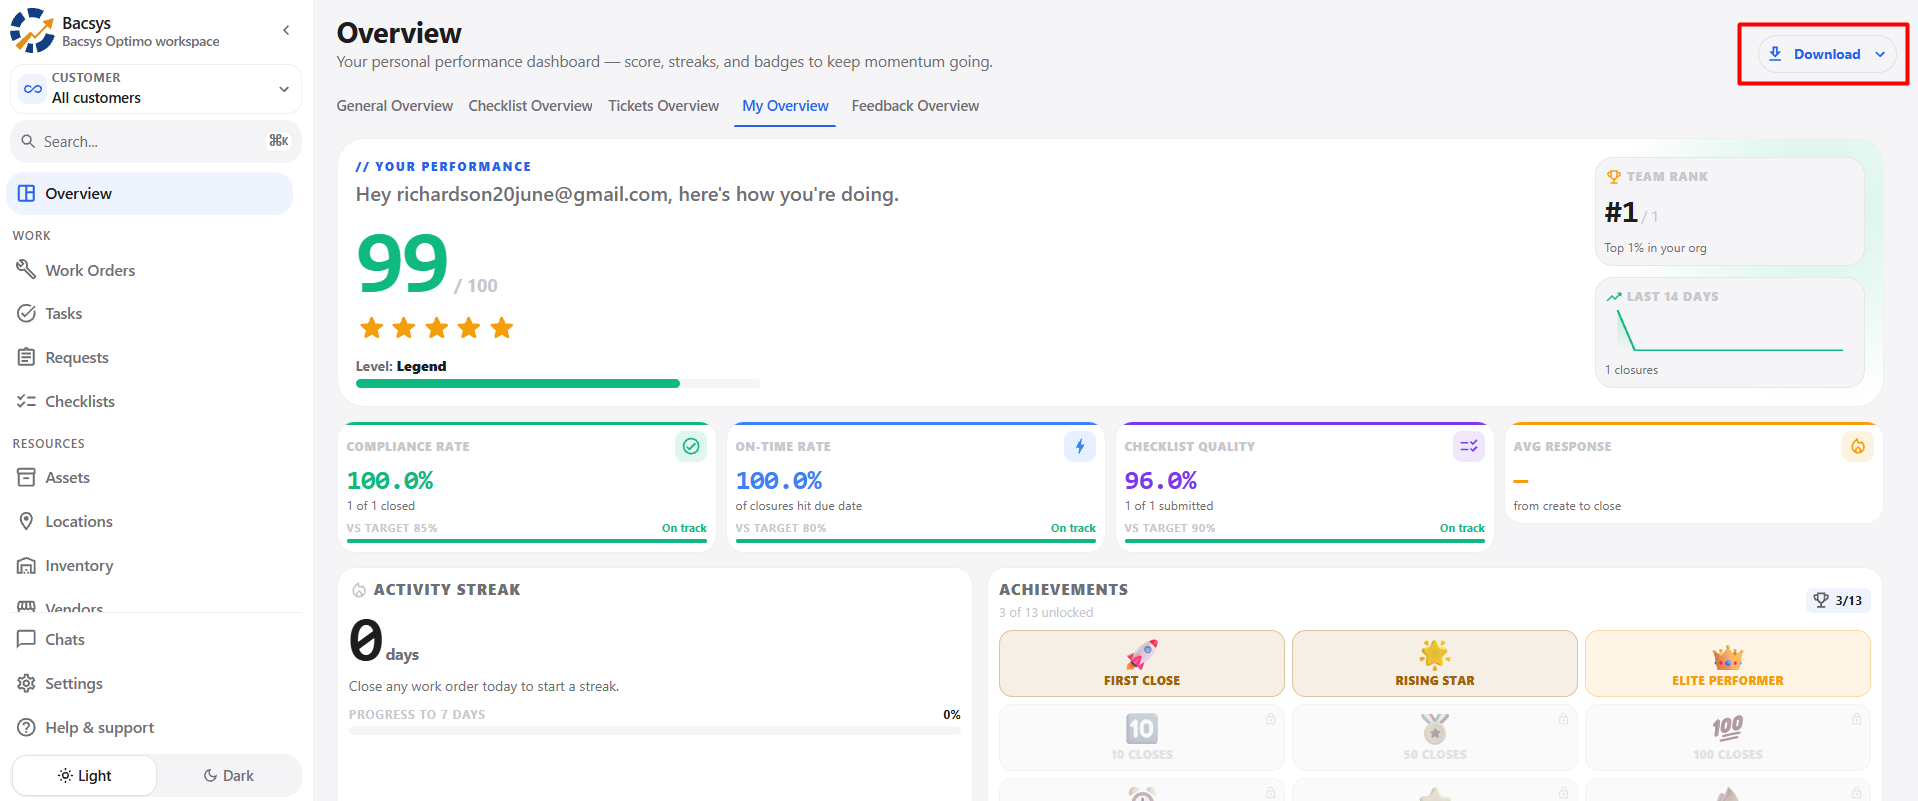
The Download option allows users to export the My Overview information.
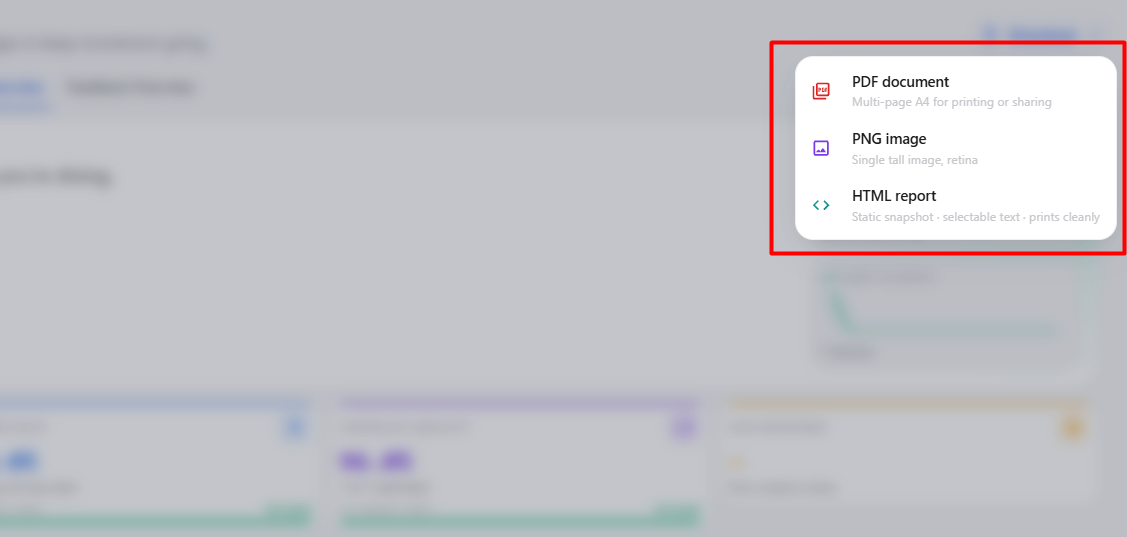
Available Formats
- PDF – Downloads the overview as a PDF document.
- PNG – Downloads the overview as an image.
- HTML – Downloads the overview as an HTML report.
Steps to Download
- Click the Download button.
- Select PDF, PNG, or HTML.
- The report is generated and downloaded in the selected format.
4.3 Your Performance
The Your Performance section provides an overall summary of the logged-in user's performance.
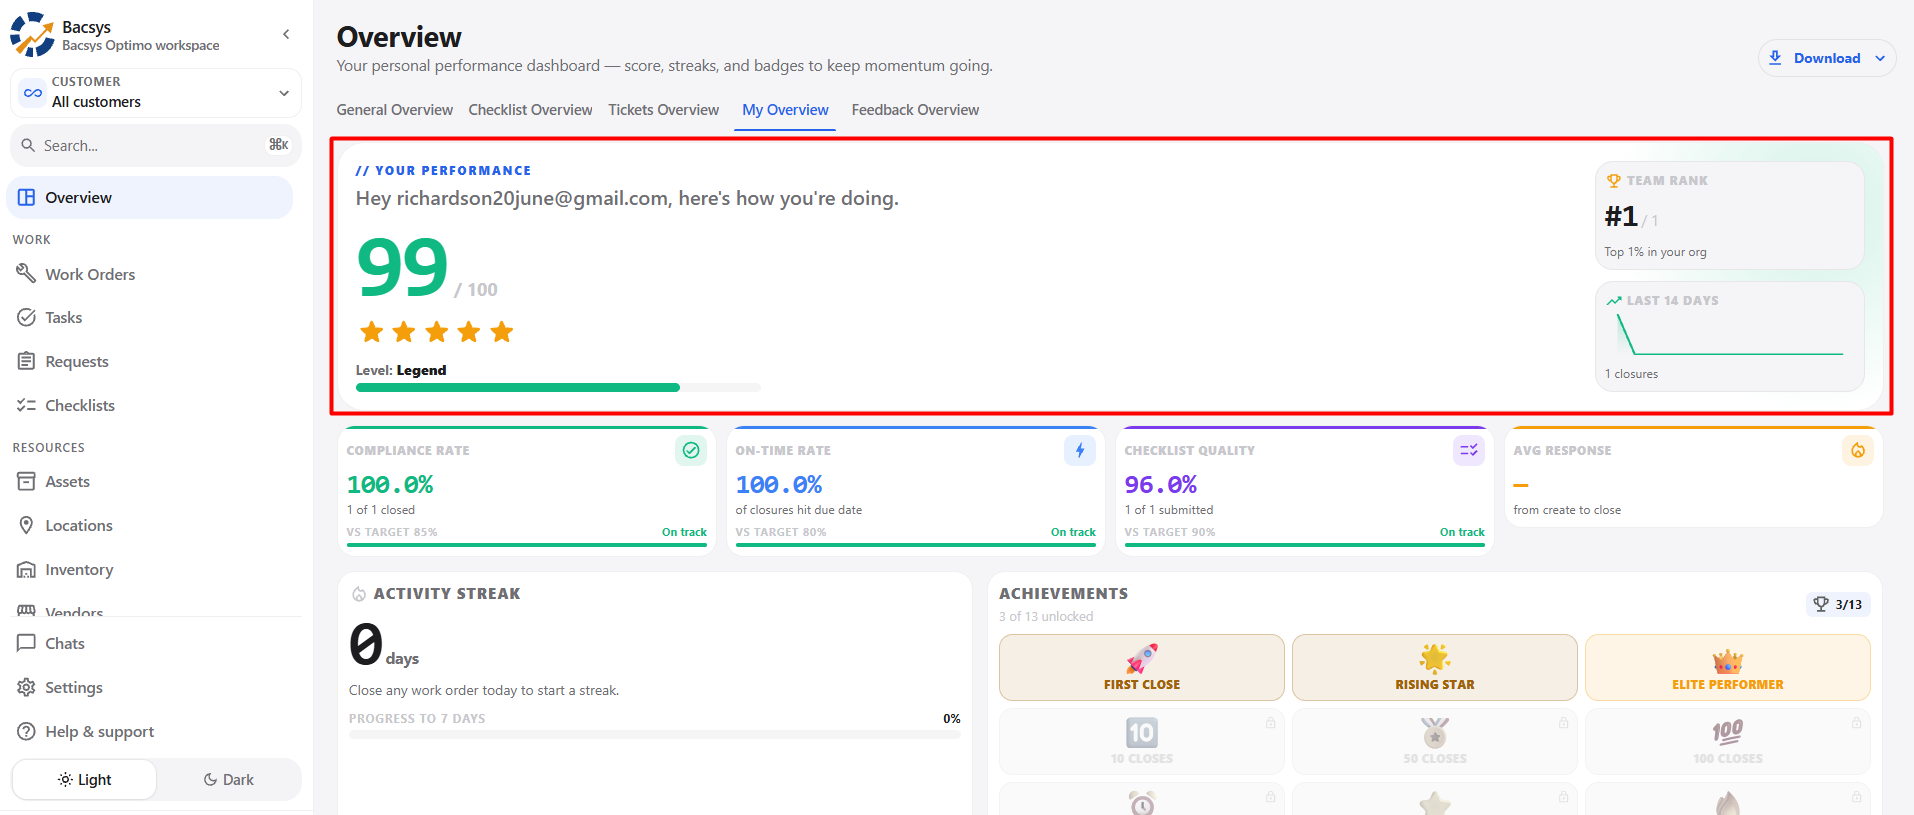
Information Displayed
- Overall performance score
- Performance level
- Star rating
- Performance progress
- Team ranking
- Recent activity trend
Steps to Review Performance
- Navigate to the Your Performance section.
- Review the overall performance score.
- Check the displayed performance level and rating.
- Review the team ranking.
- Check the recent activity trend.
4.4 Performance Metrics
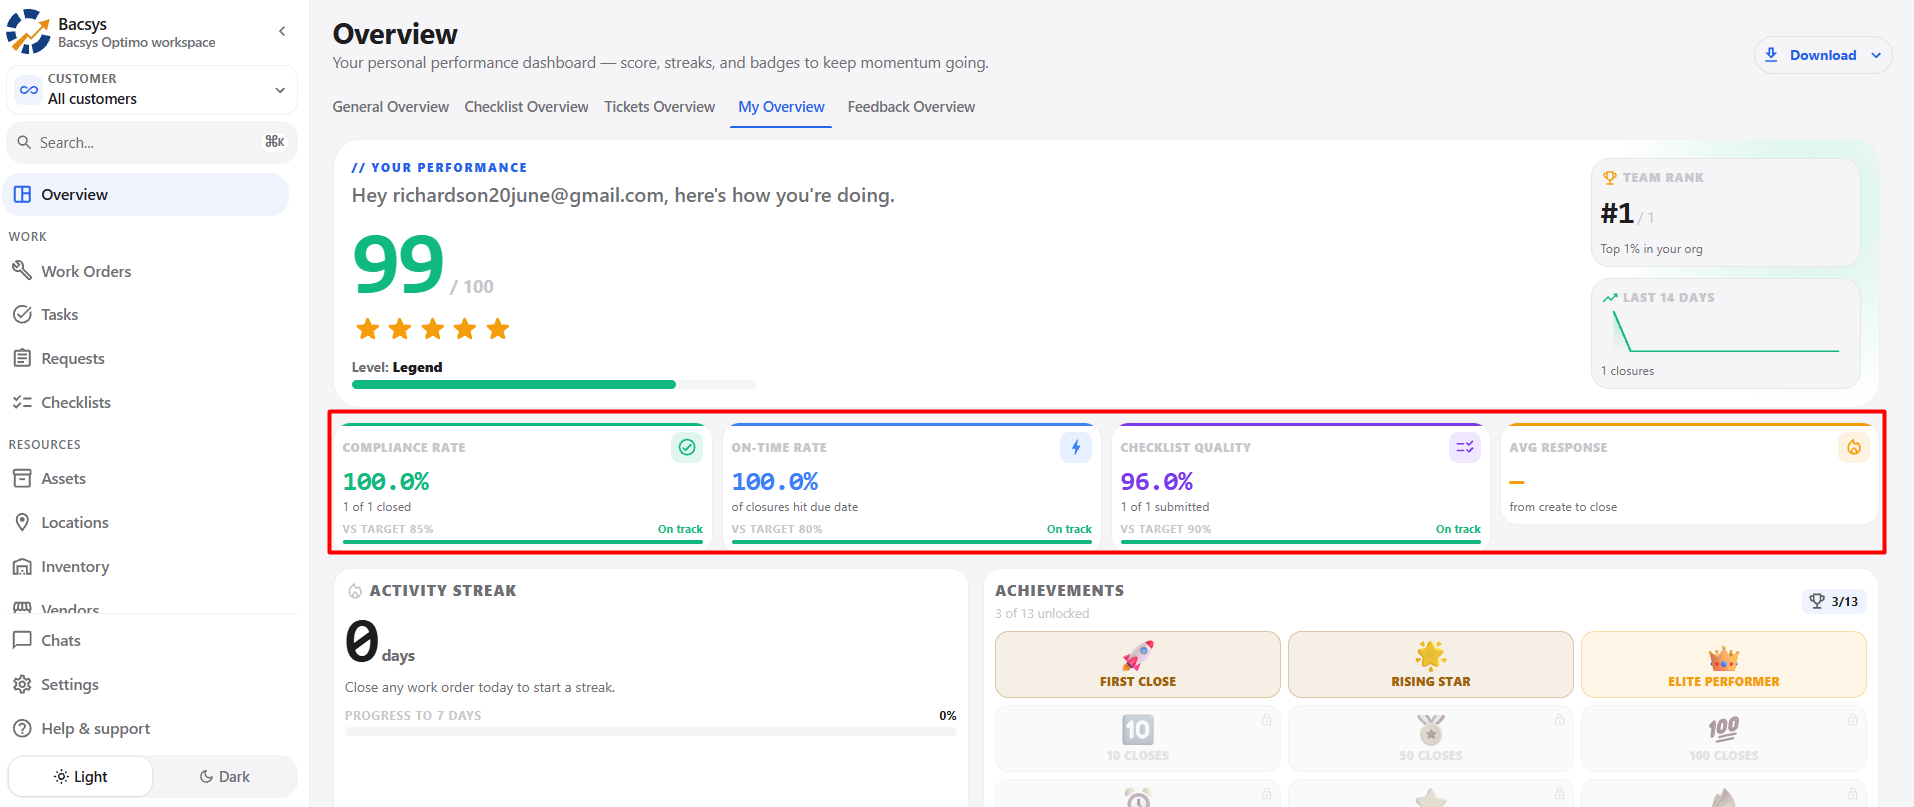
The performance dashboard provides individual metrics to help users understand their work performance.
Available Metrics
| Metric | Description |
|---|---|
| Compliance Rate | Percentage of applicable work completed according to the required criteria. |
| On-Time Rate | Percentage of work completed within the required due date. |
| Checklist Quality | Quality or completion percentage of submitted checklists. |
| Average Response | Average time taken from work creation to closure, when applicable. |
Steps to Review Metrics
- Review each performance metric.
- Compare the displayed value with the configured target.
- Check whether the metric is on track.
- Use the metrics to identify areas for improvement.
4.5 Team Rank
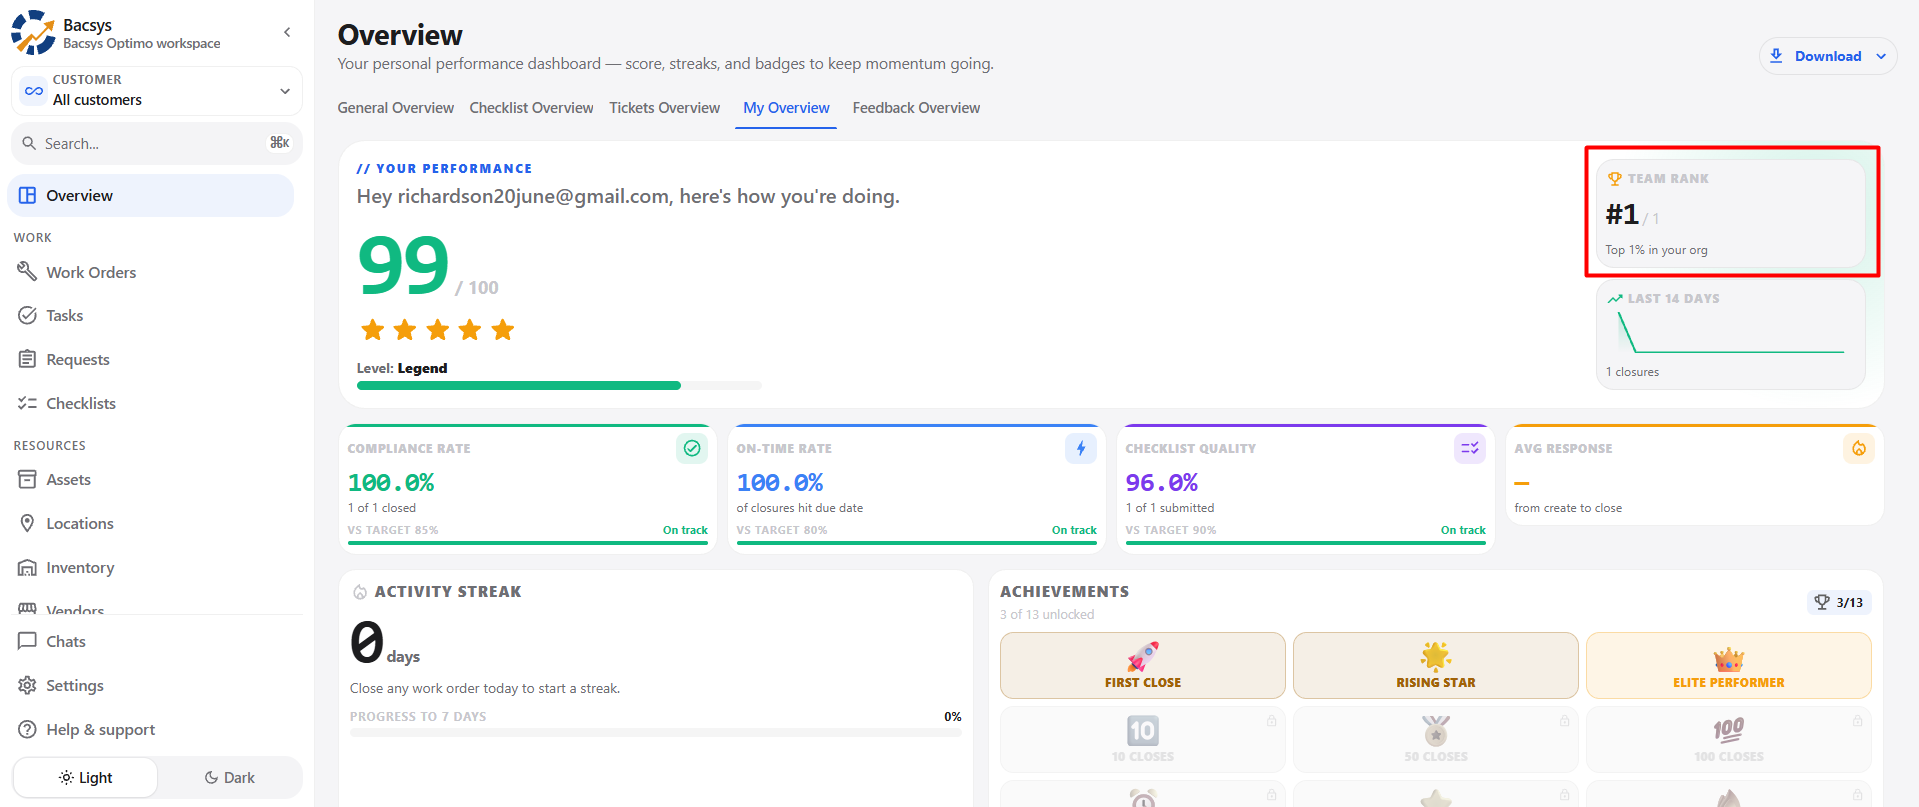
The Team Rank section displays the user's position within the organization or team based on the configured performance calculation.
Information Displayed
- Current rank
- Total number of users considered
- Relative team position
Functionality Details
- The rank should be calculated using the configured performance criteria.
- The ranking should update when the underlying performance data changes.
4.6 Recent Performance
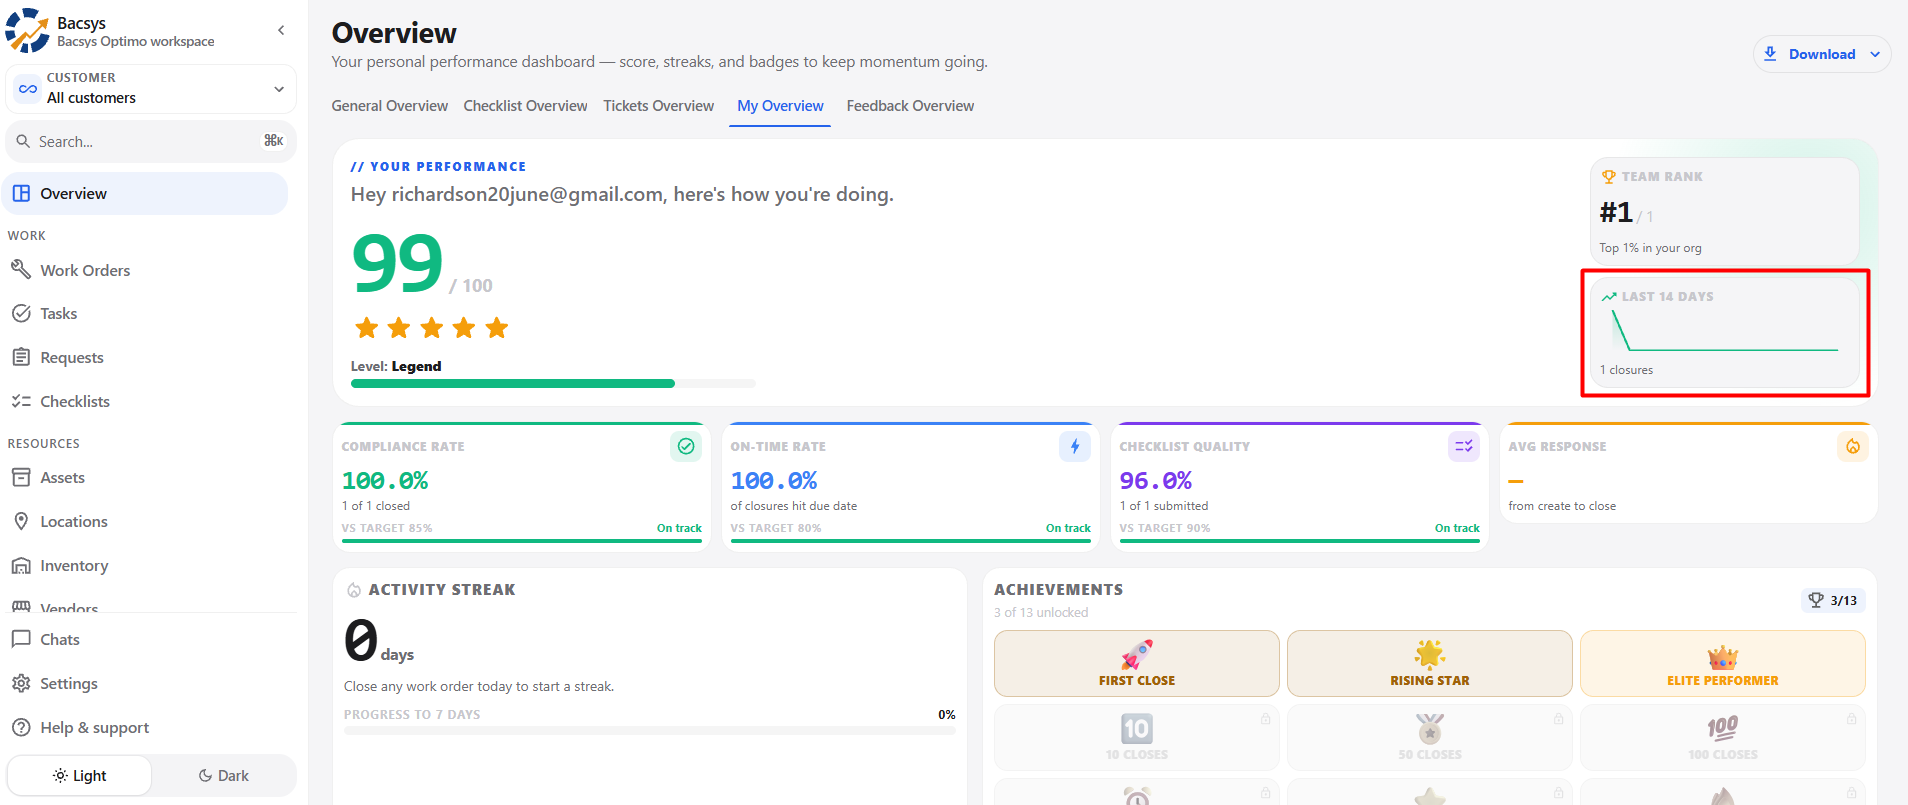
The Last 14 Days section provides a short-term view of the user's recent activity.
It helps users understand their recent work completion trend.
Steps to Review
- Navigate to the Last 14 Days section.
- Review the activity trend.
- Check the recent number of completed activities.
- Compare the recent activity with the overall performance.
4.7 Activity Streak
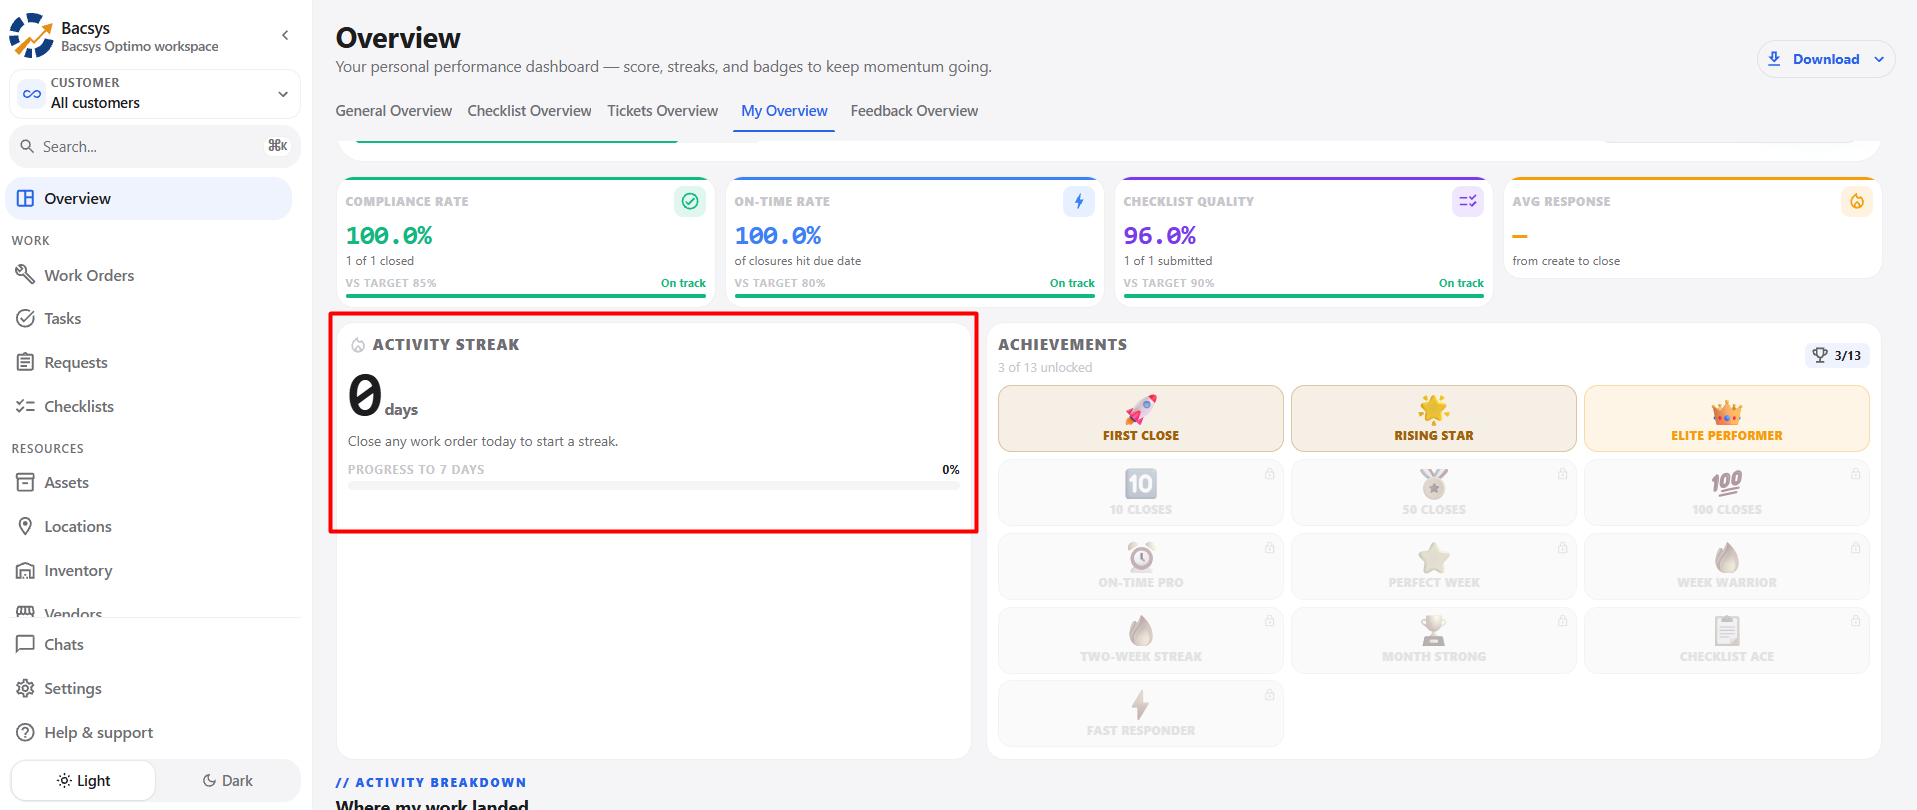
The Activity Streak section tracks consecutive days of work activity.
It encourages users to maintain regular work completion.
Information Displayed
- Current streak
- Number of active days
- Progress toward the configured streak target
Steps to Review Activity Streak
- Navigate to Activity Streak.
- Check the current number of consecutive active days.
- Review the progress toward the streak target.
- Continue completing applicable work to maintain the streak.
Functionality Details
- The streak should update based on the configured activity rules.
- Progress should reflect the current streak.
- The streak should reset according to the configured business rules when the required activity is not completed.
4.8 Achievements
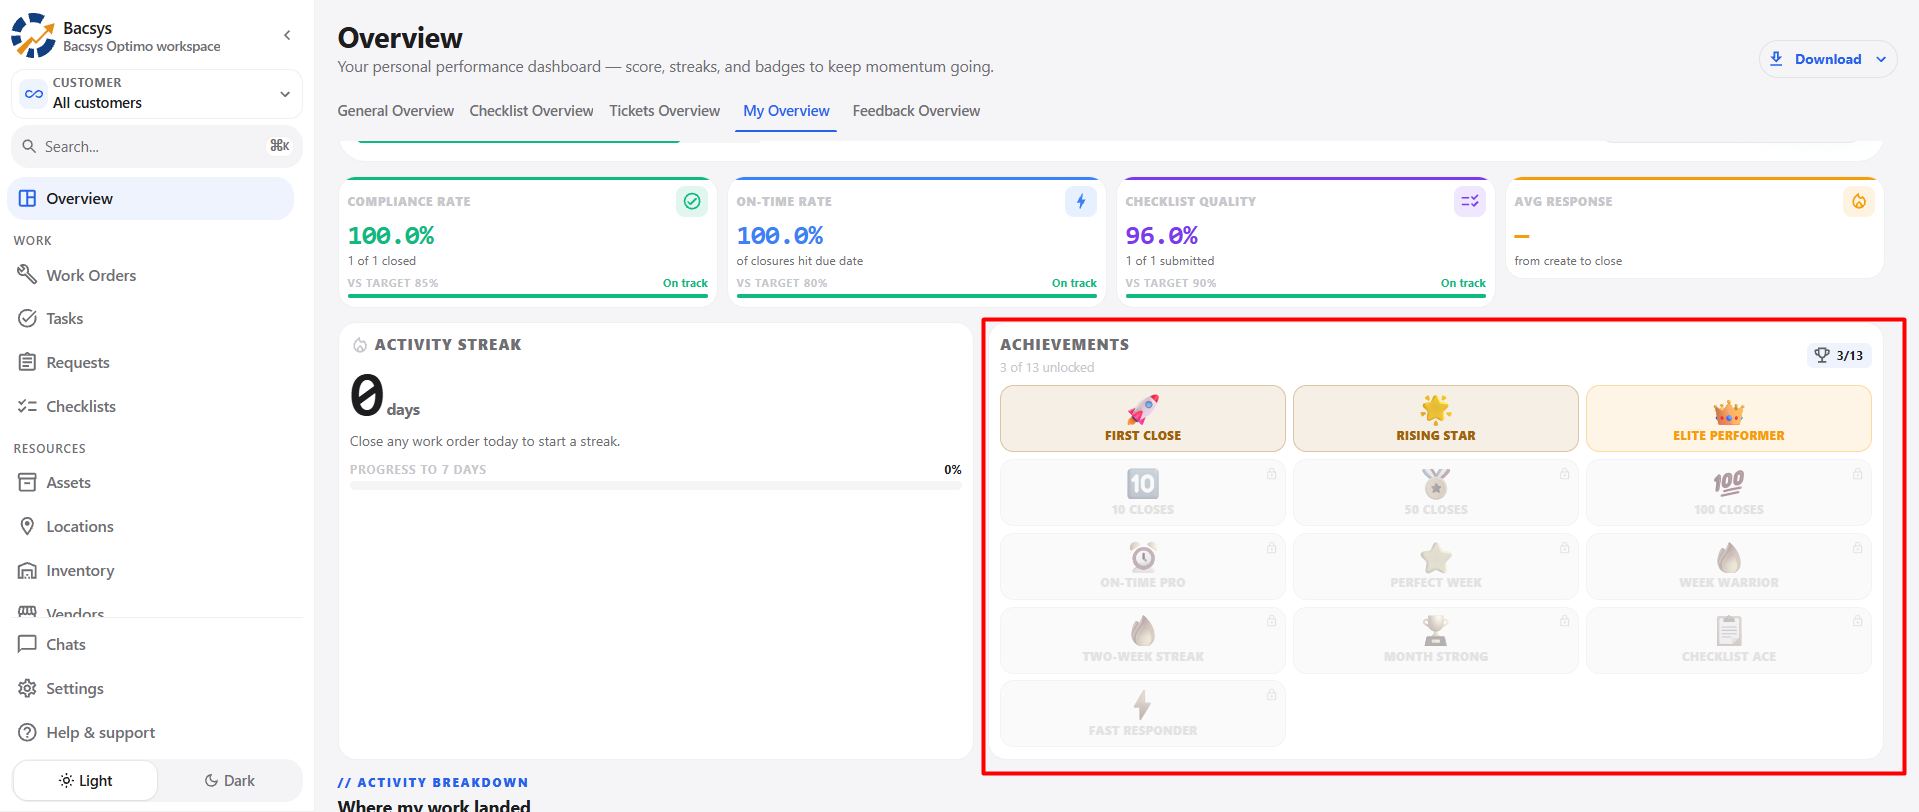
The Achievements section displays badges or achievements earned by the user.
It provides recognition for completed work and consistent performance.
Achievement Status
- Unlocked: Achievement requirements have been completed.
- Locked: Achievement requirements have not yet been completed.
Examples of Achievement Types
- First Close
- Rising Star
- Elite Performer
- Multiple Closures
- On-Time Pro
- Perfect Week
- Week Warrior
- Two-Week Streak
- Month Strong
- Checklist Ace
- Fast Responder
Steps to Review Achievements
- Navigate to the Achievements section.
- Review the available achievement badges.
- Identify unlocked achievements.
- Review locked achievements and their requirements, if available.
4.9 Activity Breakdown
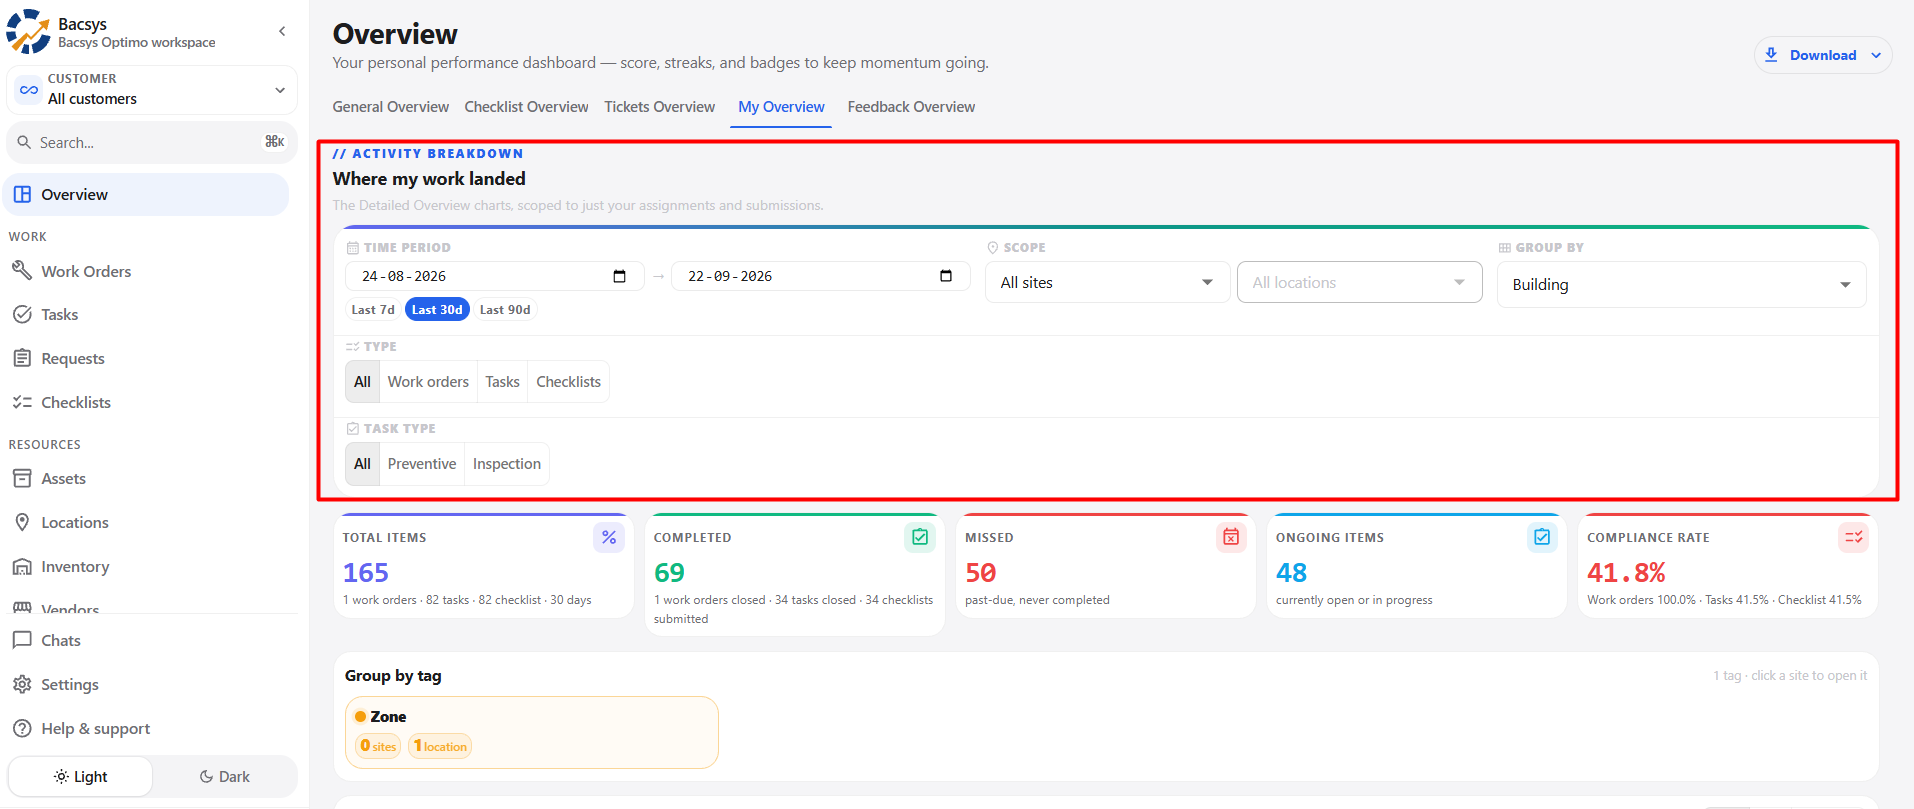
The Activity Breakdown section provides a detailed view of the user's assigned work and submissions.
It allows users to analyze their activity using different filters and performance views.
Information Displayed
- Total items
- Completed items
- Missed items
- Ongoing items
- Compliance rate
- Group-wise performance
- Daily completion rate
- Completion heatmap
- Time slot analysis
- Missed locations
4.10 Activity Breakdown Filters
The Activity Breakdown provides filters to control the displayed information.
Available Filters
| Filter | Description |
|---|---|
| Time Period | Select the required start and end dates. |
| Quick Date Filter | Select the last 7, 30, or 90 days. |
| Scope | Filter data by site. |
| Location | Filter data by location. |
| Group By | Group the activity by a selected dimension. |
| Type | Filter between All, Work Orders, Tasks, and Checklists. |
| Task Type | Filter tasks by All, Preventive, or Inspection. |
Steps to Apply Filters
- Select the required date range.
- Select a quick date option, if required.
- Select the required site from Scope.
- Select a location, if required.
- Select the required Group By option.
- Select the required work type.
- Select the required task type.
- Review the updated activity information.
4.11 Activity Summary
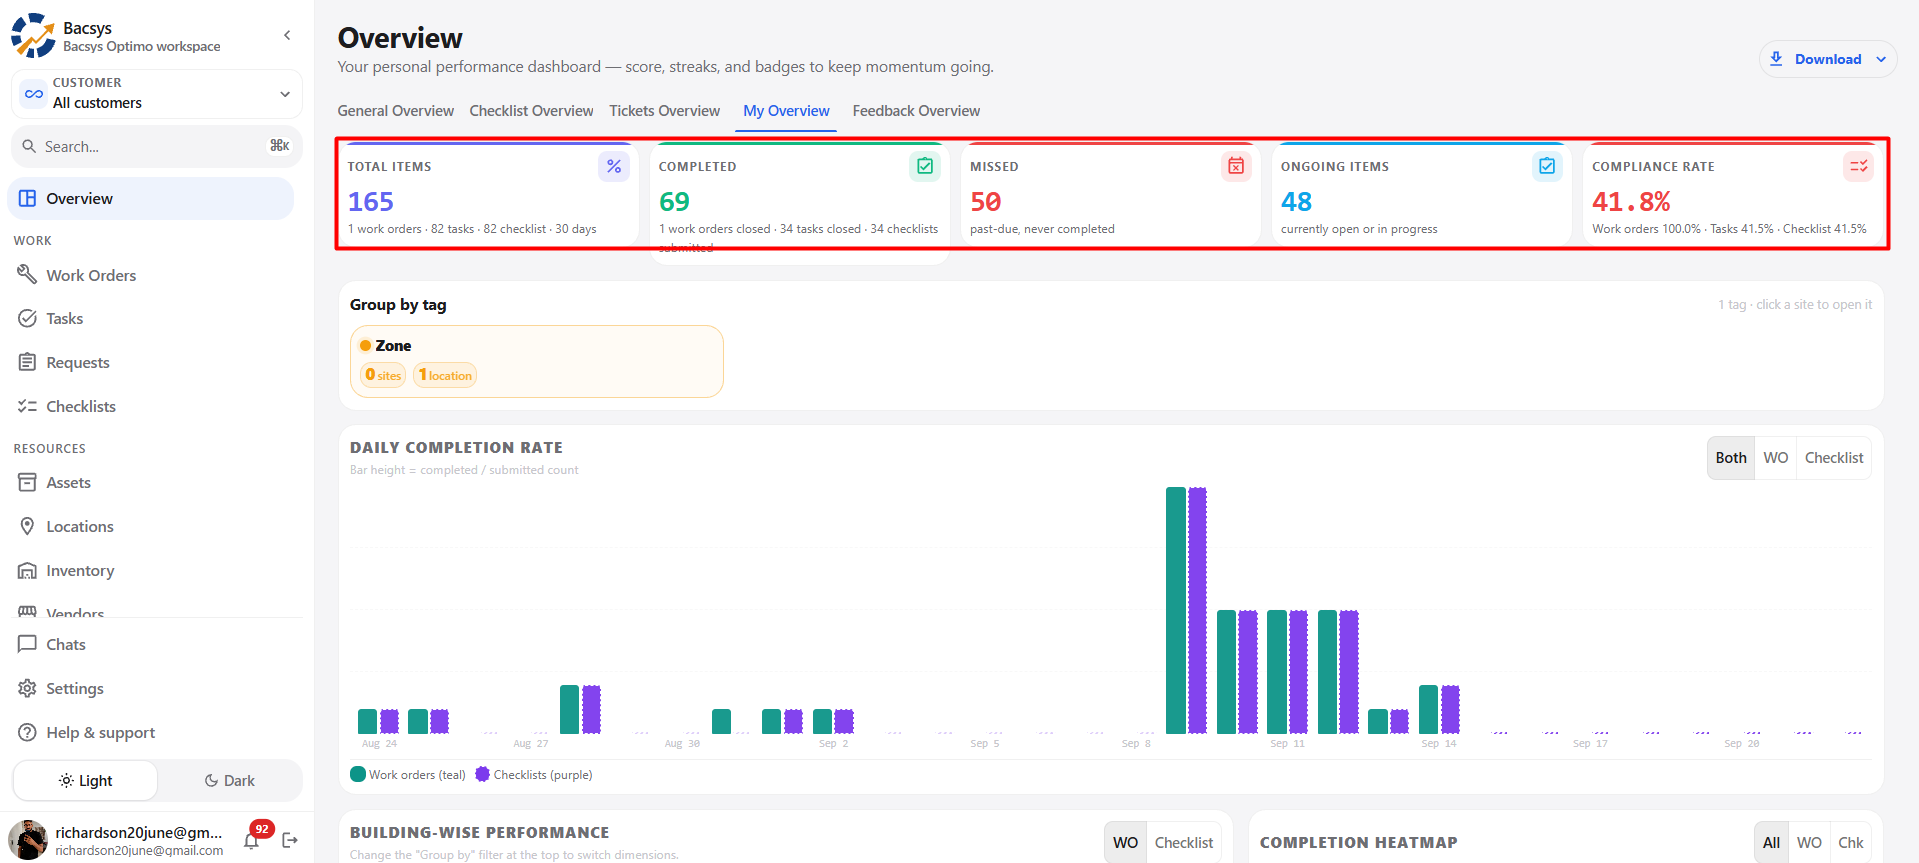
The activity summary displays the user's work status for the selected period.
Available Metrics
- Total Items: Total applicable work items.
- Completed: Work items completed or submitted.
- Missed: Scheduled items that were not completed.
- Ongoing Items: Items currently open or in progress.
- Compliance Rate: Overall completion/compliance percentage.
Functionality Details
- Metrics should reflect the selected filters.
- Values should update when the reporting period changes.
- The displayed metrics should correspond to the user's applicable work.
4.12 Group by Tag
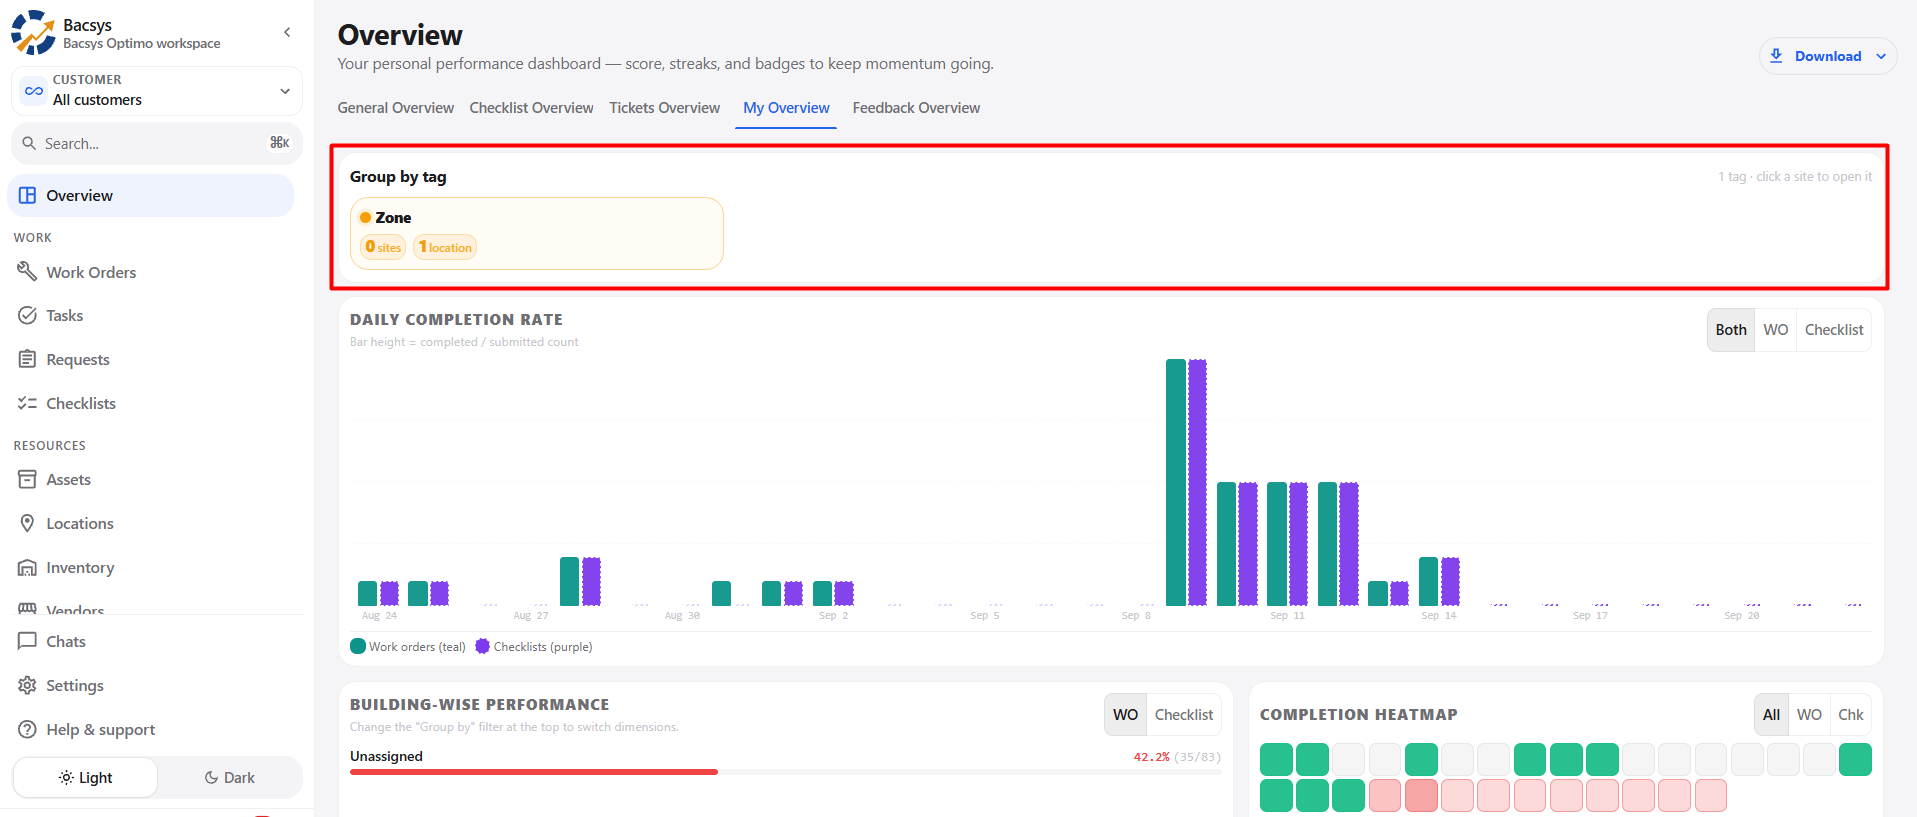
The Group by Tag section groups the user's work according to configured tags.
Steps to Review
- Navigate to Group by Tag.
- Review the available tags.
- Select a tag, if applicable.
- Review the associated site or location information.
The displayed information should reflect the selected reporting filters.
4.13 Daily Completion Rate
The Daily Completion Rate chart displays the user's completed work over the selected period.
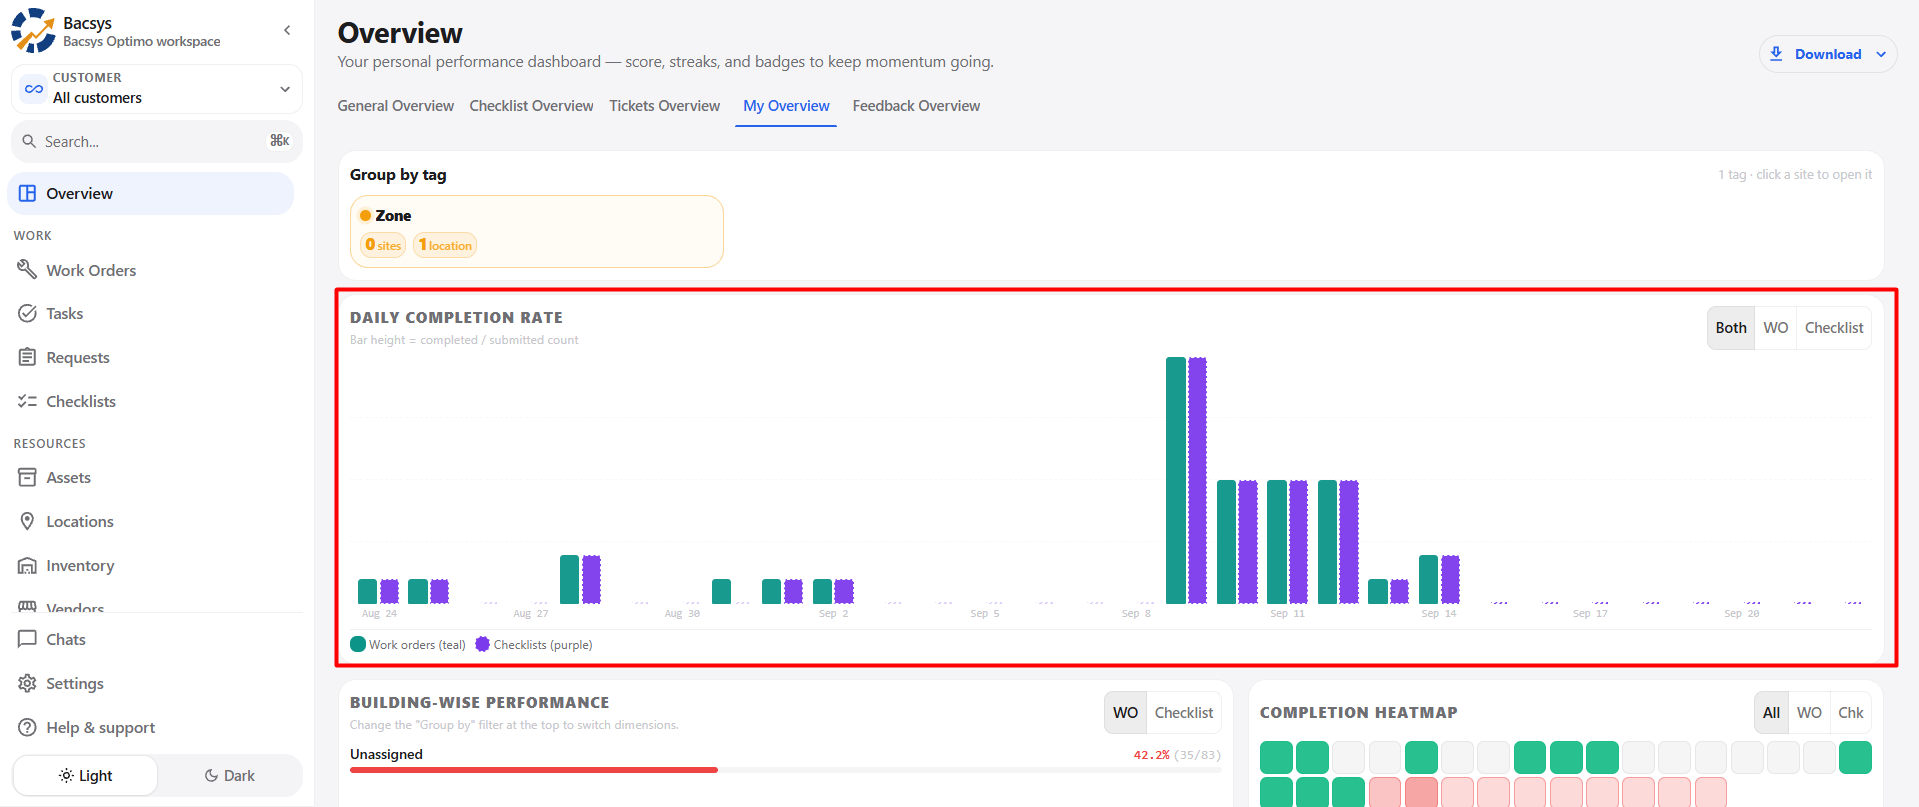
Available Views
- Both
- WO – Work Orders
- Checklist – Checklists
Steps to Review
- Navigate to the Daily Completion Rate section.
- Select Both, WO, or Checklist.
- Review the daily completion chart.
- Compare completion activity across the selected period.
Functionality Details
- The chart should reflect the selected reporting period.
- Work orders and checklist activity should be displayed correctly.
- Changing the view should update the chart.
4.14 Building-wise Performance
The Building-wise Performance section displays the user's performance based on the selected grouping dimension.
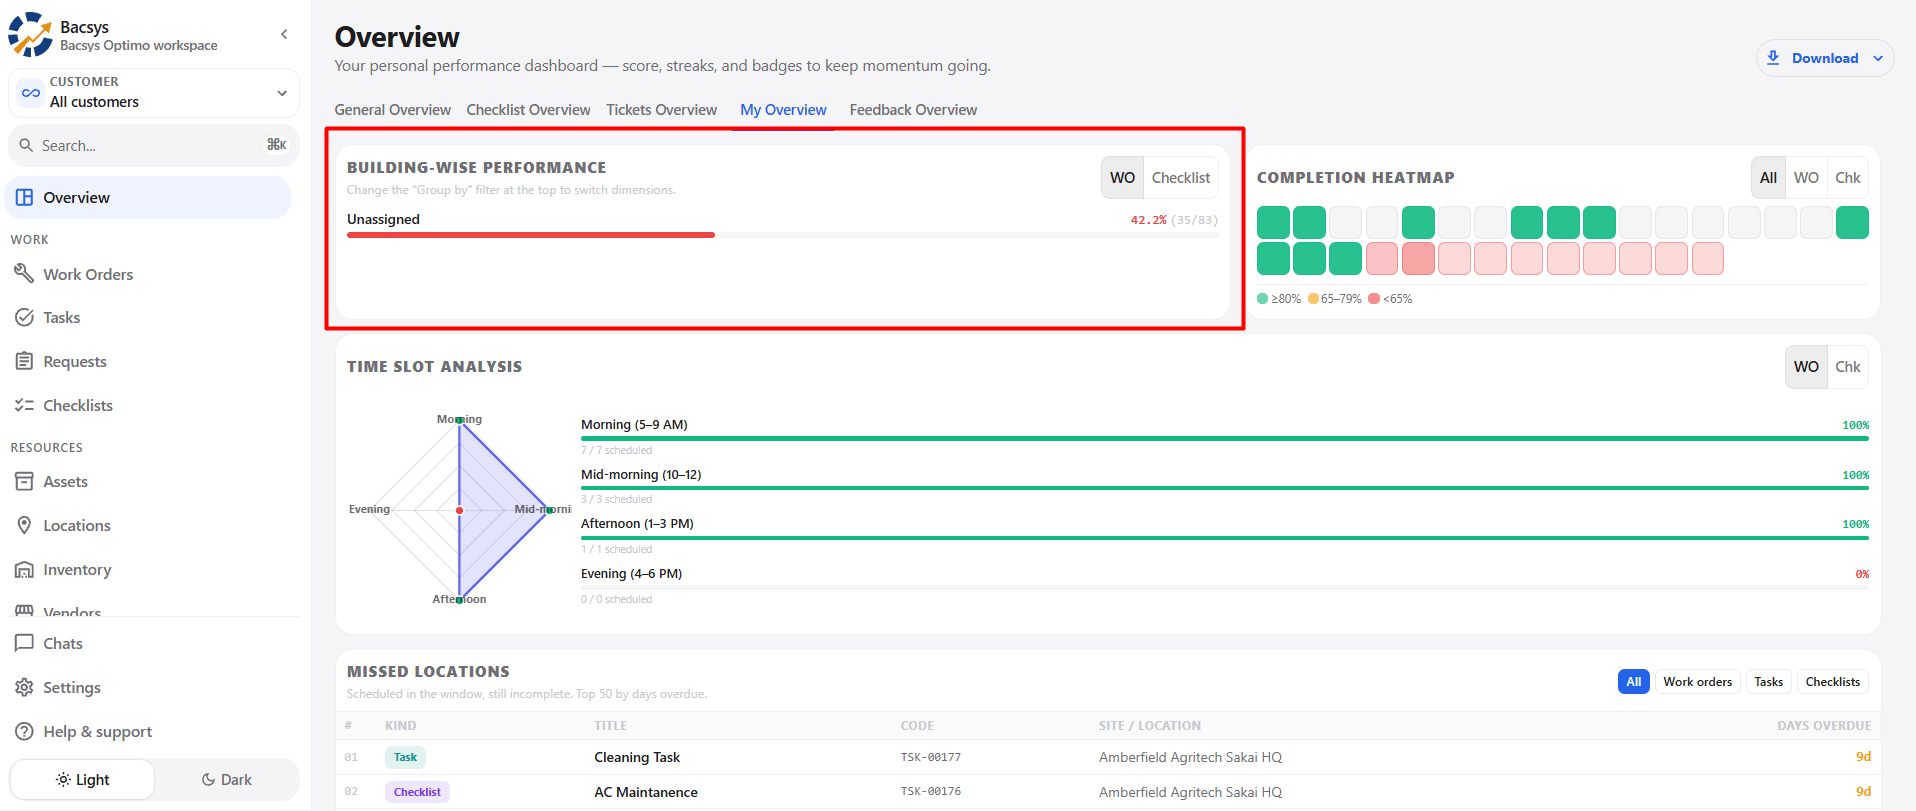
Available Views
- WO
- Checklist
Steps to Review
- Navigate to Building-wise Performance.
- Select the required view.
- Review the performance for the selected grouping.
- Compare performance across available groups.
The displayed performance should correspond to the selected filters and reporting period.
4.15 Completion Heatmap
The Completion Heatmap provides a visual representation of completion performance.
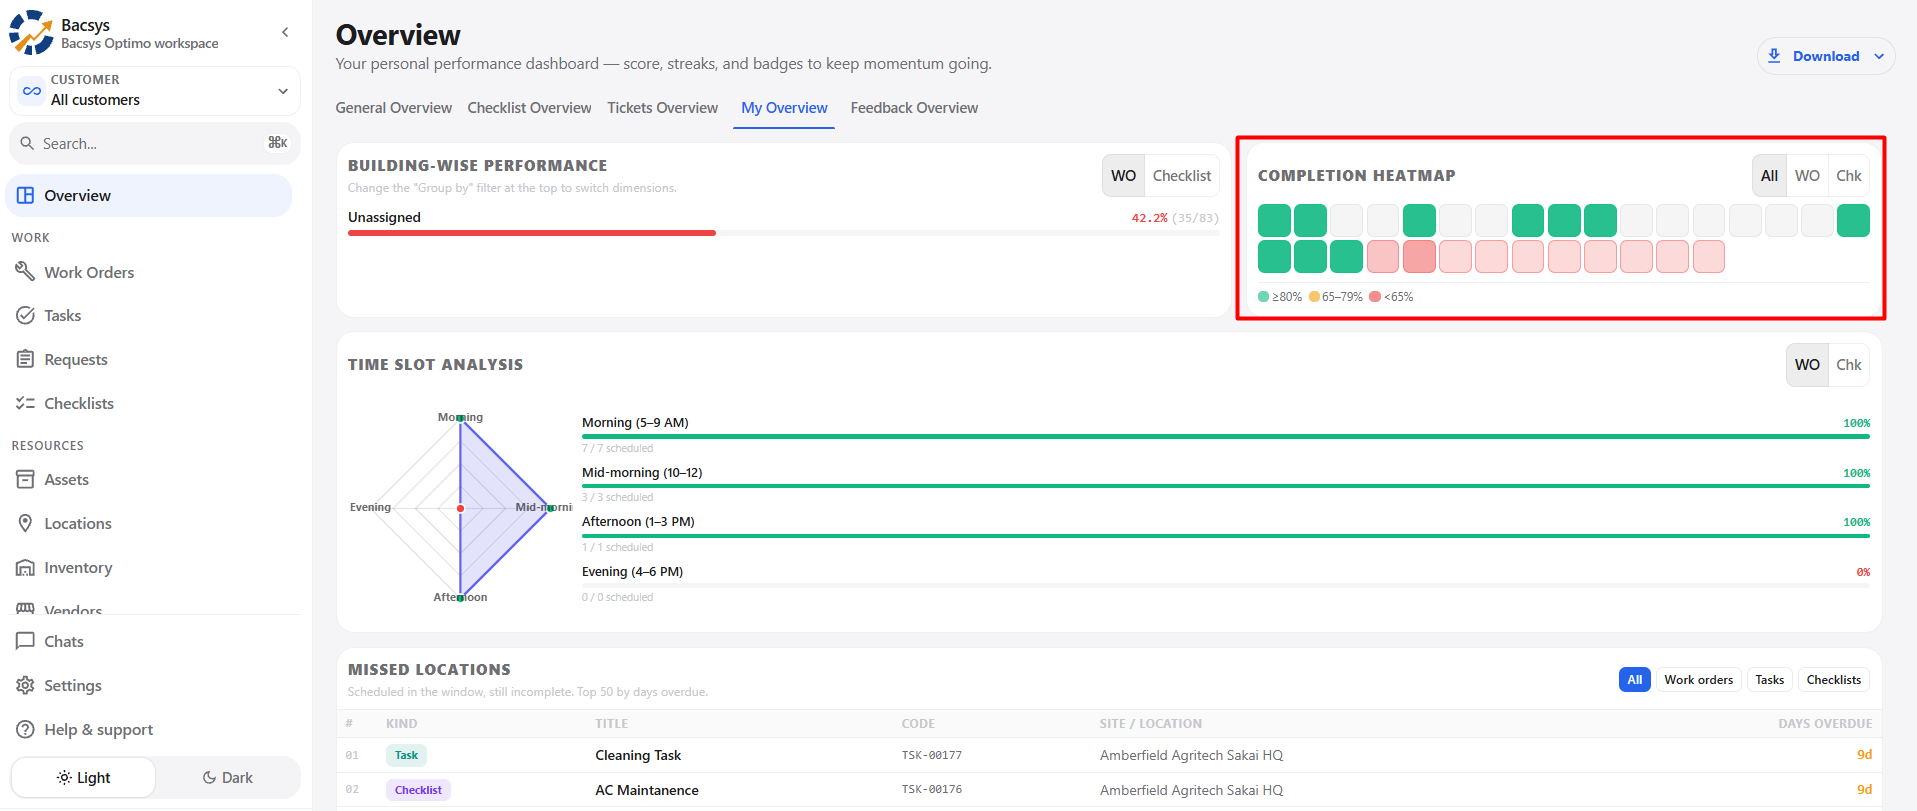
Available Views
- All
- WO
- Chk
Completion Levels
| Indicator | Completion Level |
|---|---|
| Green | 80% or above |
| Yellow | 65%–79% |
| Red | Below 65% |
Steps to Review
- Navigate to the Completion Heatmap.
- Select the required view.
- Review the displayed indicators.
- Use the legend to understand the completion levels.
4.16 Time Slot Analysis
The Time Slot Analysis displays the user's completion performance based on the scheduled time of the work.
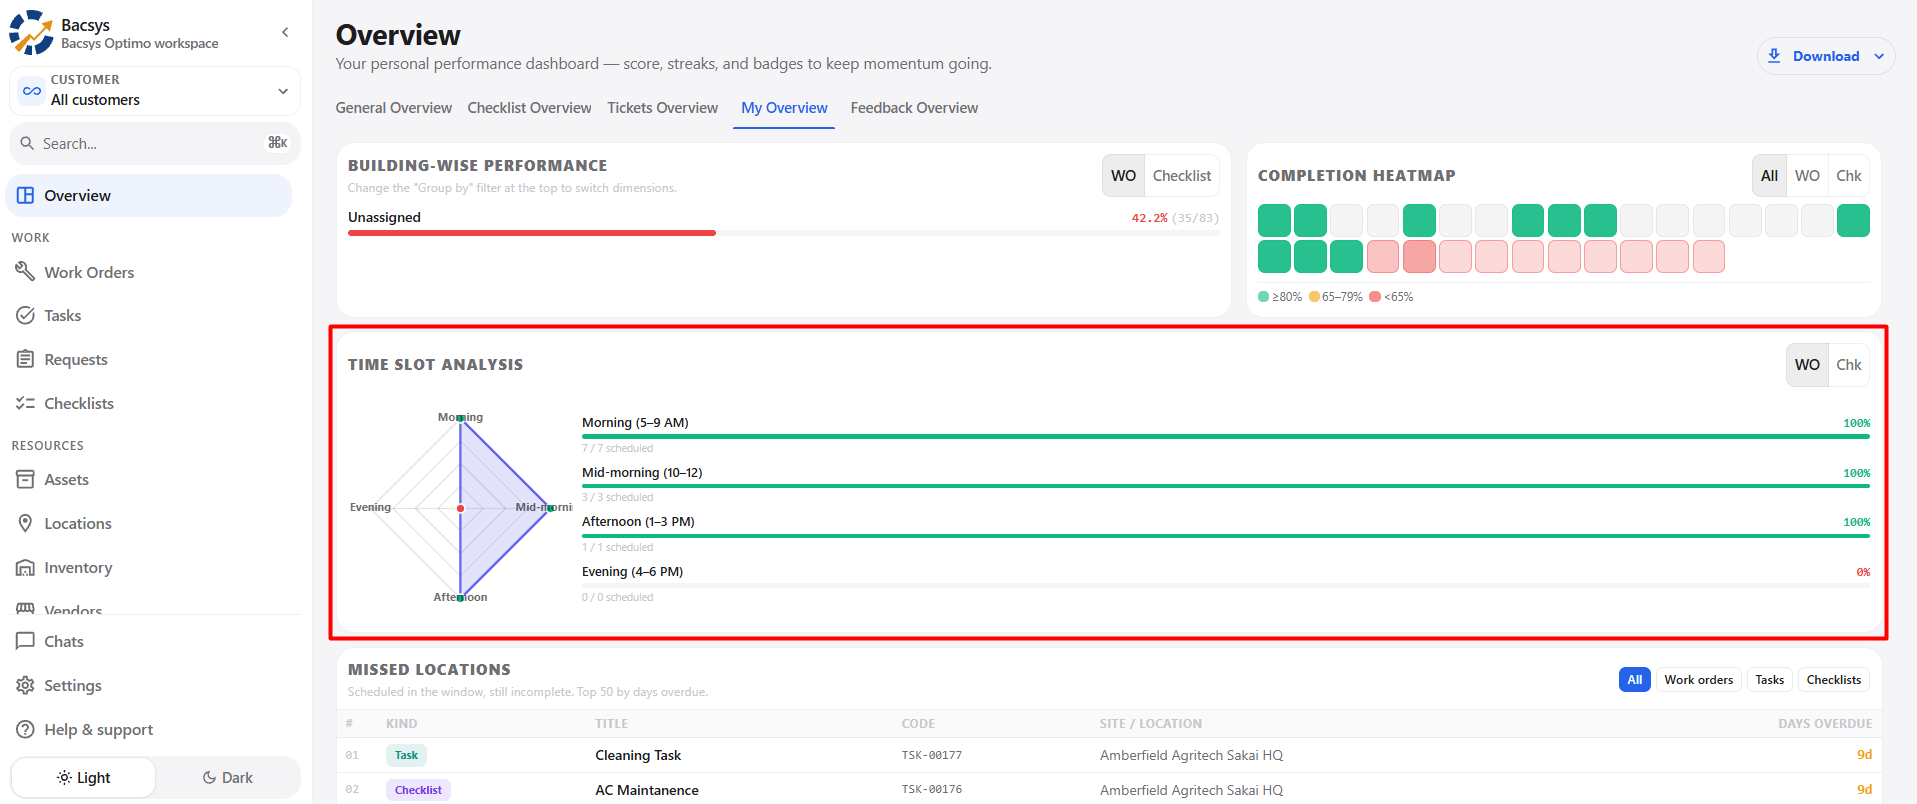
Available Time Slots
- Morning: 5–9 AM
- Mid-morning: 10 AM–12 PM
- Afternoon: 1–3 PM
- Evening: 4–6 PM
Available Views
- WO
- Chk
Steps to Review
- Navigate to Time Slot Analysis.
- Select WO or Chk.
- Review the scheduled items for each time slot.
- Check the completion percentage.
- Compare performance across different time slots.
4.17 Missed Locations
The Missed Locations section displays scheduled work that remains incomplete and identifies where the missed activities occurred.
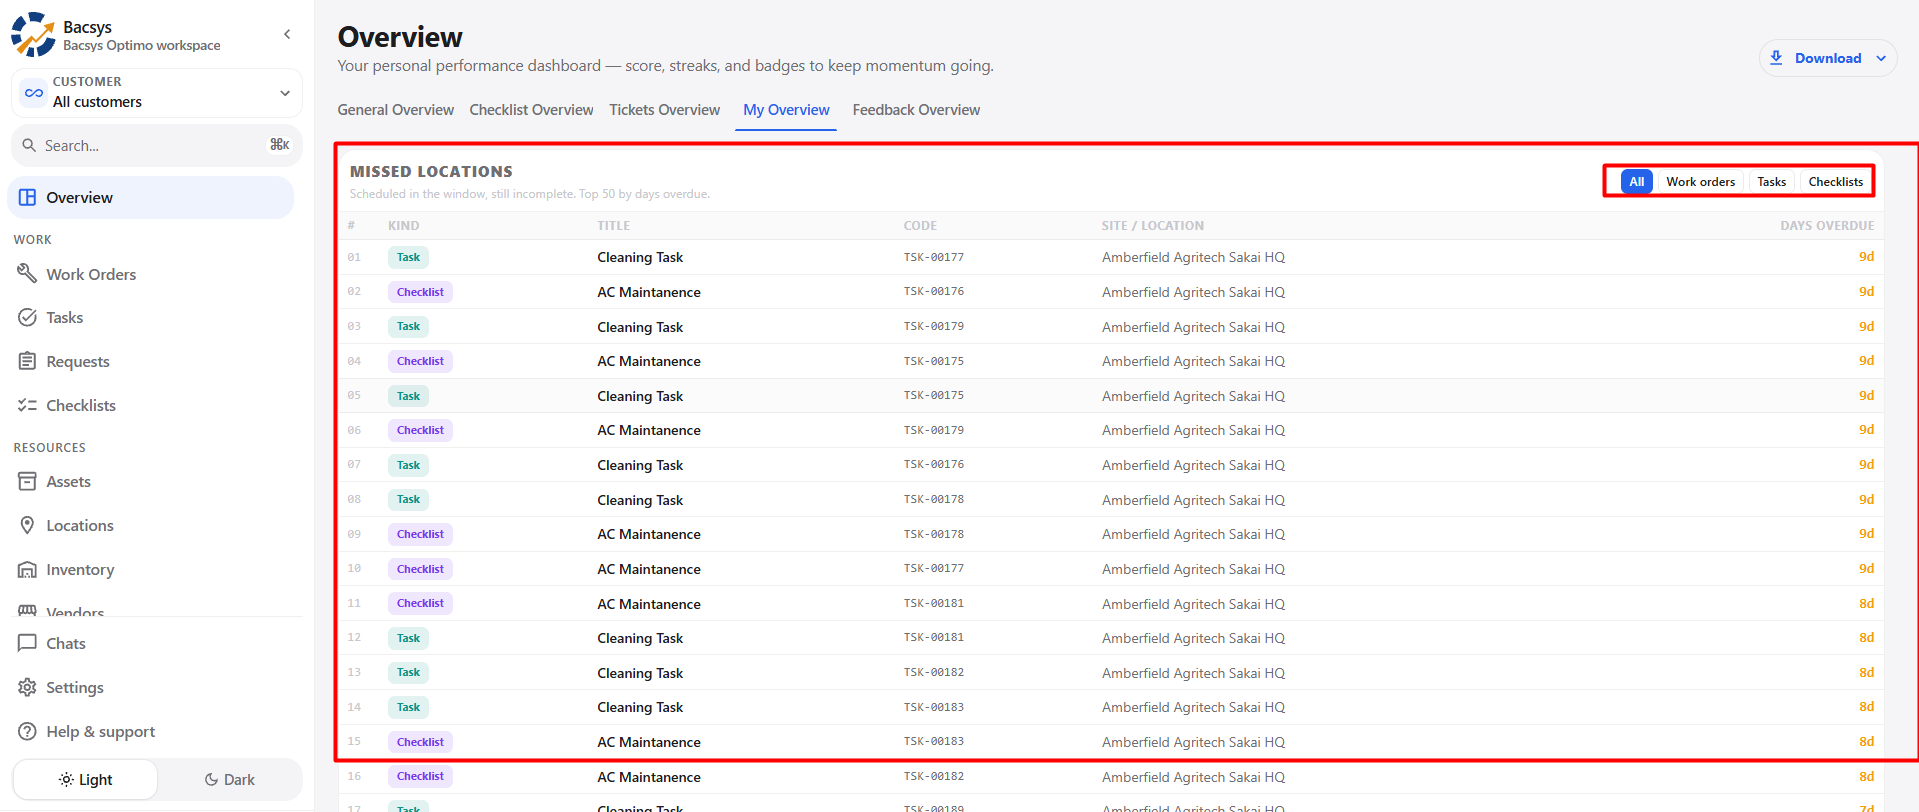
Available Filters
- All
- Work Orders
- Tasks
- Checklists
Information Displayed
- Item type
- Work or checklist title
- Reference code
- Site or location
- Days overdue
Steps to Review
- Navigate to Missed Locations.
- Select the required filter.
- Review the missed items.
- Check the associated site or location.
- Review how long each item has remained overdue.
4.18 Key Observations
The Key Observations section automatically highlights important performance findings from the selected period.
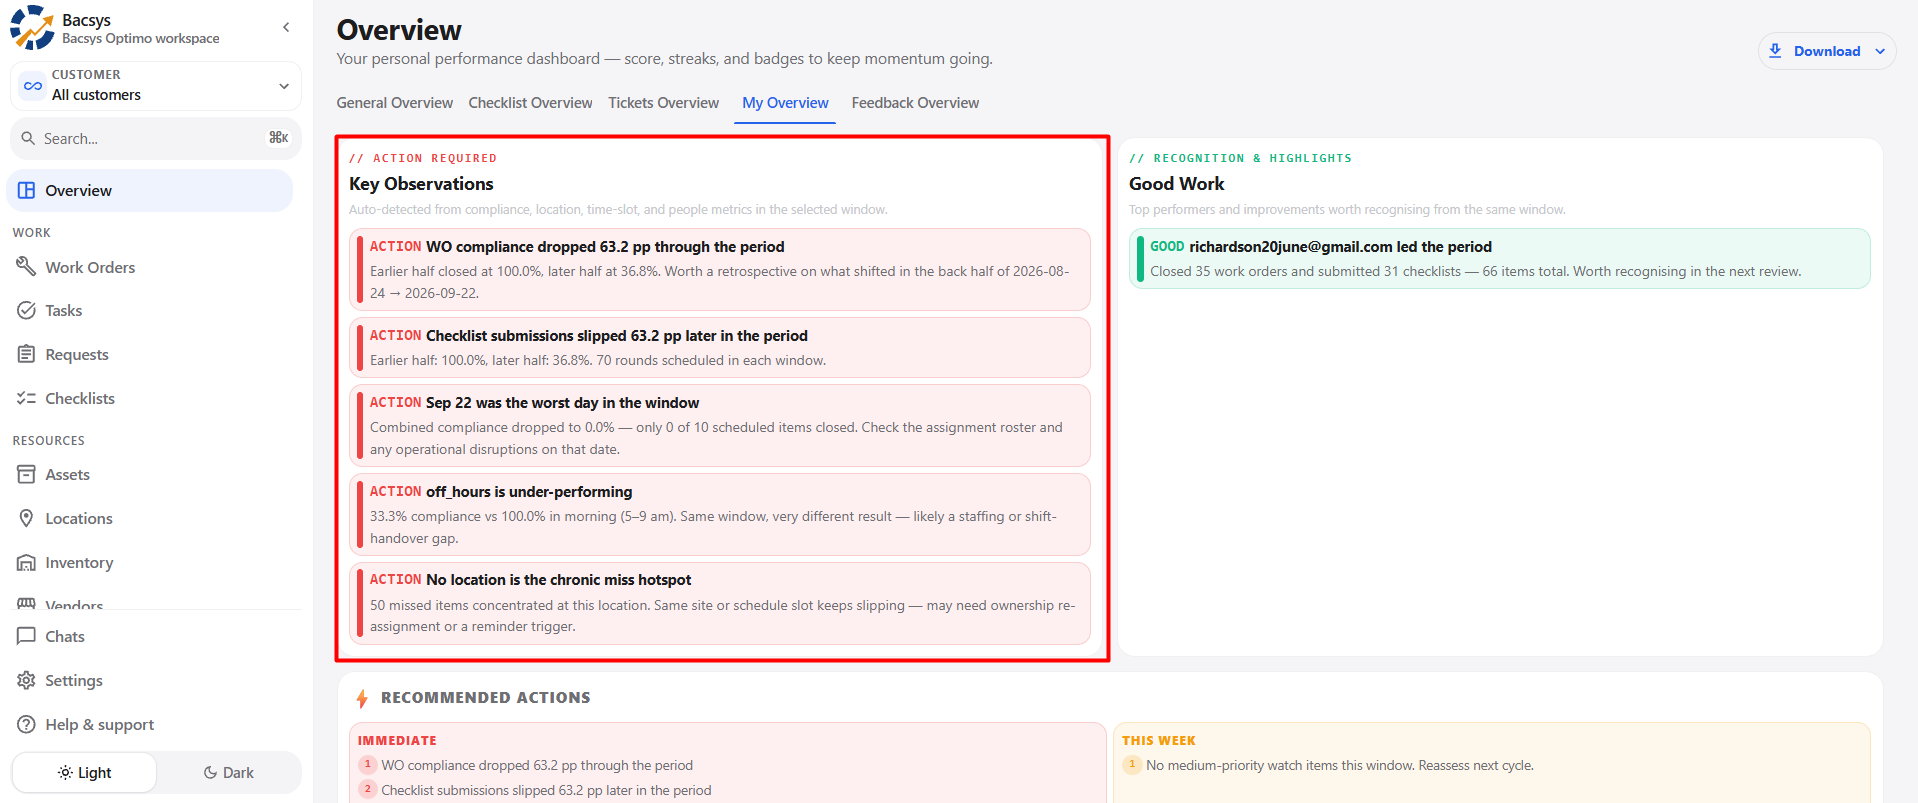
Observations may identify:
- Changes in compliance
- Completion performance issues
- Missed activities
- Poor-performing time slots
- Location-based issues
- Other significant performance trends
Steps to Review
- Navigate to Key Observations.
- Review the highlighted observations.
- Identify areas requiring attention.
- Refer to the related dashboard metrics for further understanding.
4.19 Good Work
The Good Work section highlights positive performance and achievements during the selected period.
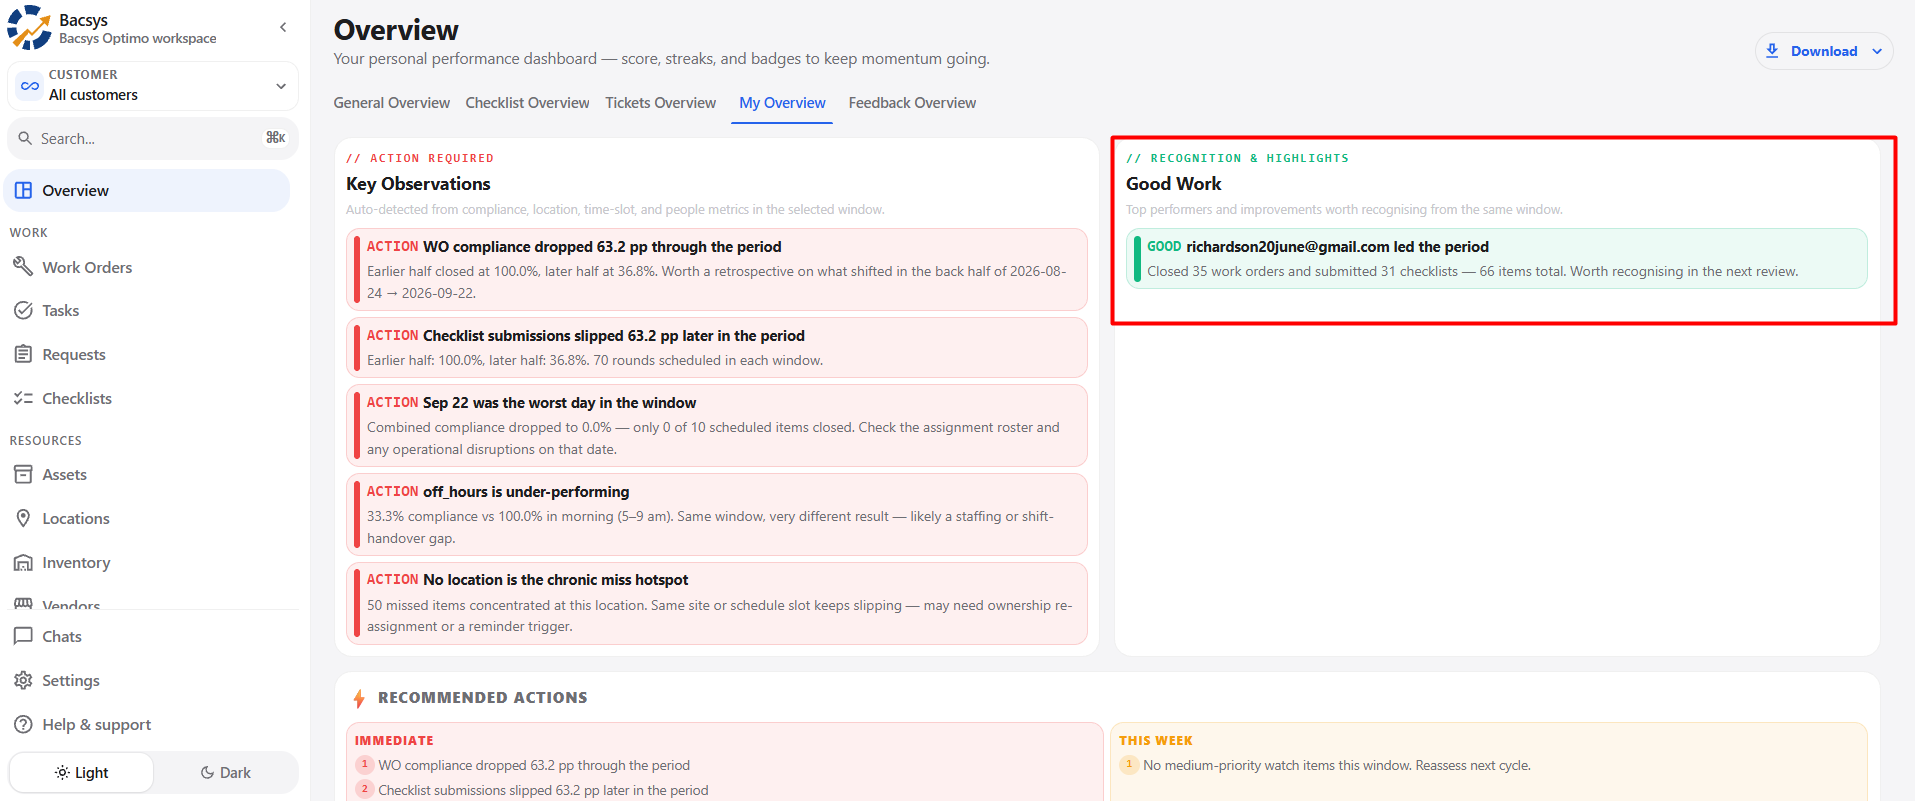
It may recognize:
- High work completion
- Strong checklist performance
- Consistent activity
- Positive performance improvements
- Other notable achievements
Steps to Review
- Navigate to Good Work.
- Review the highlighted performance.
- Identify the activities or achievements being recognized.
- Use the information to understand positive performance trends.
4.20 Recommended Actions
The Recommended Actions section provides suggested actions based on the user's performance data.
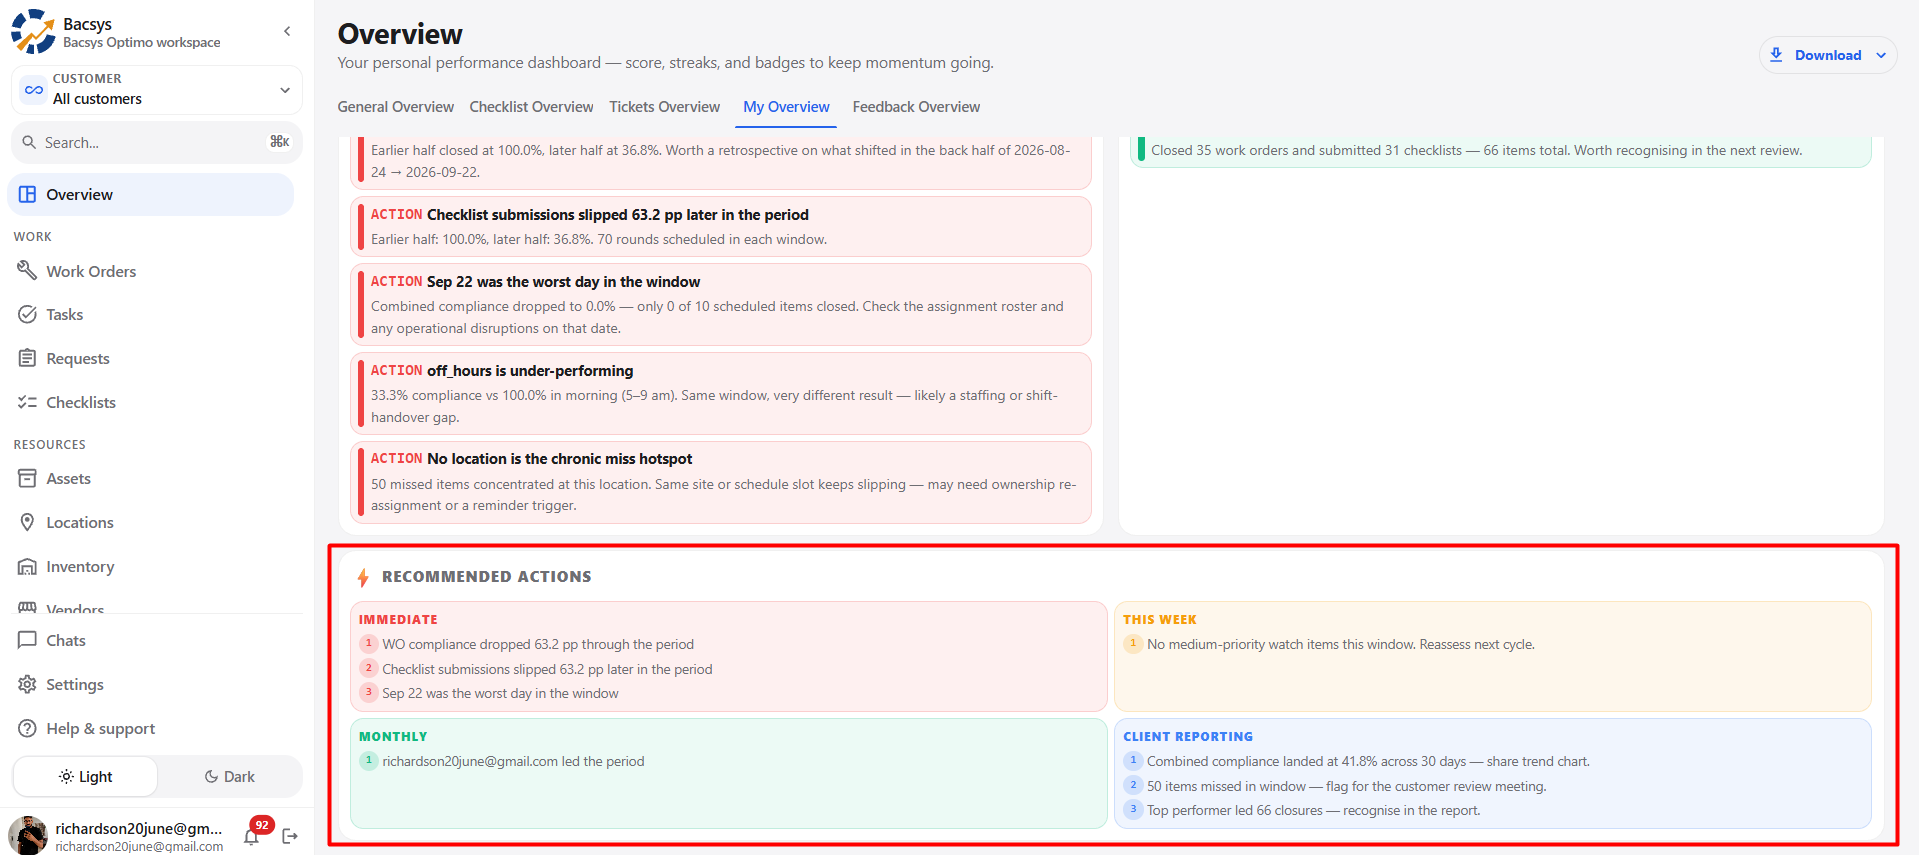
Action Categories
| Category | Description |
|---|---|
| Immediate | Actions requiring immediate attention. |
| This Week | Actions recommended for the current week. |
| Monthly | Actions for ongoing monitoring or improvement. |
| Client Reporting | Information that may be useful for client reporting. |
Steps to Review Recommended Actions
- Navigate to Recommended Actions.
- Review the actions under each category.
- Identify actions requiring immediate attention.
- Review weekly and monthly recommendations.
- Review any information identified for client reporting.
- Take the appropriate action based on the recommendations.
4.21 Overall Workflow
Users can review their personal performance using the following workflow:
- Open Overview.
- Select My Overview.
- Review the Your Performance score and ranking.
- Review the individual performance metrics.
- Check the Activity Streak.
- Review earned Achievements.
- Open the Activity Breakdown.
- Apply the required date, site, location, and work-type filters.
- Review the activity summary.
- Check the Daily Completion Rate.
- Review Building-wise Performance.
- Check the Completion Heatmap.
- Review Time Slot Analysis.
- Check Missed Locations for overdue work.
- Review Key Observations.
- Review Good Work and recognized achievements.
- Check Recommended Actions for areas requiring attention.
- Use Download to export the overview as PDF, PNG, or HTML, when required.